| Param | Original file | Final file |
|---|---|---|
| Filename | modeM0/AS1A05_013T01_9000003070_20791cztM0_level2.evt | modeM0/AS1A05_013T01_9000003070_20791cztM0_level2_quad_clean.evt |
| Size (bytes) | 904,599,360 | 173,566,080 |
| Size | 862.7 MB | 165.5 MB |
| Events in quadrant A | 5,582,228 | 1,146,511 |
| Events in quadrant B | 6,139,154 | 1,123,195 |
| Events in quadrant C | 5,580,429 | 1,101,344 |
| Events in quadrant D | 9,273,872 | 1,048,330 |
| Mode SS | |||
|---|---|---|---|
| Quadrant | BADHDUFLAG | Total packets | Discarded packets |
| A | 0 | 318 | 62 |
| B | 0 | 323 | 67 |
| C | 0 | 323 | 66 |
| D | 0 | 322 | 76 |
| Mode M0 | |||
|---|---|---|---|
| Quadrant | BADHDUFLAG | Total packets | Discarded packets |
| A | 0 | 32300 | 7474 |
| B | 0 | 35658 | 9313 |
| C | 0 | 32270 | 7360 |
| D | 0 | 49425 | 14045 |
| Mode M9 | |||
|---|---|---|---|
| Quadrant | BADHDUFLAG | Total packets | Discarded packets |
| A | 0 | 13 | 1 |
| B | 0 | 17 | 5 |
| C | 0 | 13 | 1 |
| D | 0 | 12 | 0 |
| Quadrant | Total seconds | Saturated seconds | Saturation percentage |
|---|---|---|---|
| A | 12127 | 93 | 0.766884% |
| B | 12096 | 153 | 1.264881% |
| C | 12165 | 116 | 0.953555% |
| D | 11916 | 1094 | 9.180933% |
Noise dominated data is calculated using 1-second bins in cleaned event files. If a bin has >2000 counts, and if more than 50% of those come from <1% of pixels, then it is considered to be noise-dominated and hence unusable.
| Quadrant | # 1 sec bins | Bins with >0 counts | Bins with >2000 counts | High rate bins dominated by noise | Noise dominated (total time) | Noise dominated (detector-on time) | Marked lightcurve |
|---|---|---|---|---|---|---|---|
| A | 25455 | 12629 | 0 | 0 | 0.00% | 0.00% | 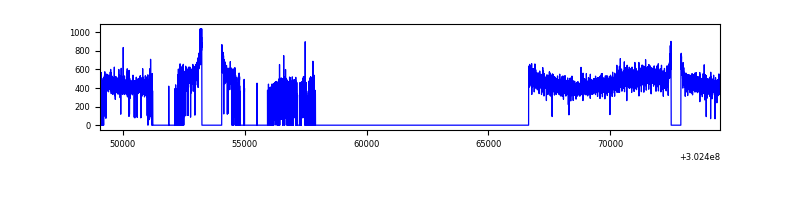 |
| B | 25455 | 12606 | 36 | 36 | 0.14% | 0.29% | 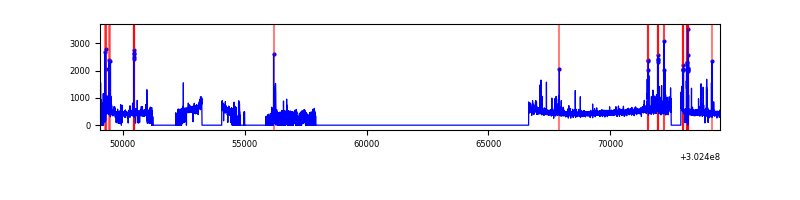 |
| C | 25454 | 12659 | 0 | 0 | 0.00% | 0.00% |  |
| D | 25454 | 12385 | 847 | 847 | 3.33% | 6.84% | 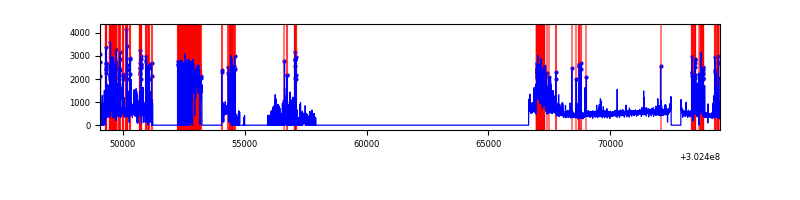 |
Top three noisy pixels from each quadrant. If the there are fewer than three noisy pixels in the level2.evt file, extra rows are filled as -1
| Pixel properties | Quadrant properties | ||||||
|---|---|---|---|---|---|---|---|
| Quadrant | DetID | PixID | Counts | Sigma | Mean | Median | Sigma |
| A | 0 | 226 | 12645 | 38.24 | 1451 | 1422 | 293.5 |
| A | 3 | 137 | 11693 | 34.99 | 1451 | 1422 | 293.5 |
| A | 12 | 194 | 10574 | 31.18 | 1451 | 1422 | 293.5 |
| B | 7 | 220 | 194514 | 719.63 | 1426 | 1392 | 268.4 |
| B | 0 | 182 | 71657 | 261.83 | 1426 | 1392 | 268.4 |
| B | 3 | 64 | 54511 | 197.94 | 1426 | 1392 | 268.4 |
| C | 14 | 238 | 213915 | 664.05 | 1371 | 1379 | 320.1 |
| C | 7 | 247 | 11466 | 31.51 | 1371 | 1379 | 320.1 |
| C | 13 | 61 | 9713 | 26.04 | 1371 | 1379 | 320.1 |
| D | 1 | 20 | 1695547 | 5314.71 | 1320 | 1283 | 318.8 |
| D | 1 | 52 | 1335464 | 4185.17 | 1320 | 1283 | 318.8 |
| D | 12 | 227 | 845190 | 2647.24 | 1320 | 1283 | 318.8 |
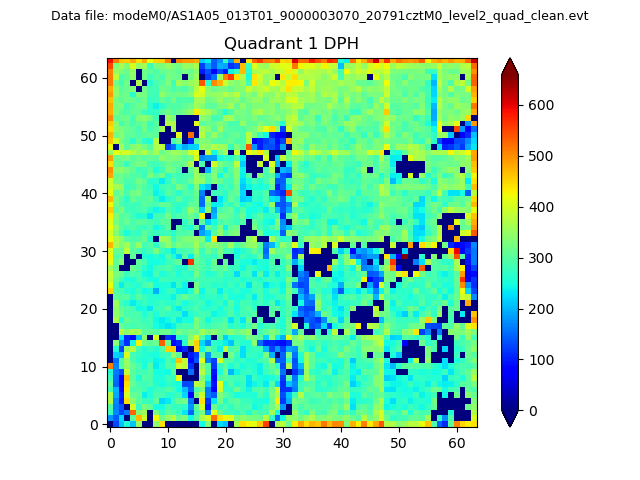
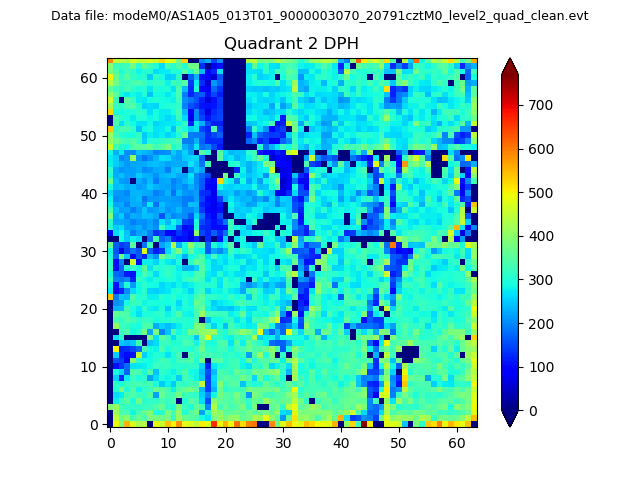
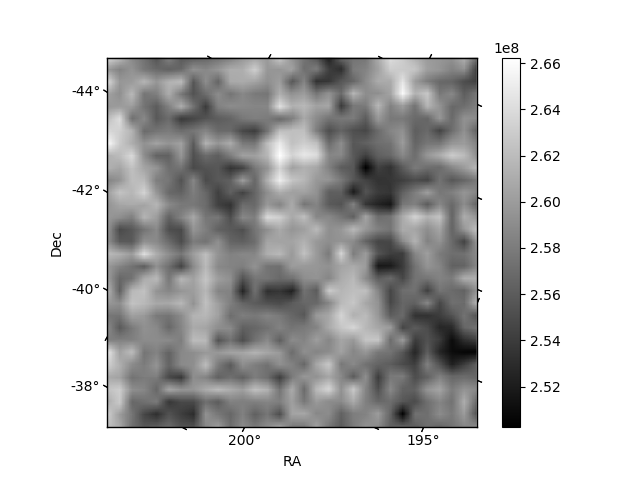
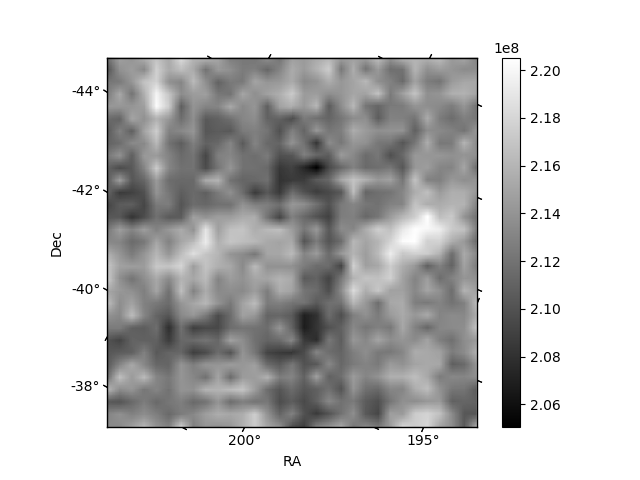
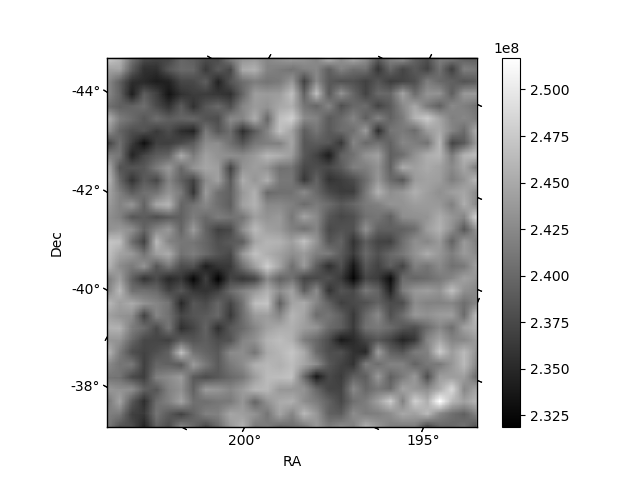
Histogram calculated using DETX and DETY for each event in the final _common_clean file
| Quadrant A | 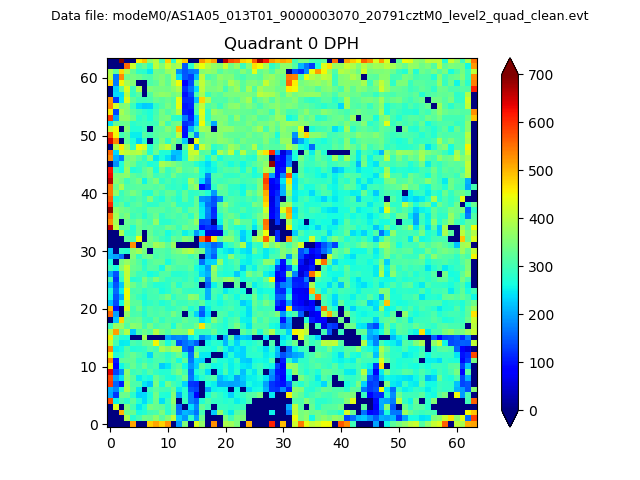 |
 |
Quadrant B |
|---|---|---|---|
| Quadrant D | 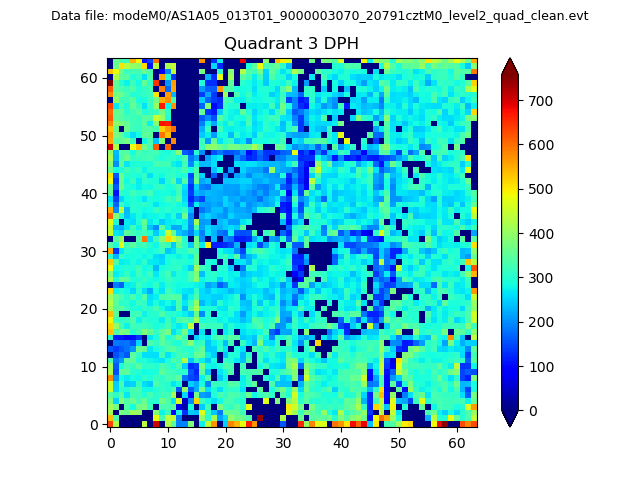 |
 |
Quadrant C |
| Plot type | Count rate plots | Images |
|---|---|---|
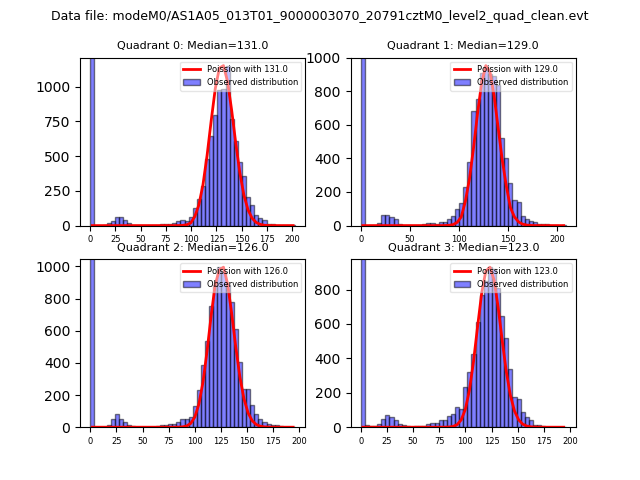
| Comparison with Poisson distribution Blue bars denote a histogram of data divided into 1 sec bins. Red curve is a Poisson curve with rate = median count rate of data. |
 |
 |
| Quadrant-wise count rates Data is divided into 100 sec bins |
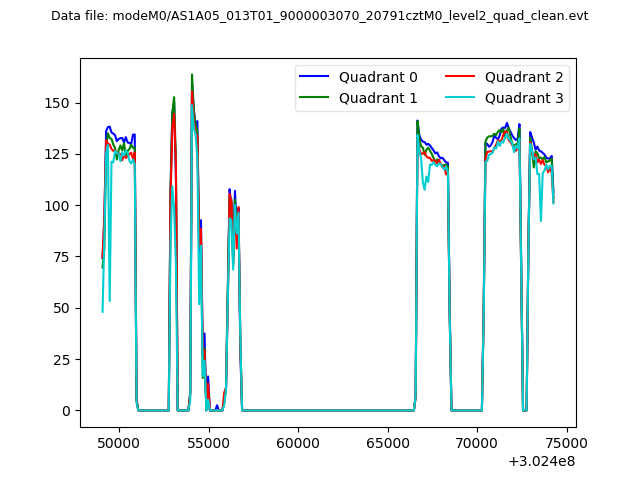 |
|
| Module-wise count rates for Quadrant A Data is divided into 100 sec bins |
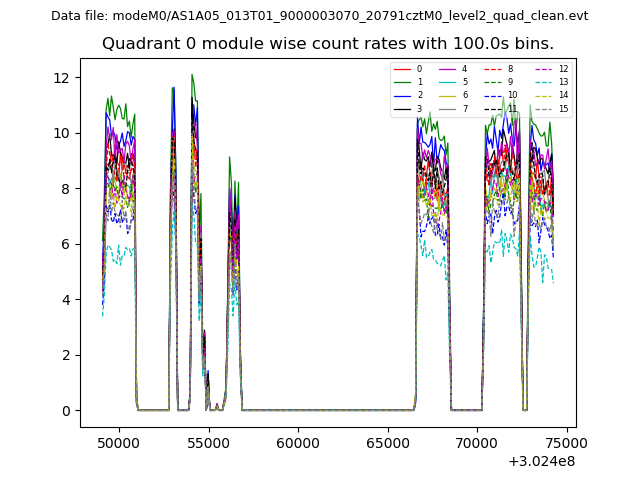 |
 |
| Module-wise count rates for Quadrant B Data is divided into 100 sec bins |
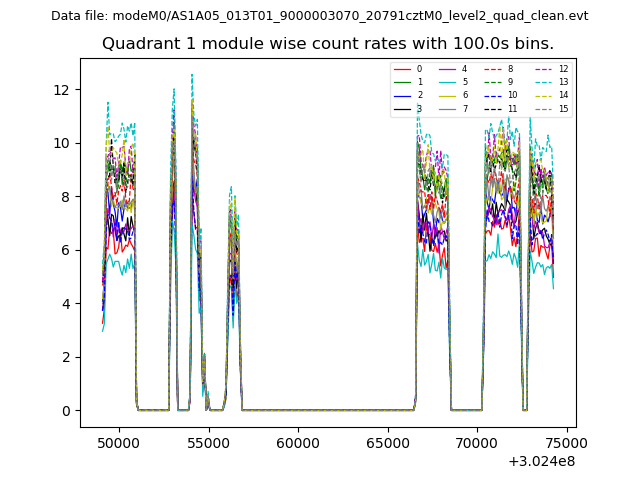 |
 |
| Module-wise count rates for Quadrant C Data is divided into 100 sec bins |
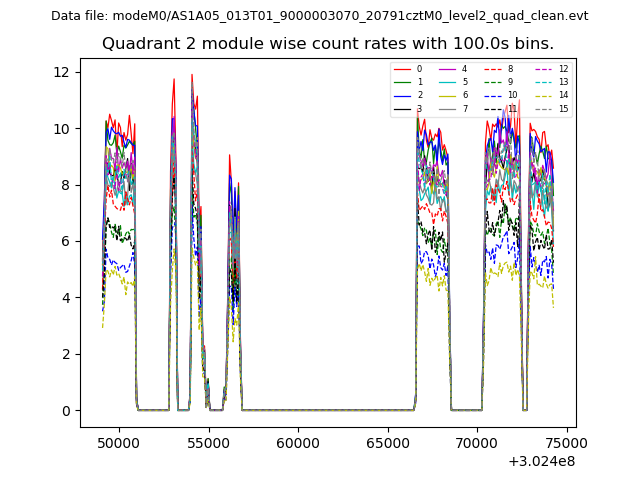 |
 |
| Module-wise count rates for Quadrant D Data is divided into 100 sec bins |
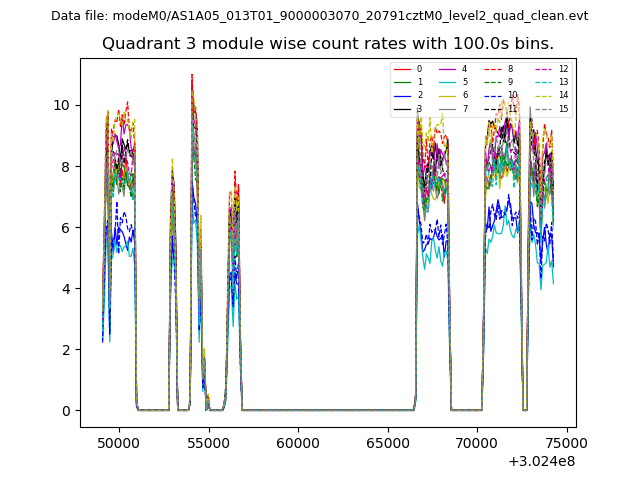 |
 |
| Parameter | Plot |
|---|---|
| CZT HV Monitor | 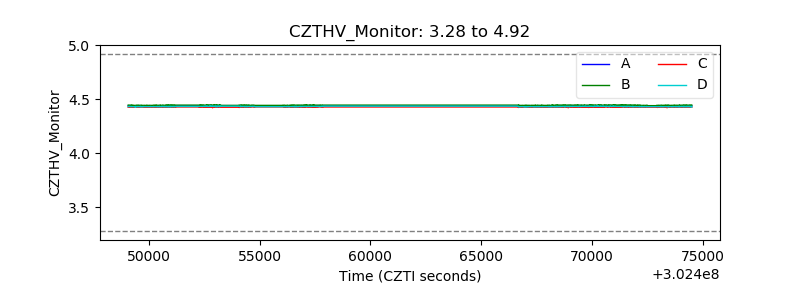 |
| D_VDD | 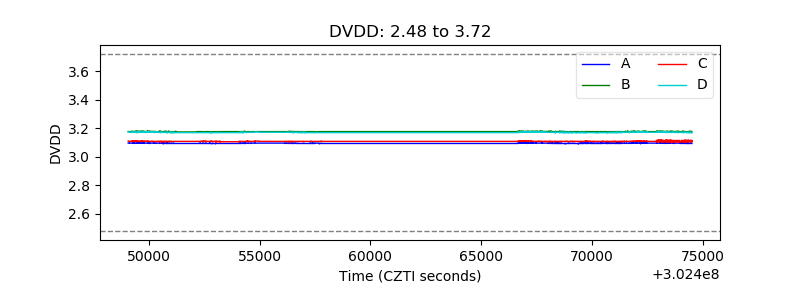 |
| Temperature 1 | 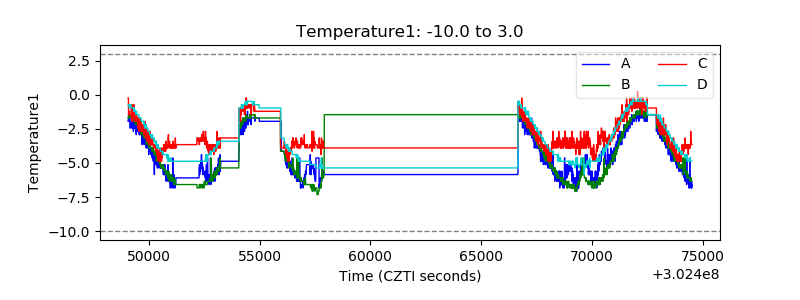 |
| Veto HV Monitor | 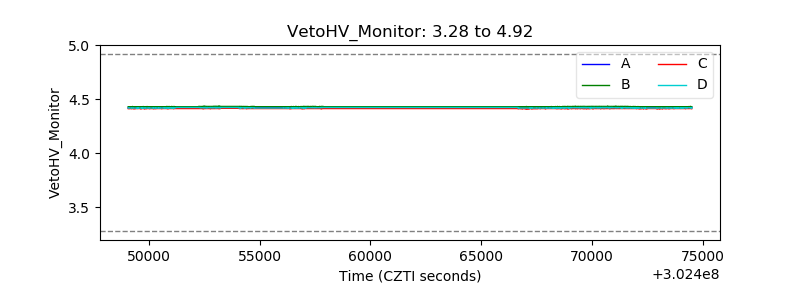 |
| Veto LLD | 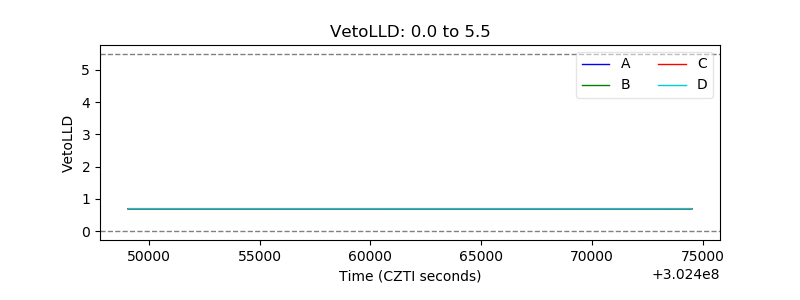 |
| Alpha Counter | 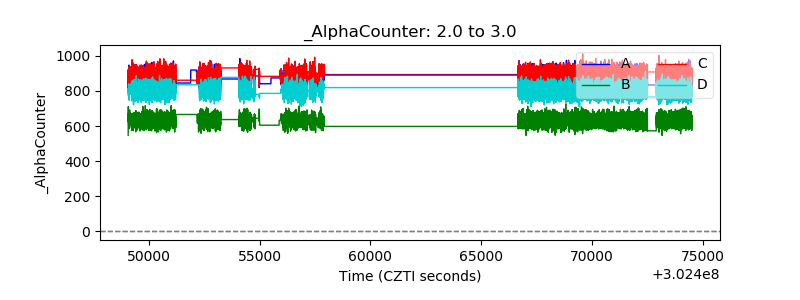 |
| _CPM_Rate | 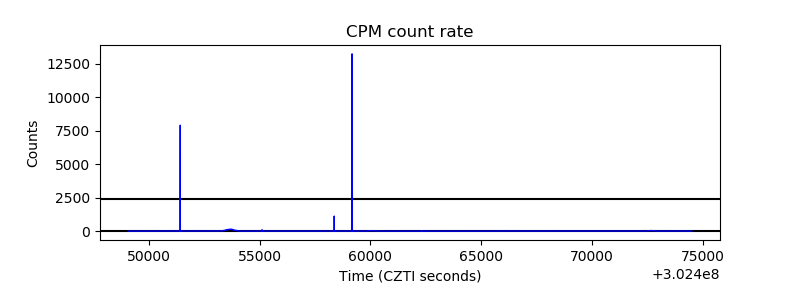 |
| CZT Counter | 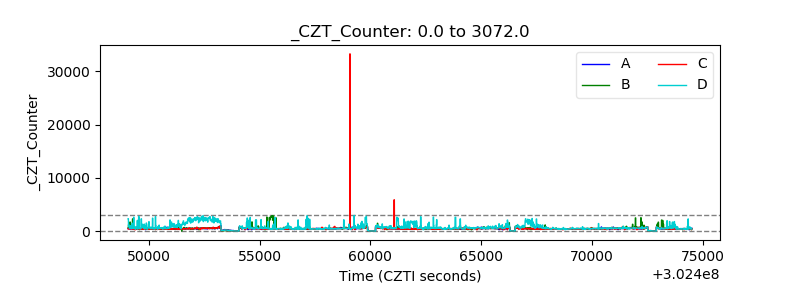 |
| +2.5 Volts monitor |  |
| +5 Volts monitor |  |
| _ROLL_ROT | 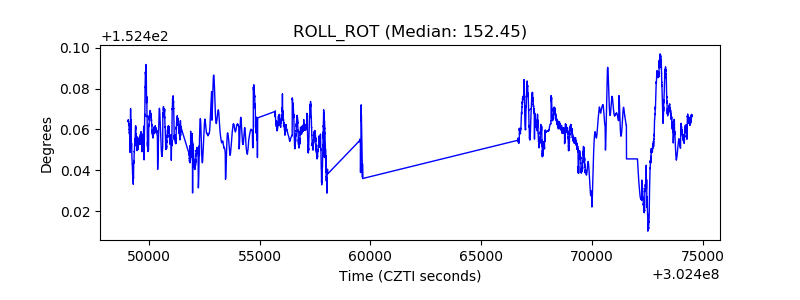 |
| _Roll_DEC | 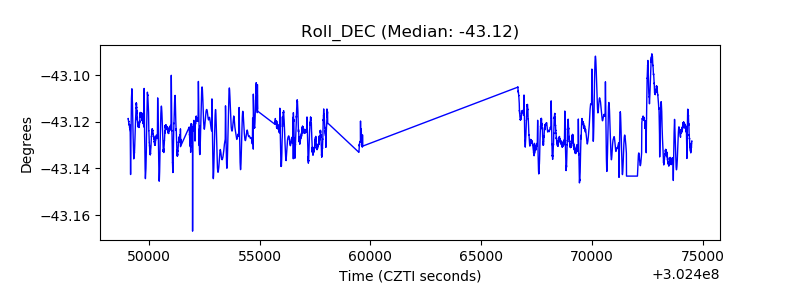 |
| _Roll_RA |  |
| Veto Counter | 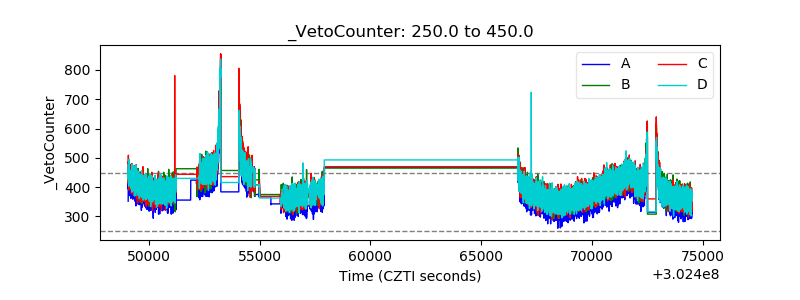 |