| Param | Original file | Final file |
|---|---|---|
| Filename | modeM0/AS1A05_013T01_9000003070_20793cztM0_level2.evt | modeM0/AS1A05_013T01_9000003070_20793cztM0_level2_quad_clean.evt |
| Size (bytes) | 898,110,720 | 163,941,120 |
| Size | 856.5 MB | 156.3 MB |
| Events in quadrant A | 5,898,390 | 1,047,017 |
| Events in quadrant B | 6,508,723 | 1,032,308 |
| Events in quadrant C | 5,950,767 | 1,003,907 |
| Events in quadrant D | 7,966,655 | 988,644 |
| Mode SS | |||
|---|---|---|---|
| Quadrant | BADHDUFLAG | Total packets | Discarded packets |
| A | 0 | 262 | 0 |
| B | 0 | 262 | 0 |
| C | 0 | 262 | 0 |
| D | 0 | 262 | 0 |
| Mode M0 | |||
|---|---|---|---|
| Quadrant | BADHDUFLAG | Total packets | Discarded packets |
| A | 0 | 26203 | 3 |
| B | 0 | 27818 | 3 |
| C | 0 | 26223 | 3 |
| D | 0 | 32067 | 3 |
| Mode M9 | |||
|---|---|---|---|
| Quadrant | BADHDUFLAG | Total packets | Discarded packets |
| A | 0 | 13 | 0 |
| B | 0 | 14 | 0 |
| C | 0 | 14 | 0 |
| D | 0 | 14 | 0 |
| Quadrant | Total seconds | Saturated seconds | Saturation percentage |
|---|---|---|---|
| A | 12927 | 36 | 0.278487% |
| B | 12927 | 134 | 1.036590% |
| C | 12927 | 86 | 0.665274% |
| D | 12927 | 249 | 1.926201% |
Noise dominated data is calculated using 1-second bins in cleaned event files. If a bin has >2000 counts, and if more than 50% of those come from <1% of pixels, then it is considered to be noise-dominated and hence unusable.
| Quadrant | # 1 sec bins | Bins with >0 counts | Bins with >2000 counts | High rate bins dominated by noise | Noise dominated (total time) | Noise dominated (detector-on time) | Marked lightcurve |
|---|---|---|---|---|---|---|---|
| A | 14217 | 12928 | 0 | 0 | 0.00% | 0.00% | 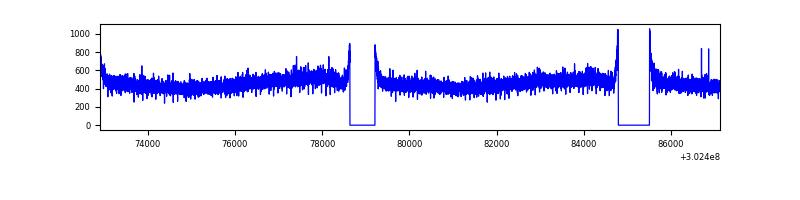 |
| B | 14217 | 12927 | 51 | 51 | 0.36% | 0.39% | 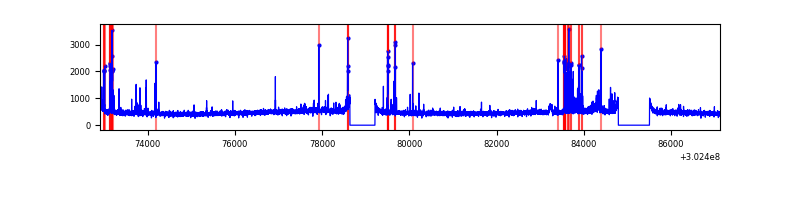 |
| C | 14217 | 12928 | 0 | 0 | 0.00% | 0.00% | 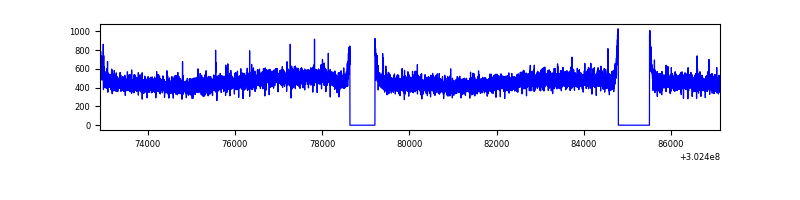 |
| D | 14217 | 12928 | 207 | 207 | 1.46% | 1.60% | 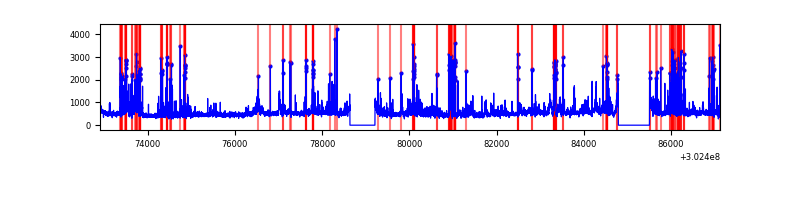 |
Top three noisy pixels from each quadrant. If the there are fewer than three noisy pixels in the level2.evt file, extra rows are filled as -1
| Pixel properties | Quadrant properties | ||||||
|---|---|---|---|---|---|---|---|
| Quadrant | DetID | PixID | Counts | Sigma | Mean | Median | Sigma |
| A | 0 | 226 | 13197 | 38.09 | 1533 | 1502 | 307.1 |
| A | 3 | 137 | 12602 | 36.15 | 1533 | 1502 | 307.1 |
| A | 12 | 194 | 11052 | 31.1 | 1533 | 1502 | 307.1 |
| B | 7 | 220 | 186332 | 648.98 | 1514 | 1475 | 284.8 |
| B | 0 | 189 | 86649 | 299.02 | 1514 | 1475 | 284.8 |
| B | 0 | 197 | 82721 | 285.23 | 1514 | 1475 | 284.8 |
| C | 14 | 238 | 229479 | 671.98 | 1457 | 1466 | 339.3 |
| C | 8 | 128 | 12416 | 32.27 | 1457 | 1466 | 339.3 |
| C | 13 | 61 | 10475 | 26.55 | 1457 | 1466 | 339.3 |
| D | 1 | 52 | 924908 | 2566.57 | 1471 | 1427 | 359.8 |
| D | 1 | 20 | 504522 | 1398.22 | 1471 | 1427 | 359.8 |
| D | 5 | 222 | 331007 | 915.98 | 1471 | 1427 | 359.8 |
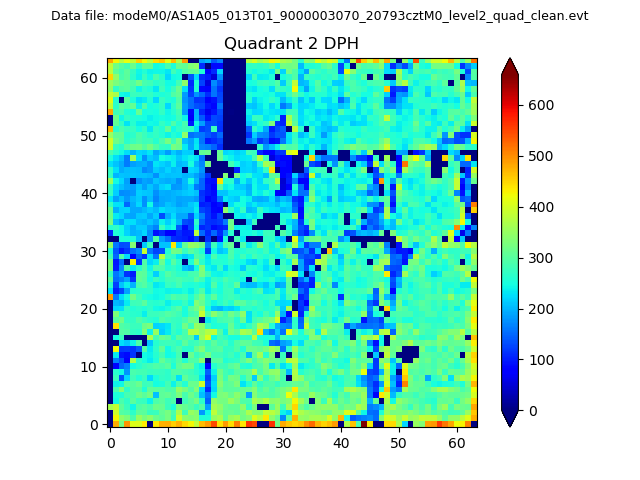
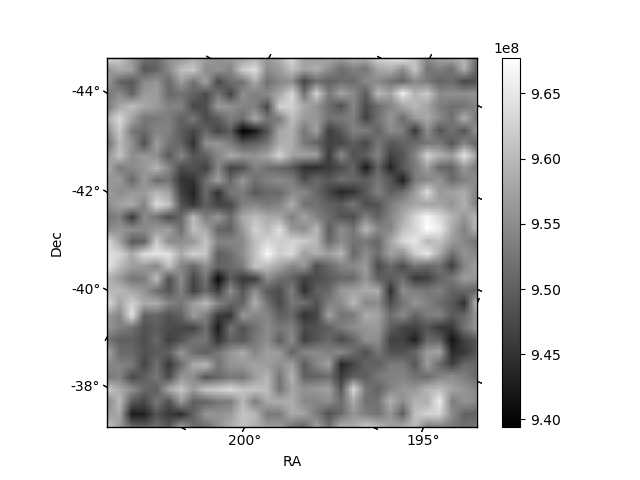
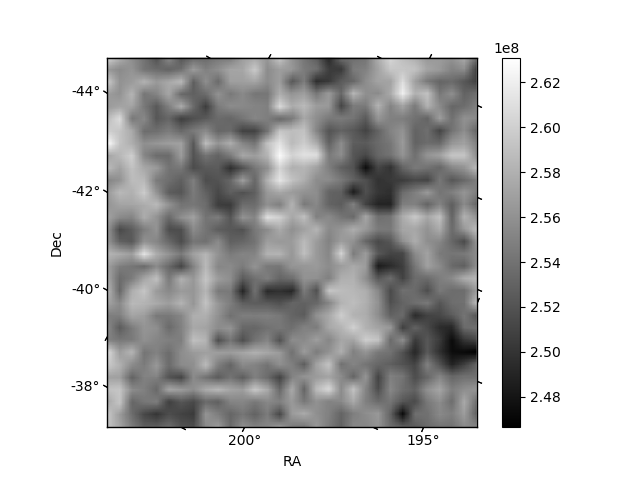
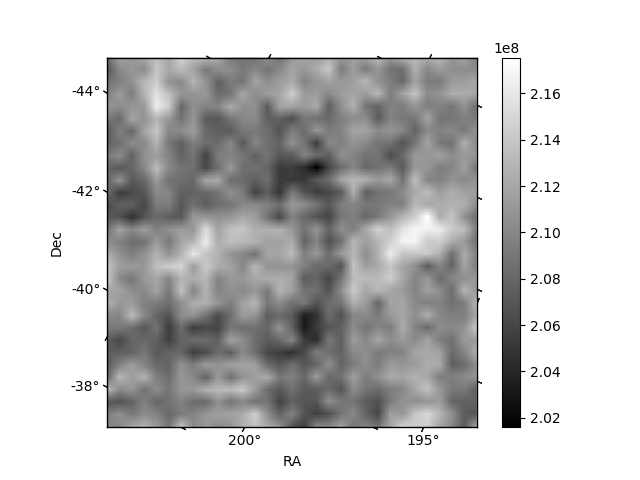
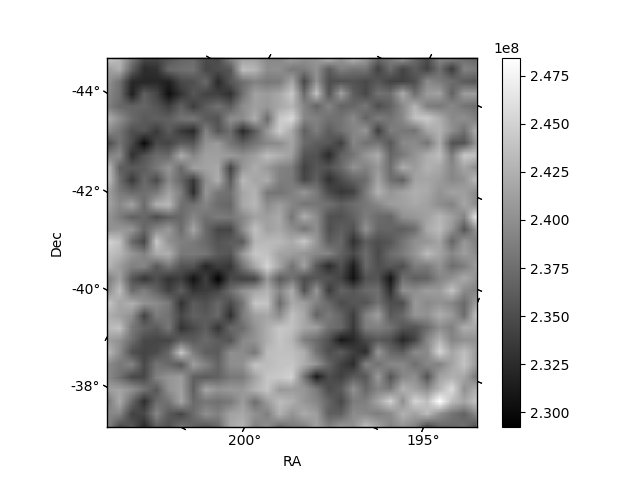
Histogram calculated using DETX and DETY for each event in the final _common_clean file
| Quadrant A | 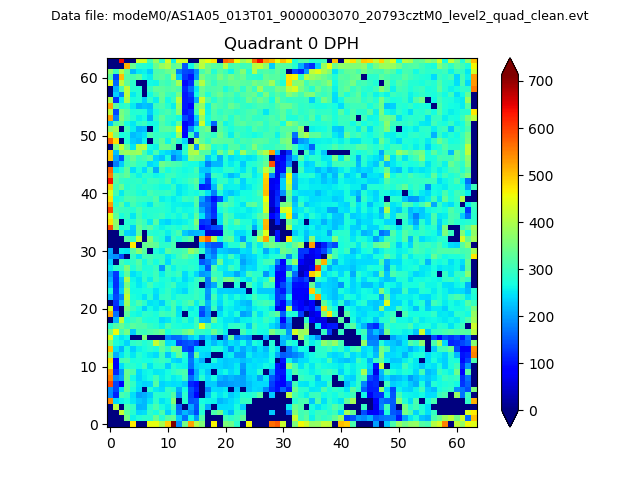 |
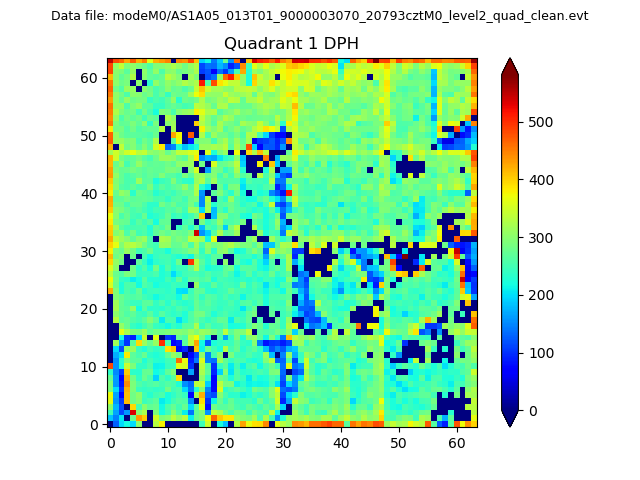 |
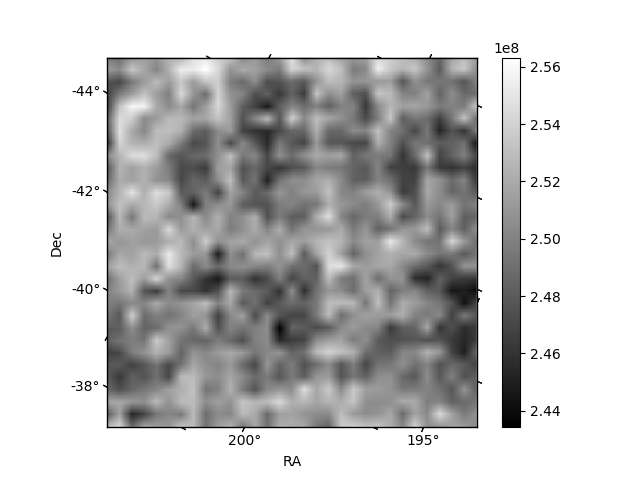
Quadrant B |
|---|---|---|---|
| Quadrant D | 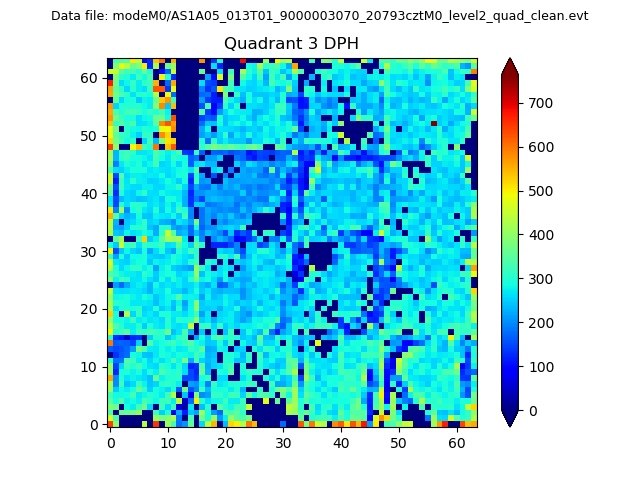 |
 |
Quadrant C |
| Plot type | Count rate plots | Images |
|---|---|---|
| Comparison with Poisson distribution Blue bars denote a histogram of data divided into 1 sec bins. Red curve is a Poisson curve with rate = median count rate of data. |
 |
 |
| Quadrant-wise count rates Data is divided into 100 sec bins |
 |
|
| Module-wise count rates for Quadrant A Data is divided into 100 sec bins |
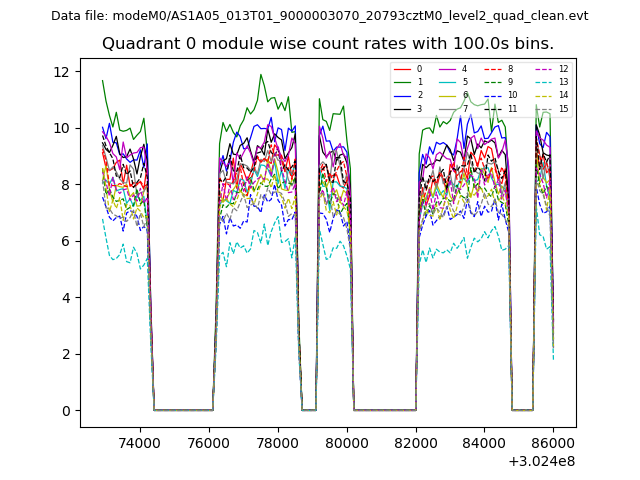 |
 |
| Module-wise count rates for Quadrant B Data is divided into 100 sec bins |
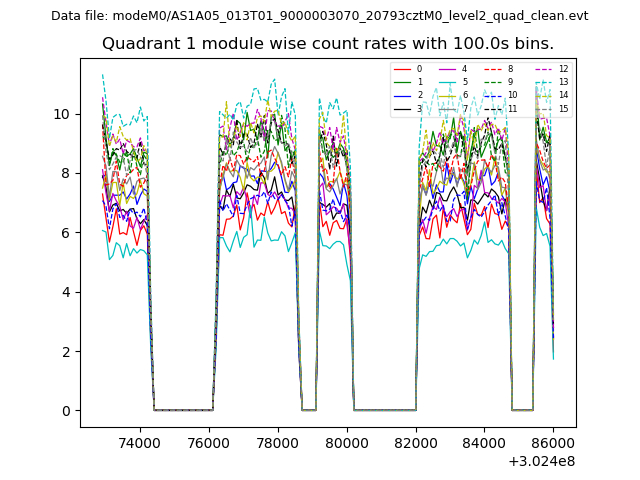 |
 |
| Module-wise count rates for Quadrant C Data is divided into 100 sec bins |
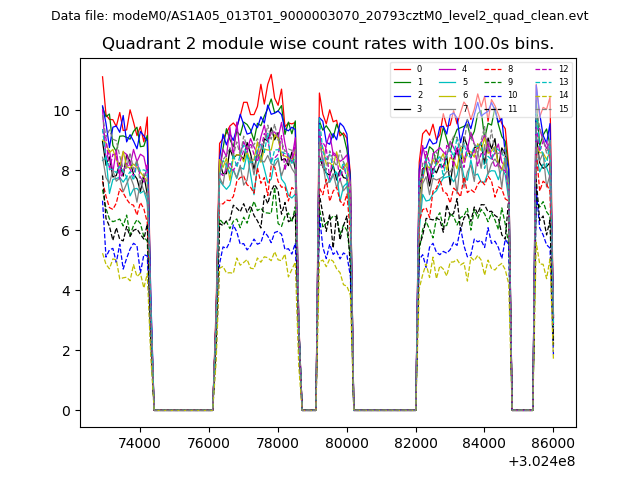 |
 |
| Module-wise count rates for Quadrant D Data is divided into 100 sec bins |
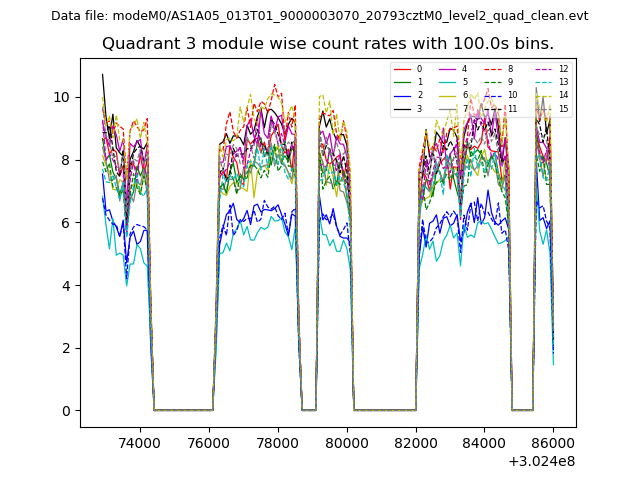 |
 |
| Parameter | Plot |
|---|---|
| CZT HV Monitor | 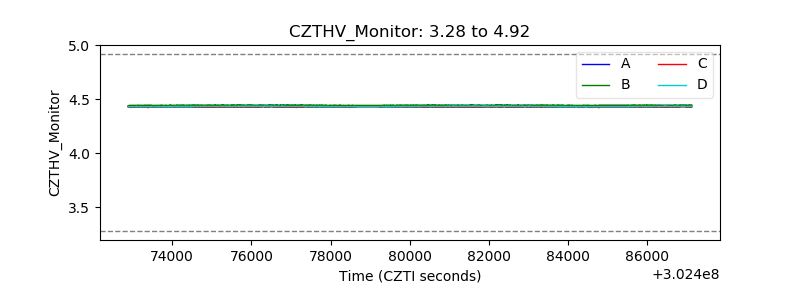 |
| D_VDD | 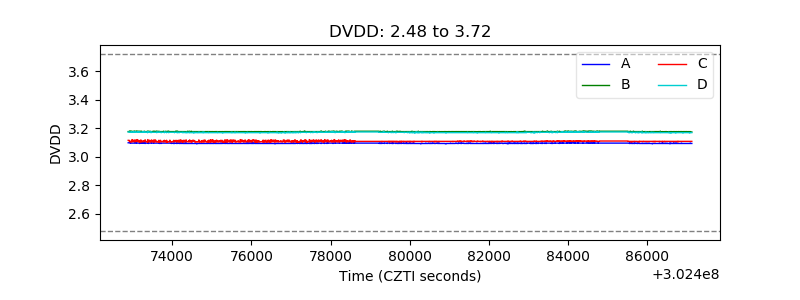 |
| Temperature 1 | 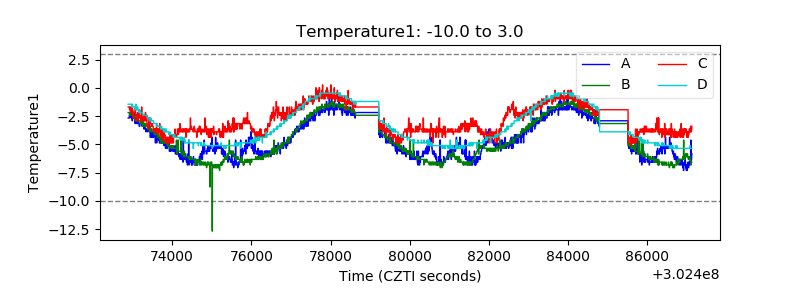 |
| Veto HV Monitor | 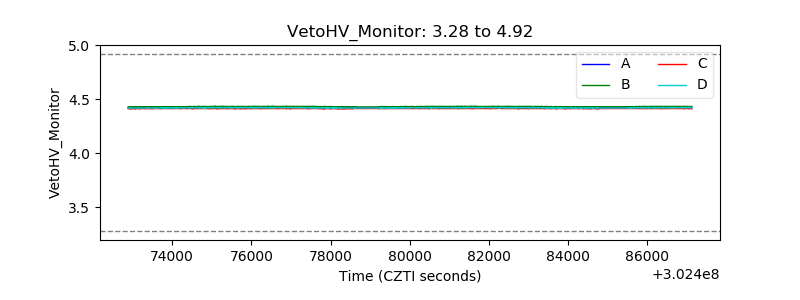 |
| Veto LLD | 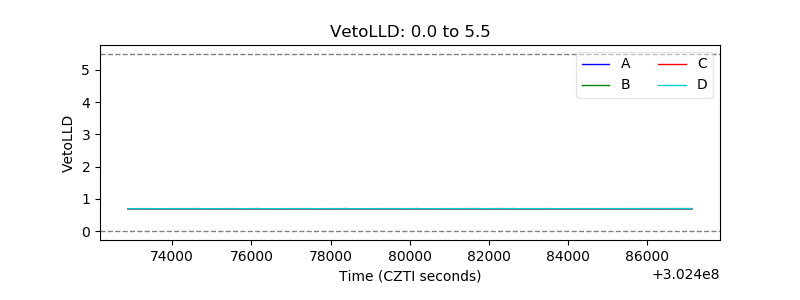 |
| Alpha Counter | 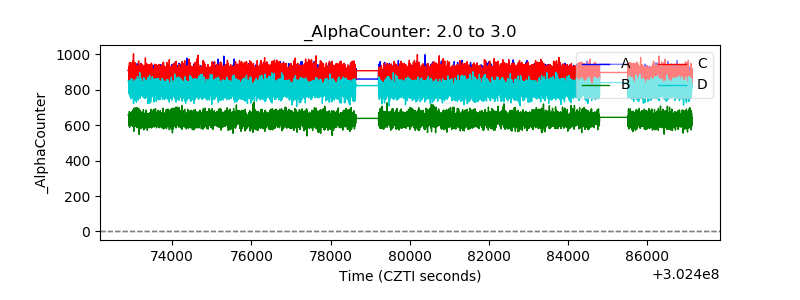 |
| _CPM_Rate |  |
| CZT Counter | 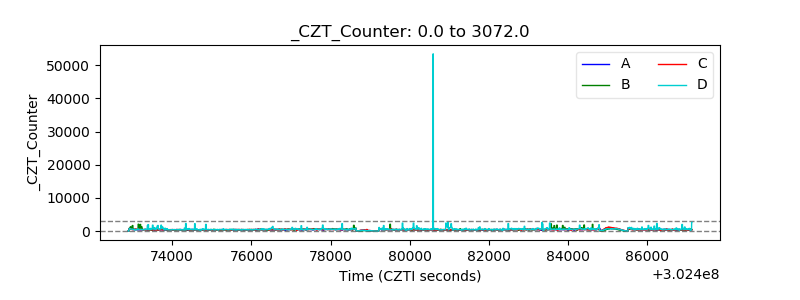 |
| +2.5 Volts monitor |  |
| +5 Volts monitor |  |
| _ROLL_ROT | 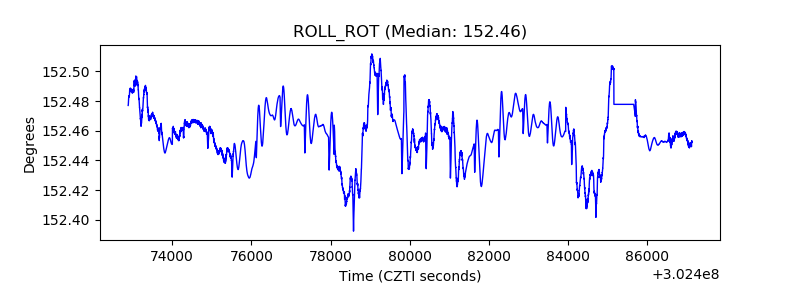 |
| _Roll_DEC | 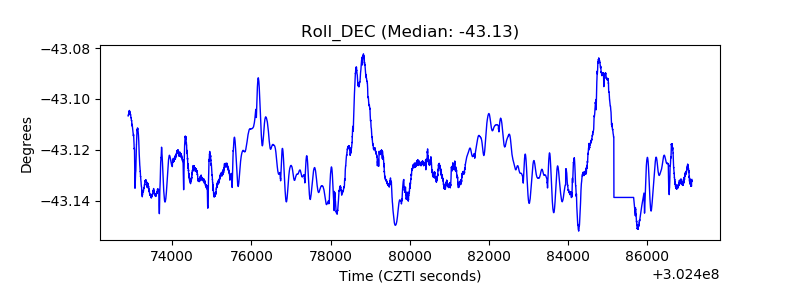 |
| _Roll_RA | 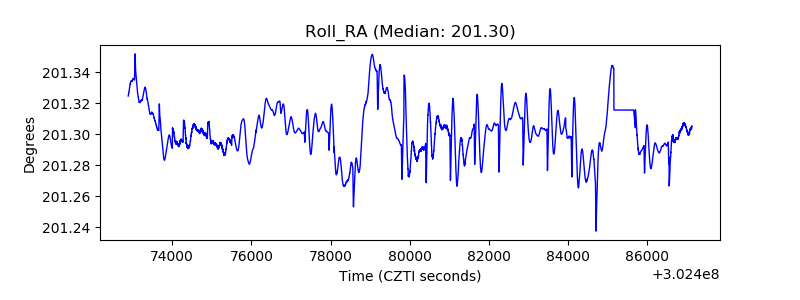 |
| Veto Counter | 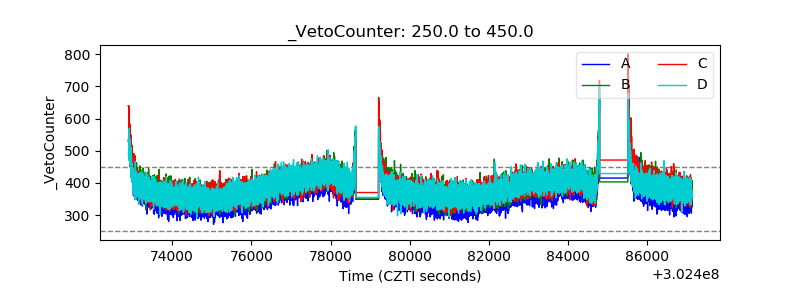 |