| Param | Original file | Final file |
|---|---|---|
| Filename | modeM0/AS1A05_013T01_9000003070_20795cztM0_level2.evt | modeM0/AS1A05_013T01_9000003070_20795cztM0_level2_quad_clean.evt |
| Size (bytes) | 2,491,519,680 | 437,768,640 |
| Size | 2.3 GB | 417.5 MB |
| Events in quadrant A | 15,930,678 | 2,802,727 |
| Events in quadrant B | 17,652,584 | 2,767,735 |
| Events in quadrant C | 16,119,569 | 2,698,114 |
| Events in quadrant D | 23,425,820 | 2,620,985 |
| Mode SS | |||
|---|---|---|---|
| Quadrant | BADHDUFLAG | Total packets | Discarded packets |
| A | 0 | 700 | 0 |
| B | 0 | 700 | 0 |
| C | 0 | 700 | 0 |
| D | 0 | 700 | 0 |
| Mode M0 | |||
|---|---|---|---|
| Quadrant | BADHDUFLAG | Total packets | Discarded packets |
| A | 0 | 70137 | 6 |
| B | 0 | 74926 | 6 |
| C | 0 | 70377 | 6 |
| D | 0 | 92325 | 7 |
| Mode M9 | |||
|---|---|---|---|
| Quadrant | BADHDUFLAG | Total packets | Discarded packets |
| A | 0 | 40 | 0 |
| B | 0 | 40 | 0 |
| C | 0 | 40 | 0 |
| D | 0 | 40 | 0 |
| Quadrant | Total seconds | Saturated seconds | Saturation percentage |
|---|---|---|---|
| A | 34503 | 136 | 0.394169% |
| B | 34503 | 409 | 1.185404% |
| C | 34503 | 267 | 0.773846% |
| D | 34503 | 895 | 2.593977% |
Noise dominated data is calculated using 1-second bins in cleaned event files. If a bin has >2000 counts, and if more than 50% of those come from <1% of pixels, then it is considered to be noise-dominated and hence unusable.
| Quadrant | # 1 sec bins | Bins with >0 counts | Bins with >2000 counts | High rate bins dominated by noise | Noise dominated (total time) | Noise dominated (detector-on time) | Marked lightcurve |
|---|---|---|---|---|---|---|---|
| A | 38398 | 34505 | 0 | 0 | 0.00% | 0.00% | 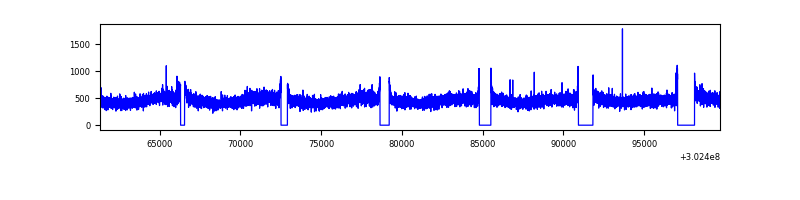 |
| B | 38398 | 34504 | 133 | 133 | 0.35% | 0.39% | 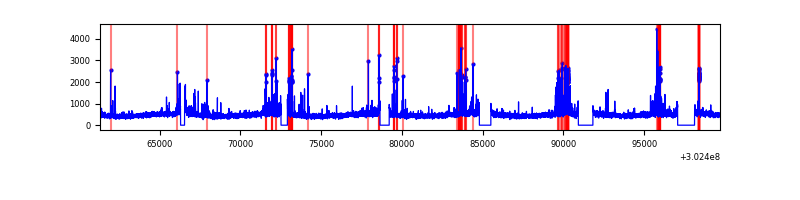 |
| C | 38398 | 34506 | 0 | 0 | 0.00% | 0.00% | 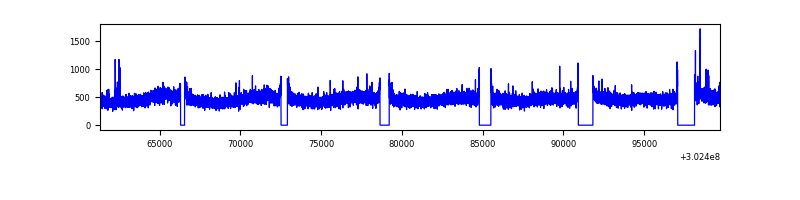 |
| D | 38398 | 34506 | 788 | 788 | 2.05% | 2.28% | 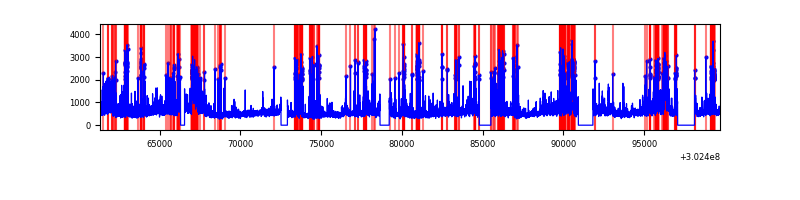 |
Top three noisy pixels from each quadrant. If the there are fewer than three noisy pixels in the level2.evt file, extra rows are filled as -1
| Pixel properties | Quadrant properties | ||||||
|---|---|---|---|---|---|---|---|
| Quadrant | DetID | PixID | Counts | Sigma | Mean | Median | Sigma |
| A | 0 | 226 | 35805 | 38.42 | 4142 | 4061 | 826.3 |
| A | 3 | 137 | 33870 | 36.08 | 4142 | 4061 | 826.3 |
| A | 12 | 194 | 29552 | 30.85 | 4142 | 4061 | 826.3 |
| B | 7 | 220 | 693770 | 899.79 | 4093 | 3997 | 766.6 |
| B | 0 | 189 | 205112 | 262.35 | 4093 | 3997 | 766.6 |
| B | 0 | 197 | 177135 | 225.85 | 4093 | 3997 | 766.6 |
| C | 14 | 238 | 622288 | 676.45 | 3944 | 3969 | 914.1 |
| C | 7 | 247 | 86825 | 90.65 | 3944 | 3969 | 914.1 |
| C | 13 | 61 | 28018 | 26.31 | 3944 | 3969 | 914.1 |
| D | 12 | 227 | 2438990 | 2545.69 | 3977 | 3866 | 956.6 |
| D | 1 | 20 | 1788657 | 1865.83 | 3977 | 3866 | 956.6 |
| D | 1 | 52 | 1629468 | 1699.41 | 3977 | 3866 | 956.6 |
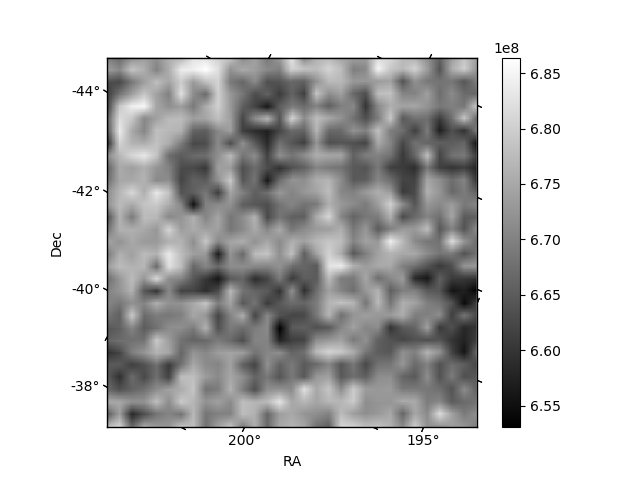
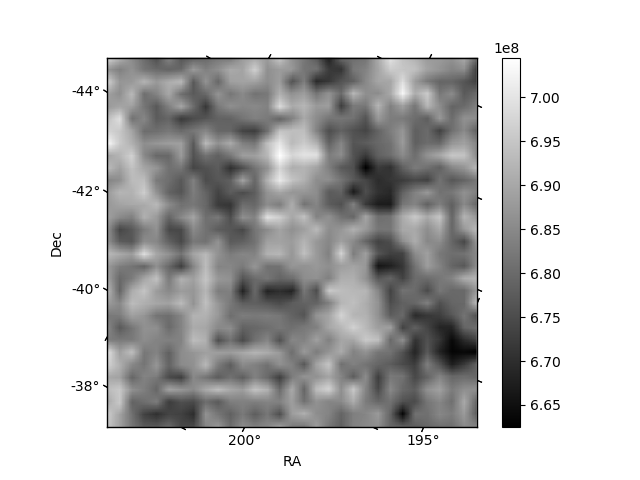
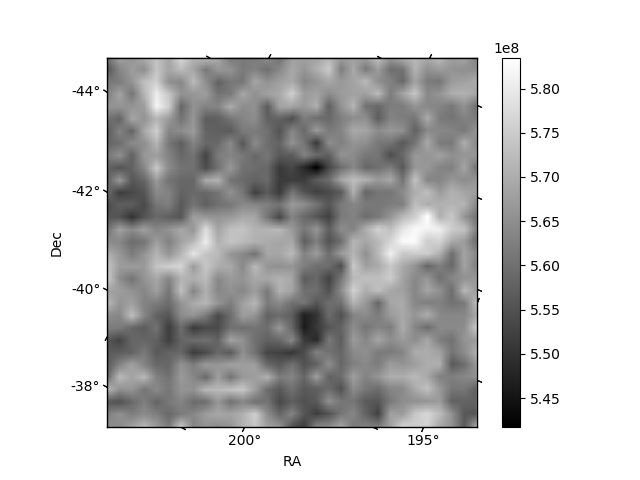
Histogram calculated using DETX and DETY for each event in the final _common_clean file
| Quadrant A |  |
 |
Quadrant B |
|---|---|---|---|
| Quadrant D | 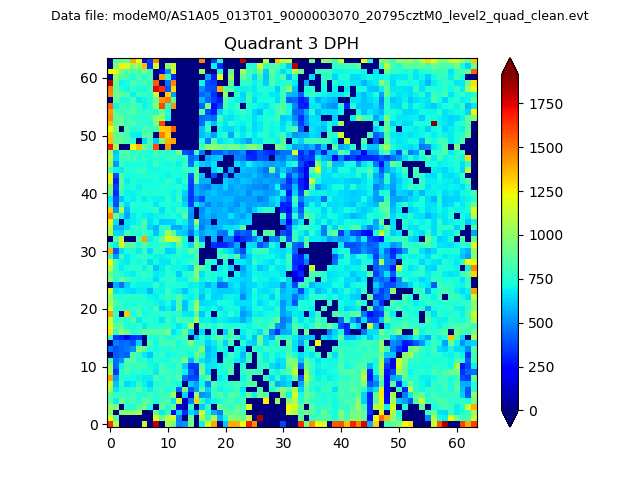 |
 |
Quadrant C |
| Plot type | Count rate plots | Images |
|---|---|---|
| Comparison with Poisson distribution Blue bars denote a histogram of data divided into 1 sec bins. Red curve is a Poisson curve with rate = median count rate of data. |
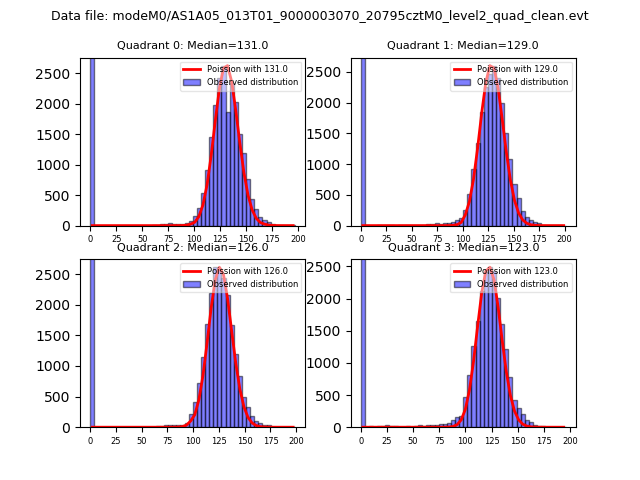 |
 |
| Quadrant-wise count rates Data is divided into 100 sec bins |
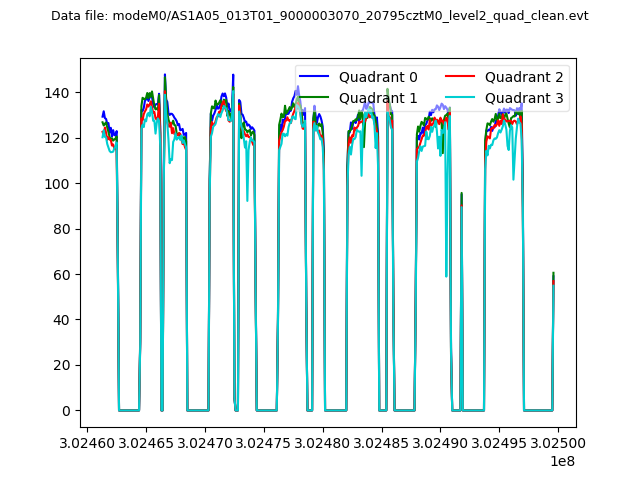 |
|
| Module-wise count rates for Quadrant A Data is divided into 100 sec bins |
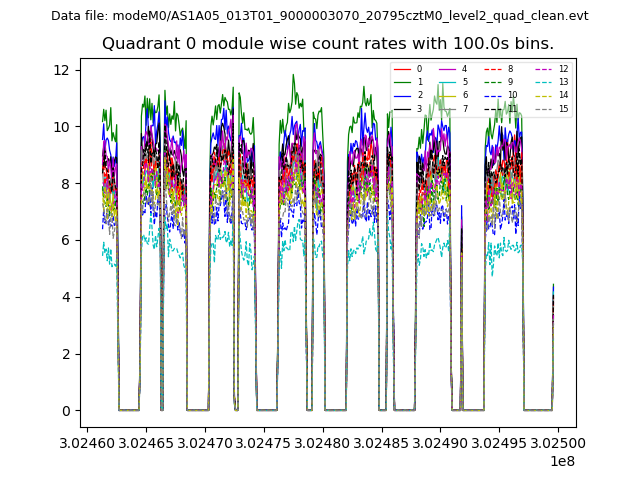 |
 |
| Module-wise count rates for Quadrant B Data is divided into 100 sec bins |
 |
 |
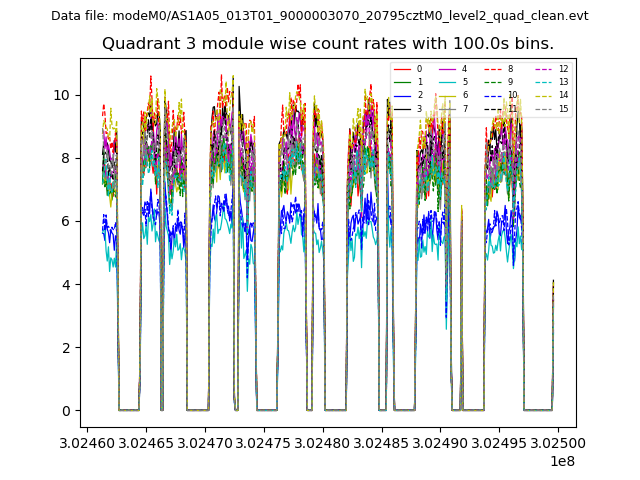
| Module-wise count rates for Quadrant C Data is divided into 100 sec bins |
 |
 |
| Module-wise count rates for Quadrant D Data is divided into 100 sec bins |
 |
 |
| Parameter | Plot |
|---|---|
| CZT HV Monitor |  |
| D_VDD | 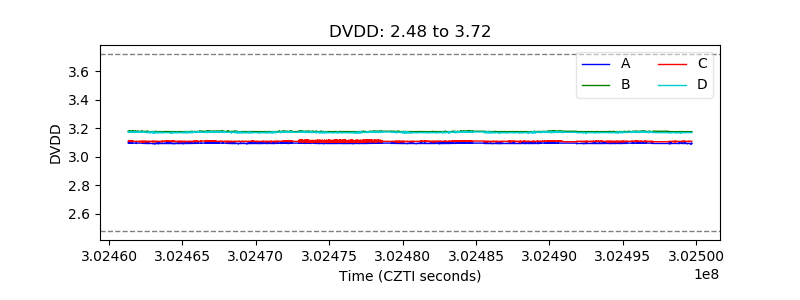 |
| Temperature 1 | 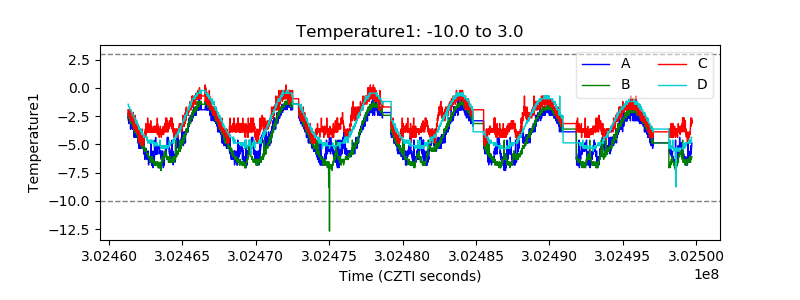 |
| Veto HV Monitor | 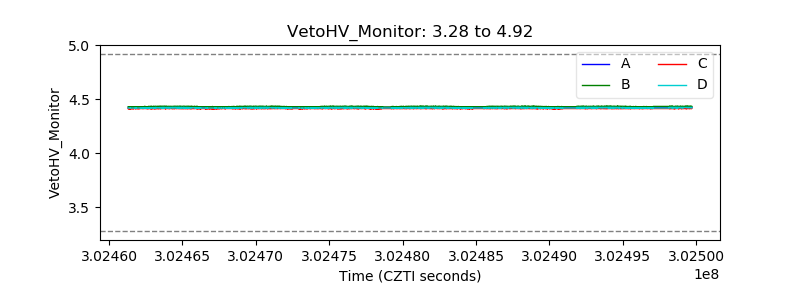 |
| Veto LLD | 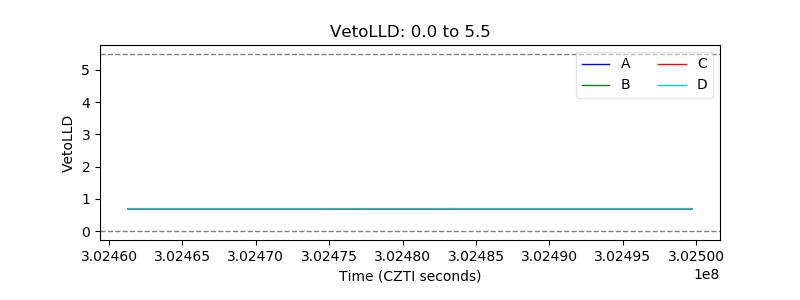 |
| Alpha Counter | 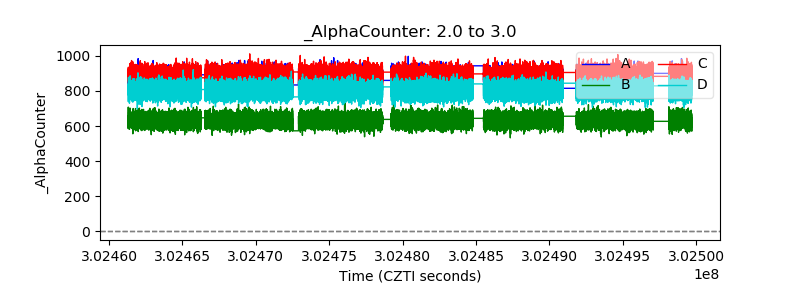 |
| _CPM_Rate | 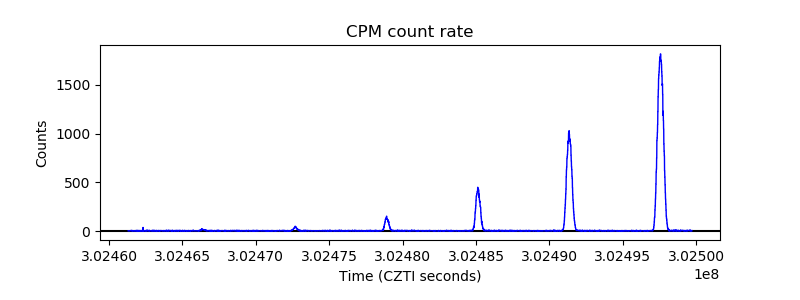 |
| CZT Counter | 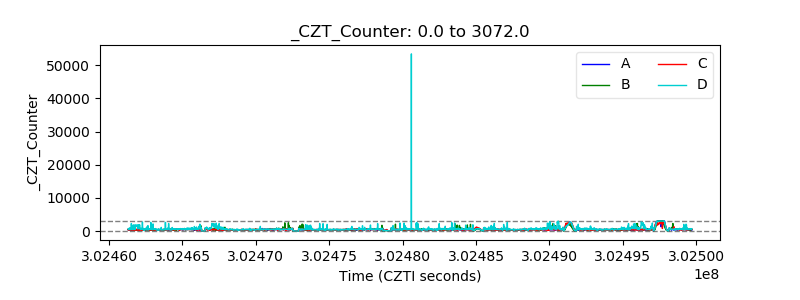 |
| +2.5 Volts monitor |  |
| +5 Volts monitor | 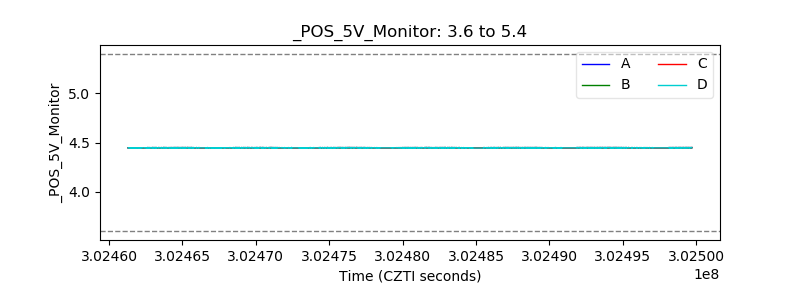 |
| _ROLL_ROT | 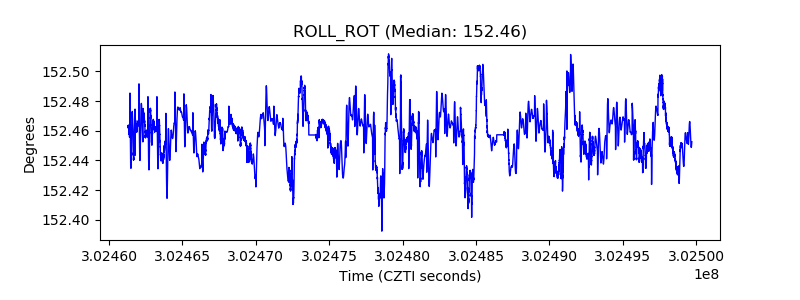 |
| _Roll_DEC | 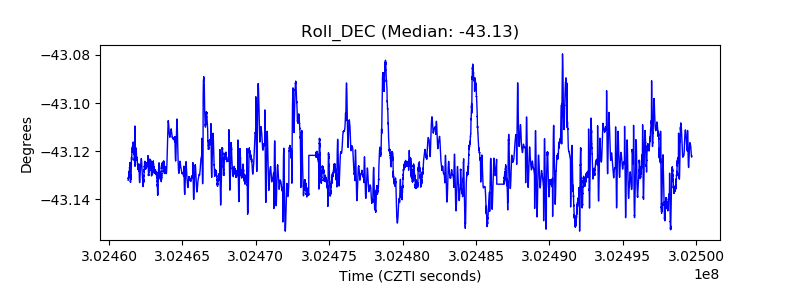 |
| _Roll_RA | 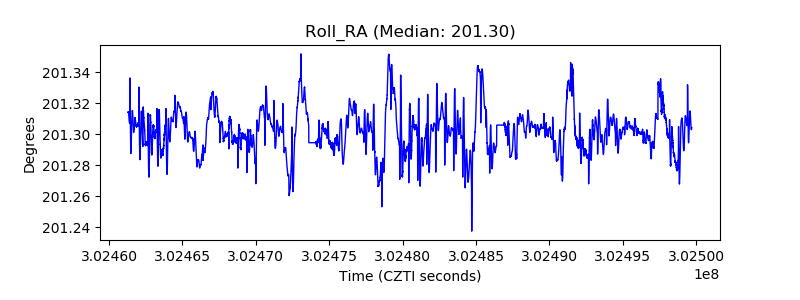 |
| Veto Counter | 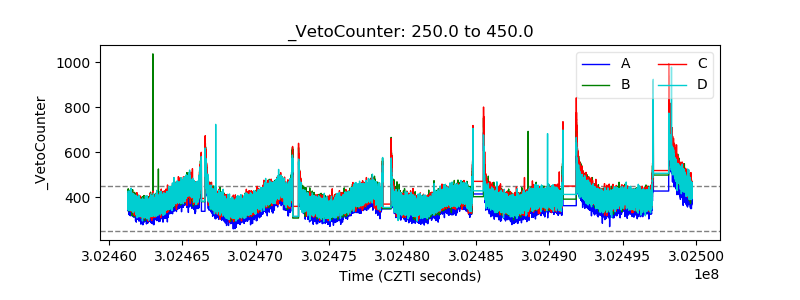 |