| Param | Original file | Final file |
|---|---|---|
| Filename | modeM0/AS1A05_013T01_9000003070_20797cztM0_level2.evt | modeM0/AS1A05_013T01_9000003070_20797cztM0_level2_quad_clean.evt |
| Size (bytes) | 561,093,120 | 82,010,880 |
| Size | 535.1 MB | 78.2 MB |
| Events in quadrant A | 3,277,082 | 528,825 |
| Events in quadrant B | 3,666,713 | 522,325 |
| Events in quadrant C | 3,386,230 | 512,176 |
| Events in quadrant D | 6,221,348 | 465,564 |
| Mode SS | |||
|---|---|---|---|
| Quadrant | BADHDUFLAG | Total packets | Discarded packets |
| A | 0 | 134 | 0 |
| B | 0 | 134 | 0 |
| C | 0 | 134 | 0 |
| D | 0 | 134 | 0 |
| Mode M0 | |||
|---|---|---|---|
| Quadrant | BADHDUFLAG | Total packets | Discarded packets |
| A | 0 | 13739 | 2 |
| B | 0 | 14937 | 3 |
| C | 0 | 14147 | 2 |
| D | 0 | 23020 | 2 |
| Mode M9 | |||
|---|---|---|---|
| Quadrant | BADHDUFLAG | Total packets | Discarded packets |
| A | 0 | 18 | 0 |
| B | 0 | 19 | 0 |
| C | 0 | 19 | 0 |
| D | 0 | 19 | 0 |
| Quadrant | Total seconds | Saturated seconds | Saturation percentage |
|---|---|---|---|
| A | 6510 | 38 | 0.583717% |
| B | 6509 | 139 | 2.135505% |
| C | 6509 | 105 | 1.613151% |
| D | 6509 | 627 | 9.632816% |
Noise dominated data is calculated using 1-second bins in cleaned event files. If a bin has >2000 counts, and if more than 50% of those come from <1% of pixels, then it is considered to be noise-dominated and hence unusable.
| Quadrant | # 1 sec bins | Bins with >0 counts | Bins with >2000 counts | High rate bins dominated by noise | Noise dominated (total time) | Noise dominated (detector-on time) | Marked lightcurve |
|---|---|---|---|---|---|---|---|
| A | 7680 | 6510 | 0 | 0 | 0.00% | 0.00% | 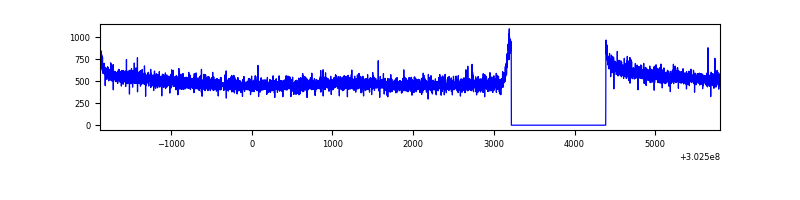 |
| B | 7679 | 6509 | 57 | 57 | 0.74% | 0.88% | 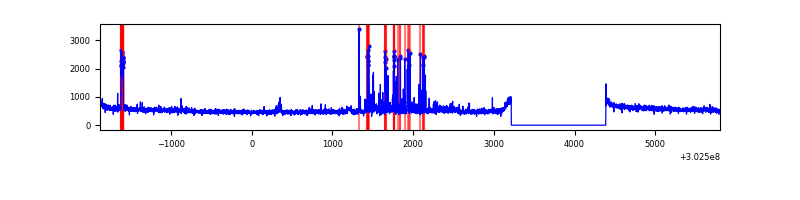 |
| C | 7679 | 6509 | 0 | 0 | 0.00% | 0.00% | 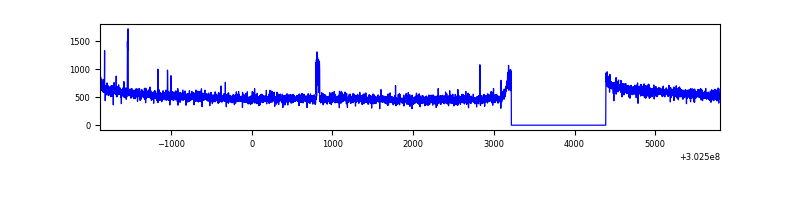 |
| D | 7679 | 6509 | 597 | 597 | 7.77% | 9.17% | 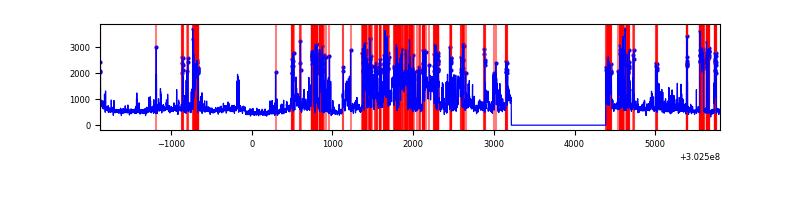 |
Top three noisy pixels from each quadrant. If the there are fewer than three noisy pixels in the level2.evt file, extra rows are filled as -1
| Pixel properties | Quadrant properties | ||||||
|---|---|---|---|---|---|---|---|
| Quadrant | DetID | PixID | Counts | Sigma | Mean | Median | Sigma |
| A | 0 | 226 | 7411 | 39.0 | 853 | 837 | 168.6 |
| A | 3 | 137 | 6360 | 32.76 | 853 | 837 | 168.6 |
| A | 12 | 194 | 6067 | 31.02 | 853 | 837 | 168.6 |
| B | 7 | 220 | 174123 | 1097.23 | 843 | 822 | 157.9 |
| B | 3 | 64 | 66239 | 414.18 | 843 | 822 | 157.9 |
| B | 0 | 182 | 47358 | 294.63 | 843 | 822 | 157.9 |
| C | 14 | 238 | 130666 | 694.91 | 822 | 829 | 186.8 |
| C | 7 | 247 | 49040 | 258.03 | 822 | 829 | 186.8 |
| C | 13 | 61 | 5764 | 26.41 | 822 | 829 | 186.8 |
| D | 1 | 52 | 2115445 | 11078.55 | 798 | 779 | 190.9 |
| D | 12 | 227 | 430078 | 2249.06 | 798 | 779 | 190.9 |
| D | 1 | 20 | 179410 | 935.83 | 798 | 779 | 190.9 |
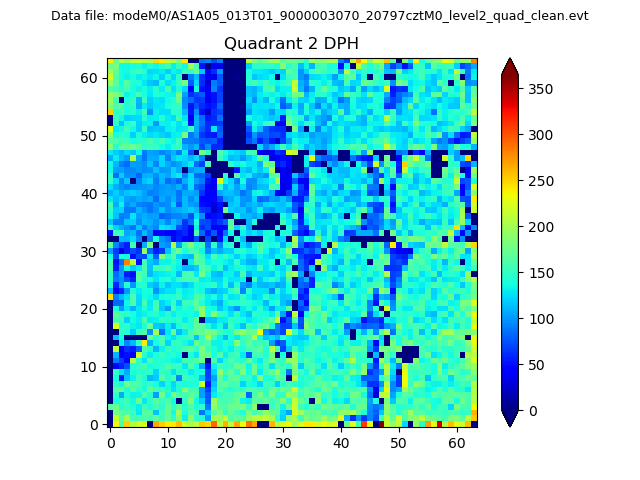
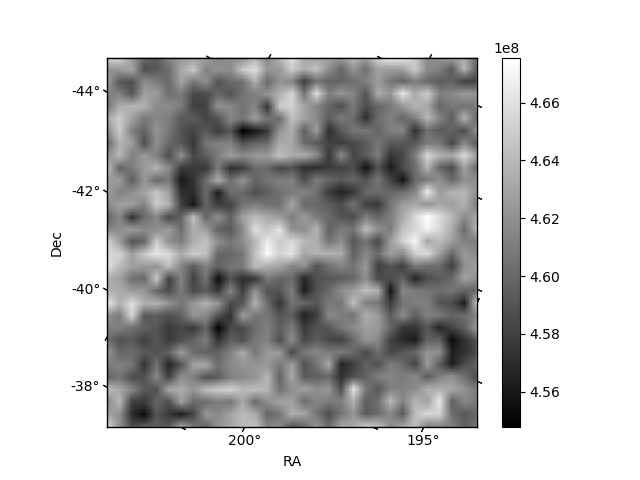
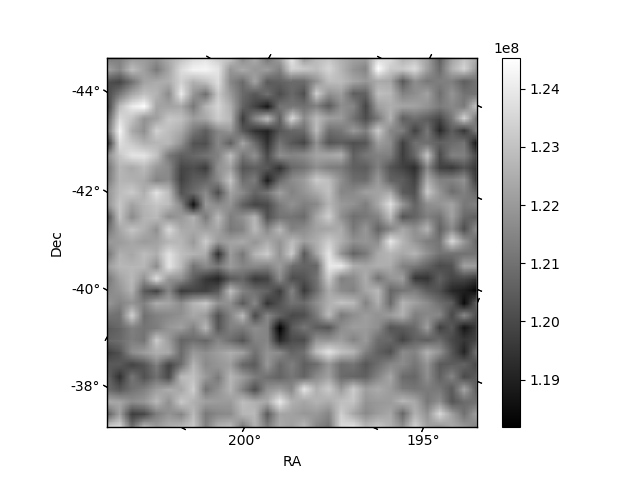
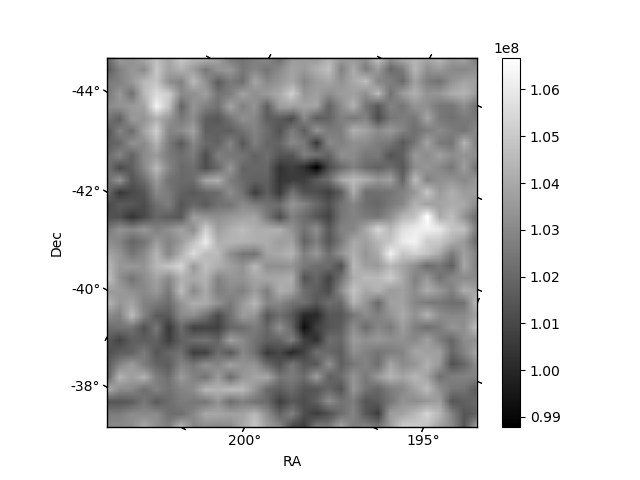
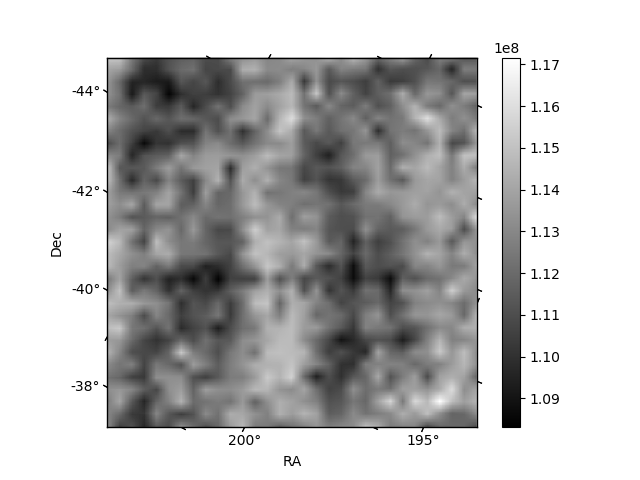
Histogram calculated using DETX and DETY for each event in the final _common_clean file
| Quadrant A | 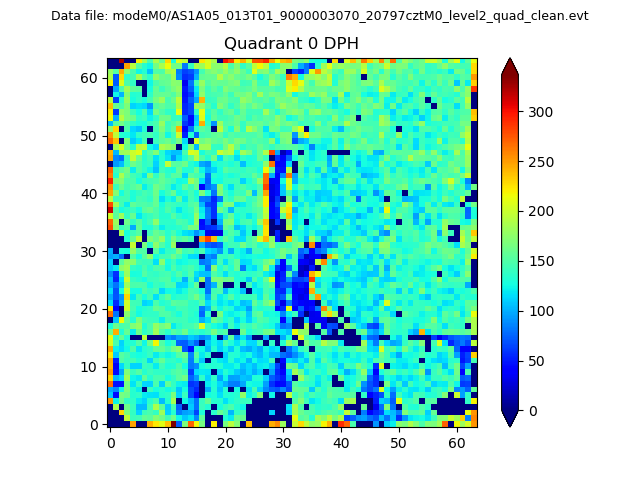 |
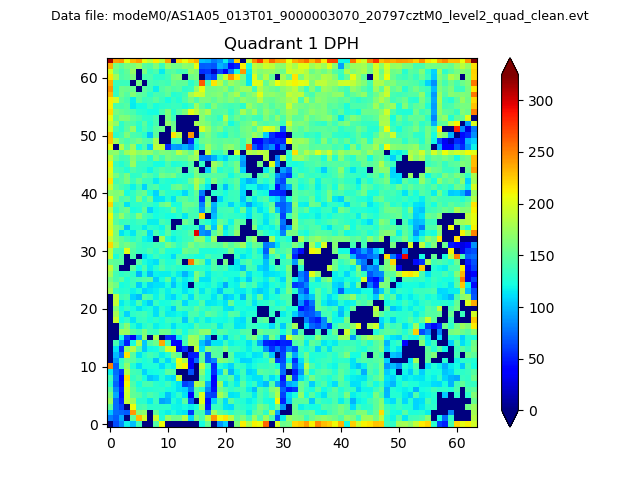 |
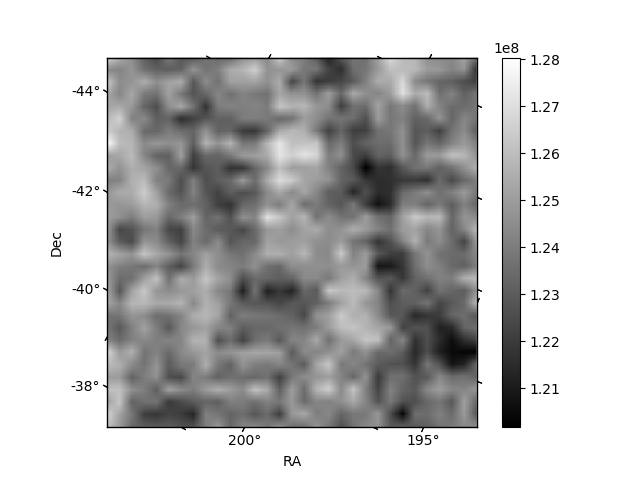
Quadrant B |
|---|---|---|---|
| Quadrant D | 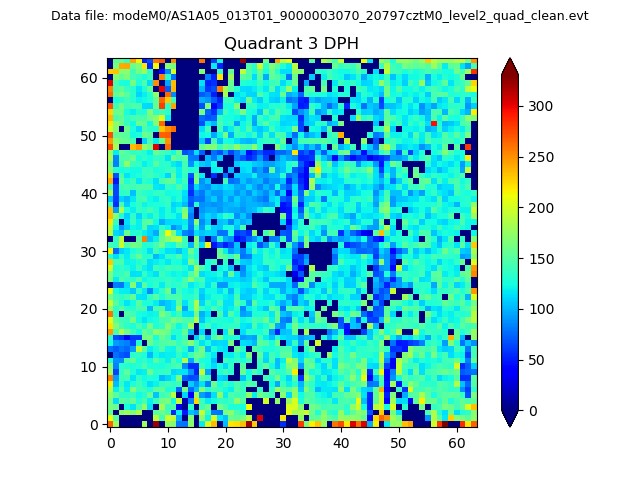 |
 |
Quadrant C |
| Plot type | Count rate plots | Images |
|---|---|---|
| Comparison with Poisson distribution Blue bars denote a histogram of data divided into 1 sec bins. Red curve is a Poisson curve with rate = median count rate of data. |
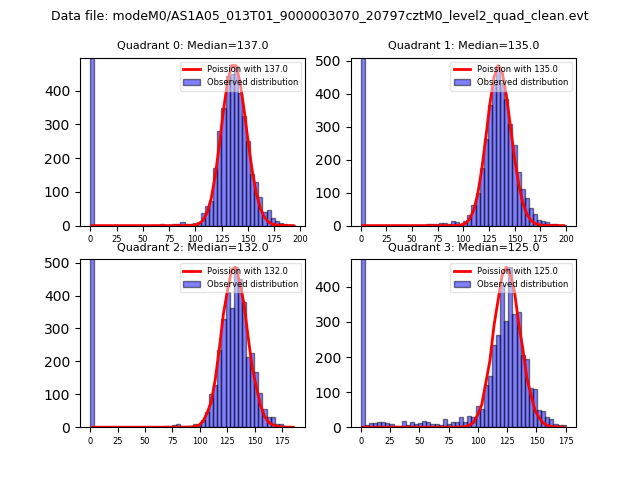 |
 |
| Quadrant-wise count rates Data is divided into 100 sec bins |
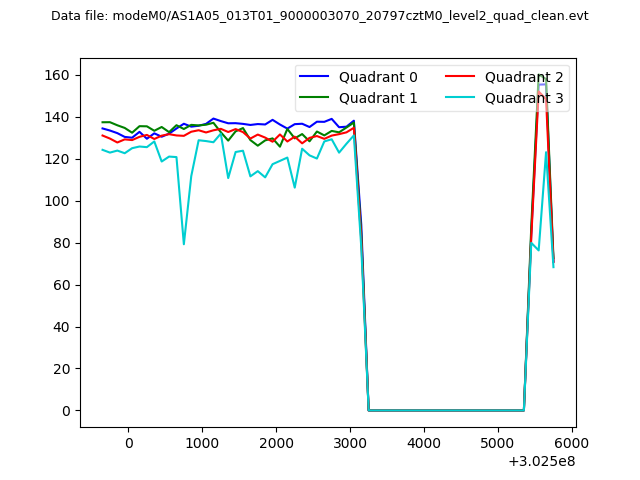 |
|
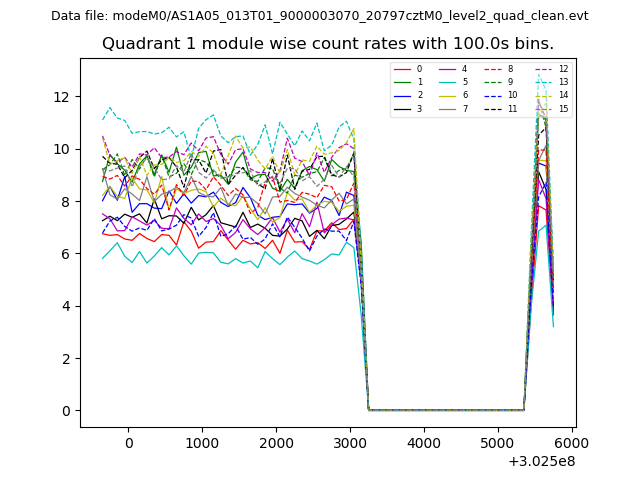
| Module-wise count rates for Quadrant A Data is divided into 100 sec bins |
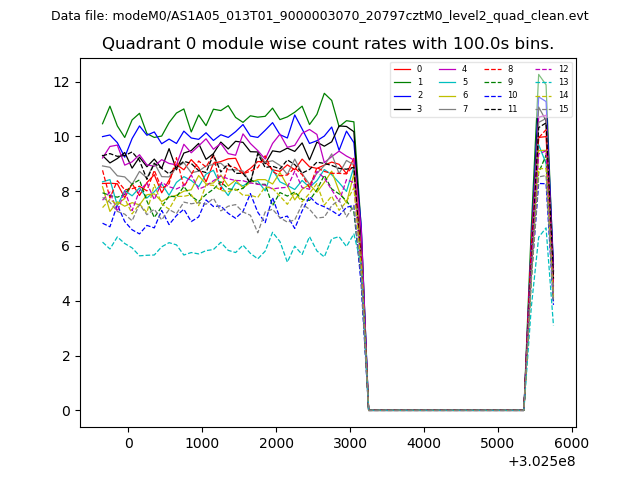 |
 |
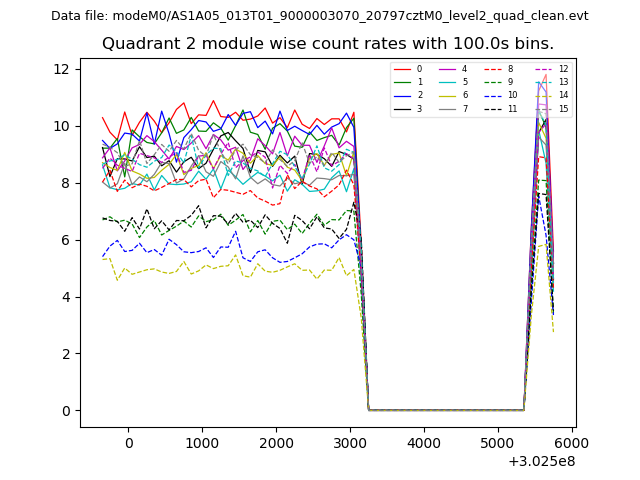
| Module-wise count rates for Quadrant B Data is divided into 100 sec bins |
 |
 |
| Module-wise count rates for Quadrant C Data is divided into 100 sec bins |
 |
 |
| Module-wise count rates for Quadrant D Data is divided into 100 sec bins |
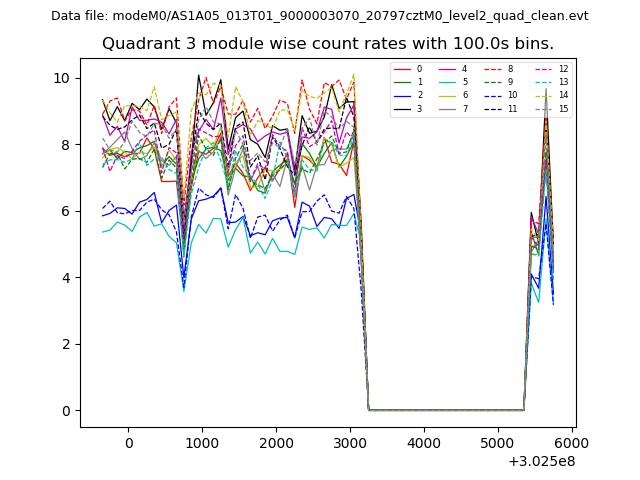 |
 |
| Parameter | Plot |
|---|---|
| CZT HV Monitor | 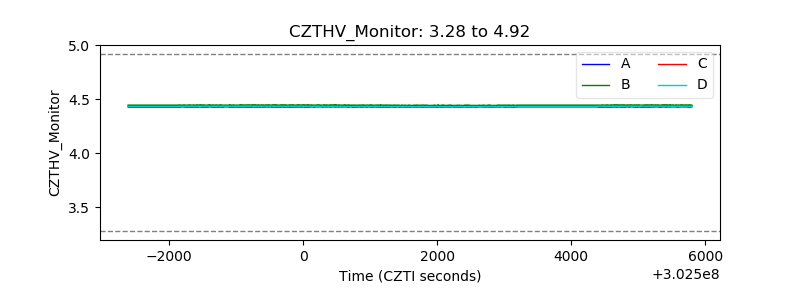 |
| D_VDD | 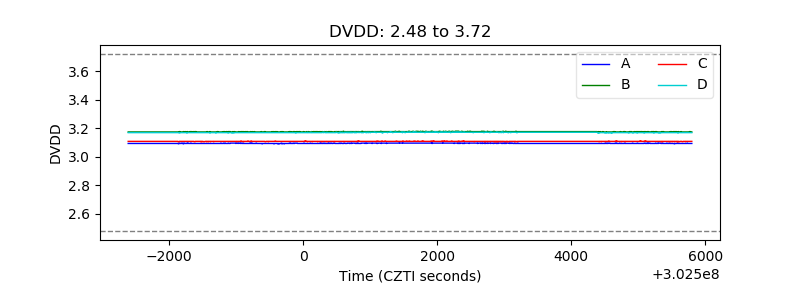 |
| Temperature 1 | 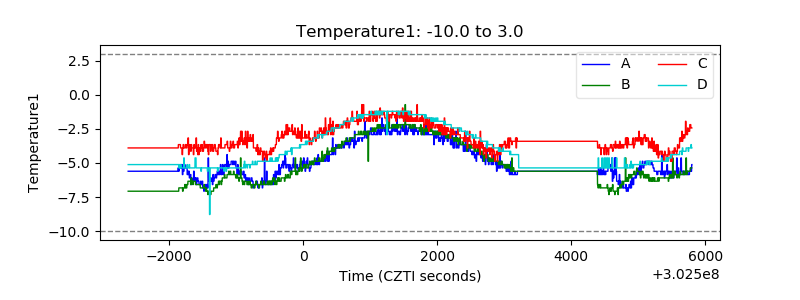 |
| Veto HV Monitor | 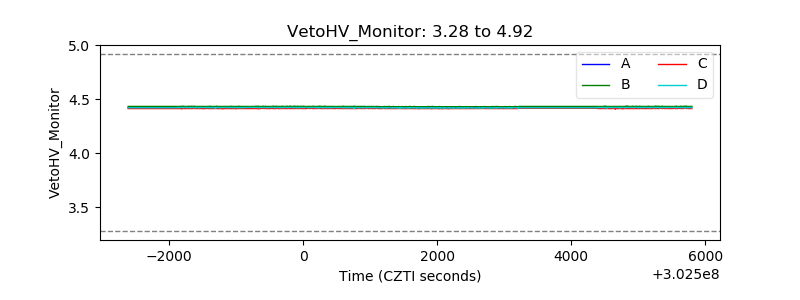 |
| Veto LLD | 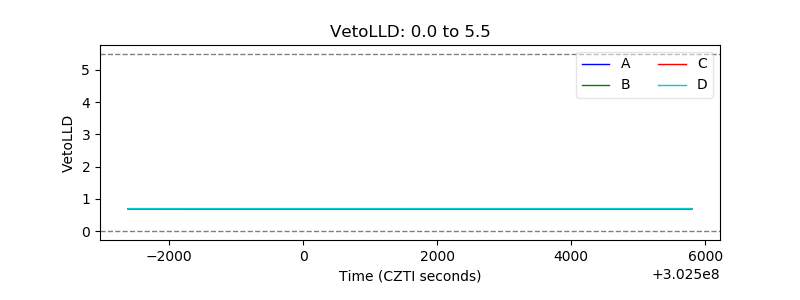 |
| Alpha Counter | 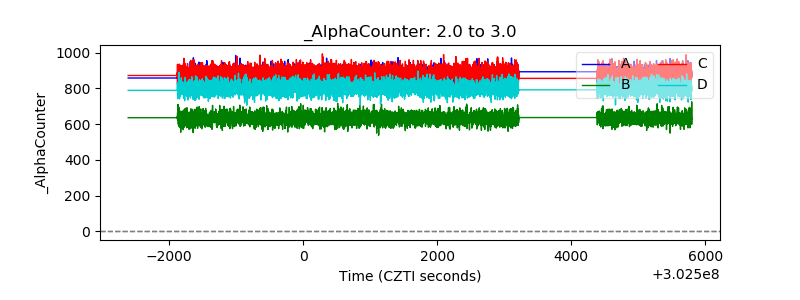 |
| _CPM_Rate | 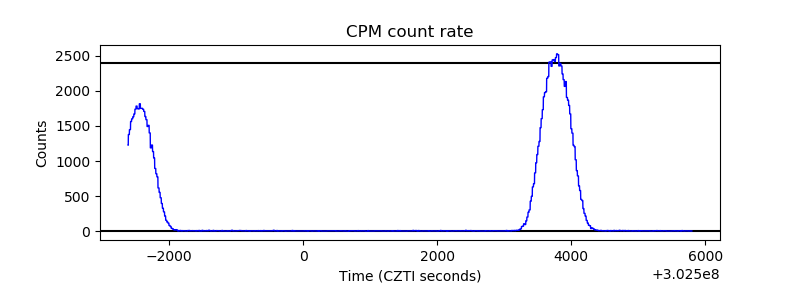 |
| CZT Counter | 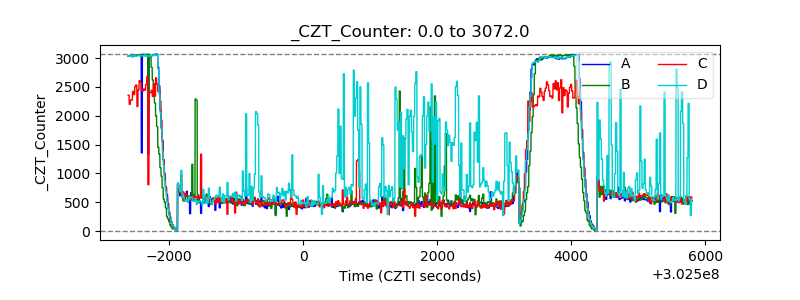 |
| +2.5 Volts monitor |  |
| +5 Volts monitor | 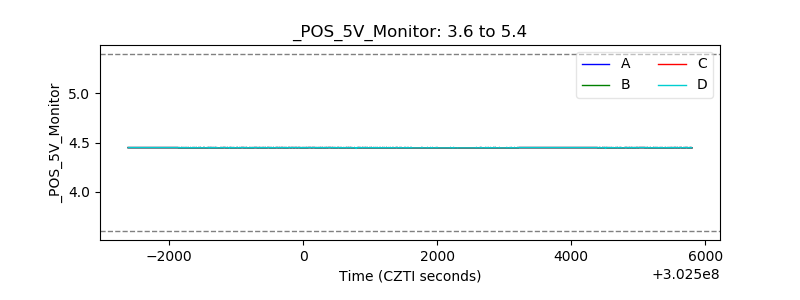 |
| _ROLL_ROT | 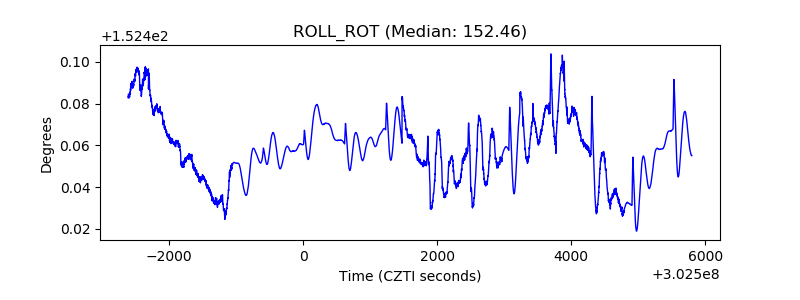 |
| _Roll_DEC | 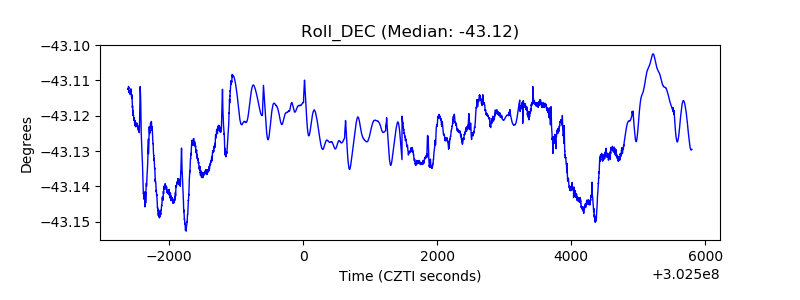 |
| _Roll_RA | 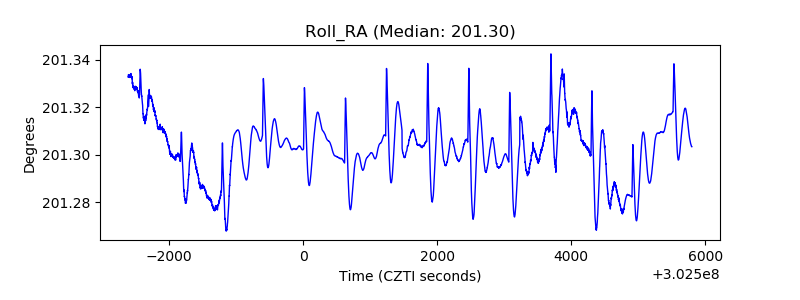 |
| Veto Counter | 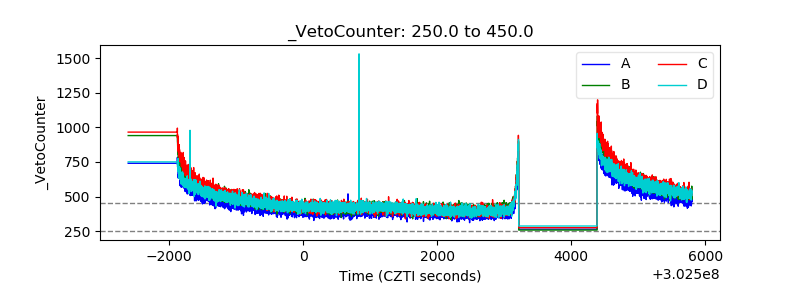 |