| Param | Original file | Final file |
|---|---|---|
| Filename | modeM0/AS1A05_013T01_9000003070_20799cztM0_level2.evt | modeM0/AS1A05_013T01_9000003070_20799cztM0_level2_quad_clean.evt |
| Size (bytes) | 504,745,920 | 115,148,160 |
| Size | 481.4 MB | 109.8 MB |
| Events in quadrant A | 3,103,406 | 799,952 |
| Events in quadrant B | 3,364,655 | 797,058 |
| Events in quadrant C | 3,428,424 | 764,118 |
| Events in quadrant D | 5,001,002 | 725,557 |
| Mode SS | |||
|---|---|---|---|
| Quadrant | BADHDUFLAG | Total packets | Discarded packets |
| A | 0 | 118 | 0 |
| B | 0 | 118 | 0 |
| C | 0 | 118 | 0 |
| D | 0 | 118 | 0 |
| Mode M0 | |||
|---|---|---|---|
| Quadrant | BADHDUFLAG | Total packets | Discarded packets |
| A | 0 | 12802 | 2 |
| B | 0 | 13702 | 1 |
| C | 0 | 13942 | 1 |
| D | 0 | 18899 | 1 |
| Mode M9 | |||
|---|---|---|---|
| Quadrant | BADHDUFLAG | Total packets | Discarded packets |
| A | 0 | 13 | 0 |
| B | 0 | 13 | 0 |
| C | 0 | 13 | 0 |
| D | 0 | 13 | 0 |
| Quadrant | Total seconds | Saturated seconds | Saturation percentage |
|---|---|---|---|
| A | 5728 | 61 | 1.064944% |
| B | 5728 | 94 | 1.641061% |
| C | 5728 | 203 | 3.543994% |
| D | 5728 | 519 | 9.060754% |
Noise dominated data is calculated using 1-second bins in cleaned event files. If a bin has >2000 counts, and if more than 50% of those come from <1% of pixels, then it is considered to be noise-dominated and hence unusable.
| Quadrant | # 1 sec bins | Bins with >0 counts | Bins with >2000 counts | High rate bins dominated by noise | Noise dominated (total time) | Noise dominated (detector-on time) | Marked lightcurve |
|---|---|---|---|---|---|---|---|
| A | 7083 | 5728 | 0 | 0 | 0.00% | 0.00% | 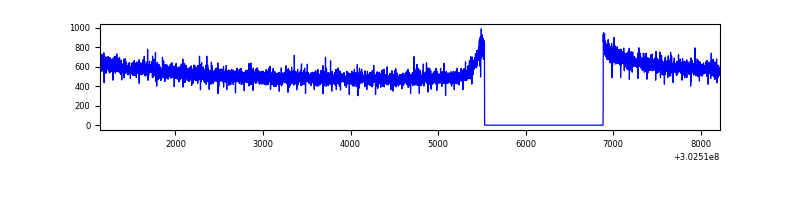 |
| B | 7083 | 5728 | 17 | 17 | 0.24% | 0.30% | 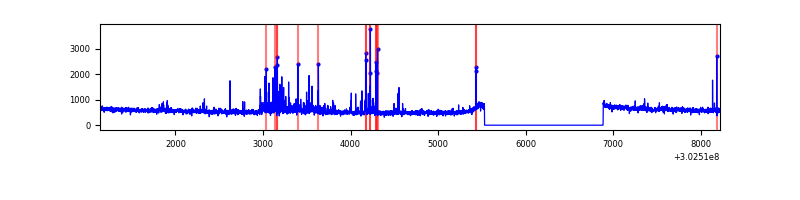 |
| C | 7083 | 5728 | 102 | 102 | 1.44% | 1.78% | 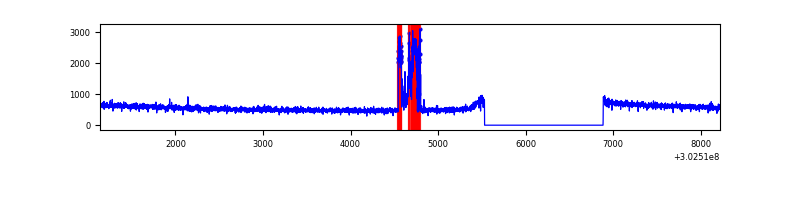 |
| D | 7083 | 5728 | 447 | 447 | 6.31% | 7.80% | 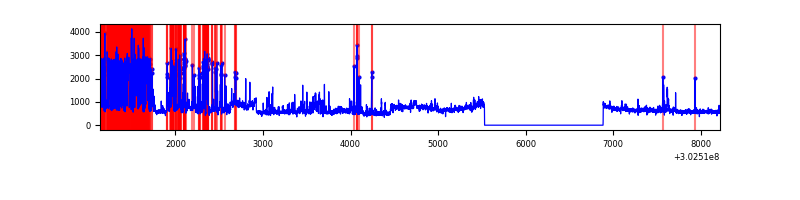 |
Top three noisy pixels from each quadrant. If the there are fewer than three noisy pixels in the level2.evt file, extra rows are filled as -1
| Pixel properties | Quadrant properties | ||||||
|---|---|---|---|---|---|---|---|
| Quadrant | DetID | PixID | Counts | Sigma | Mean | Median | Sigma |
| A | 0 | 226 | 6947 | 38.59 | 807 | 794 | 159.4 |
| A | 12 | 194 | 5852 | 31.73 | 807 | 794 | 159.4 |
| A | 3 | 137 | 5741 | 31.03 | 807 | 794 | 159.4 |
| B | 7 | 220 | 161375 | 1107.83 | 787 | 771 | 145.0 |
| B | 0 | 189 | 38530 | 260.46 | 787 | 771 | 145.0 |
| B | 3 | 64 | 23271 | 155.2 | 787 | 771 | 145.0 |
| C | 9 | 54 | 323499 | 1857.8 | 764 | 772 | 173.7 |
| C | 14 | 238 | 122228 | 699.17 | 764 | 772 | 173.7 |
| C | 13 | 61 | 5316 | 26.16 | 764 | 772 | 173.7 |
| D | 1 | 52 | 1459034 | 8132.14 | 757 | 739 | 179.3 |
| D | 1 | 20 | 415608 | 2313.5 | 757 | 739 | 179.3 |
| D | 12 | 227 | 156139 | 866.58 | 757 | 739 | 179.3 |
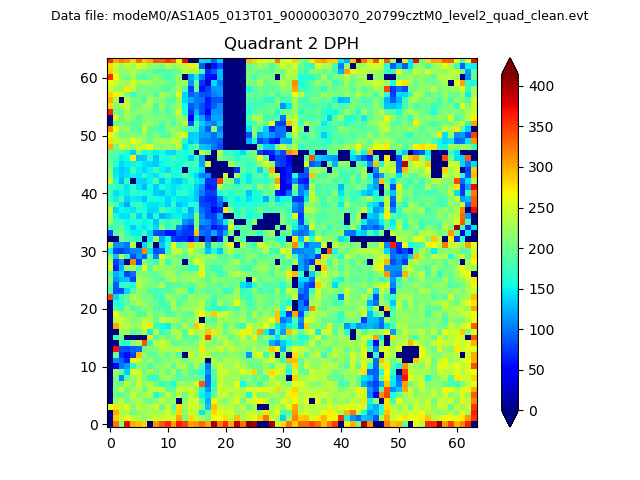
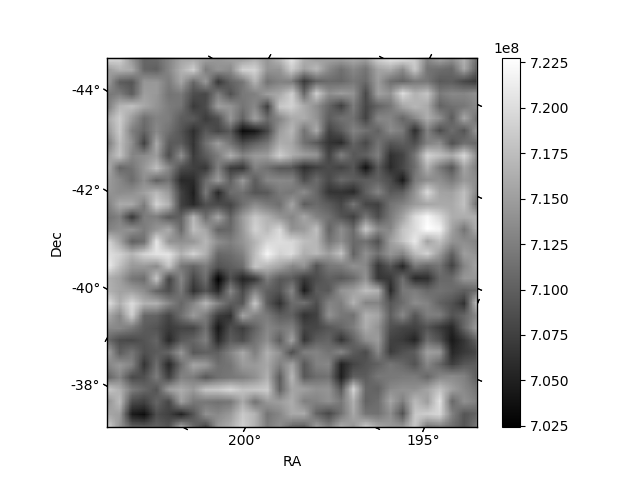
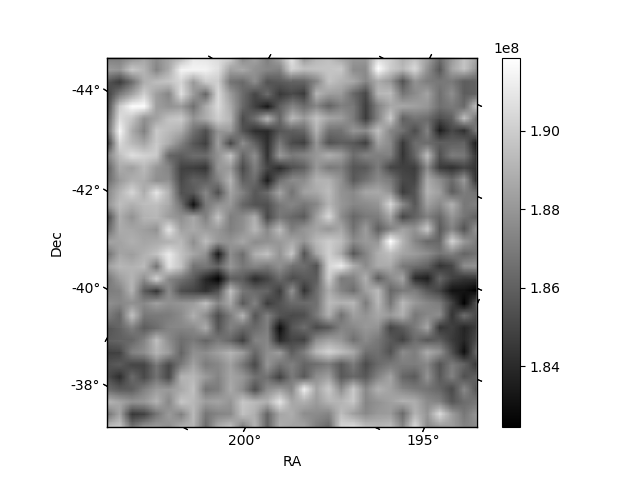
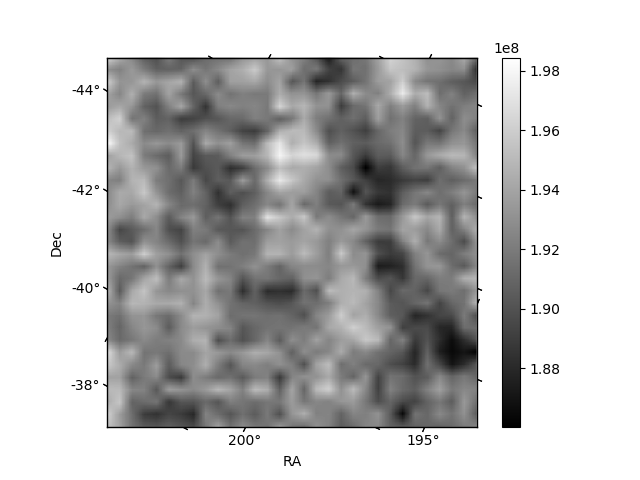
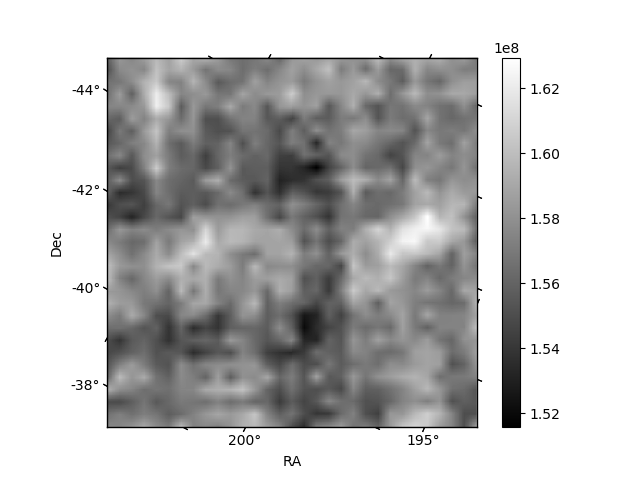
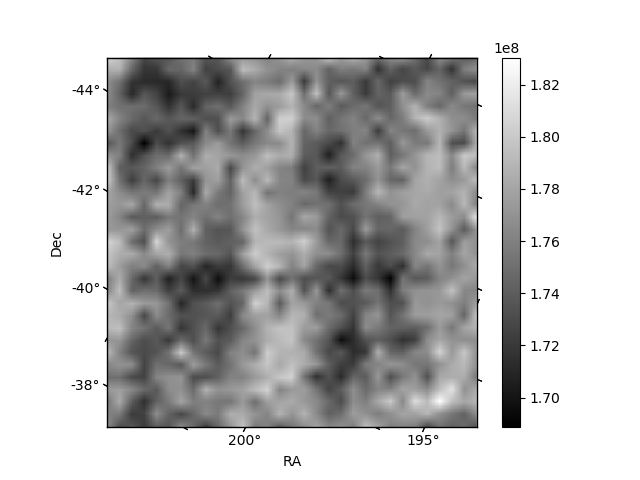
Histogram calculated using DETX and DETY for each event in the final _common_clean file
| Quadrant A | 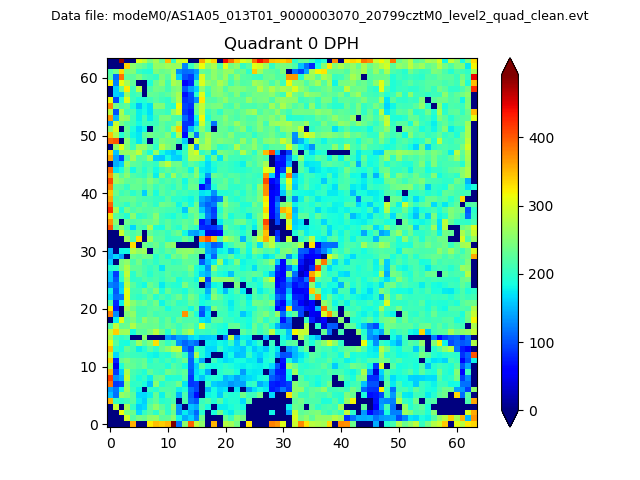 |
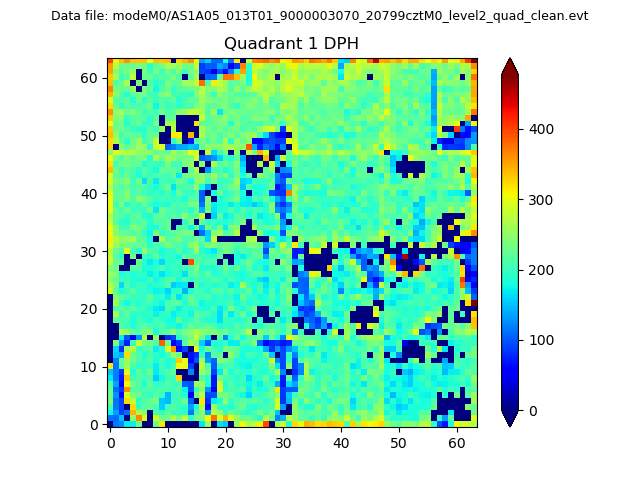 |
Quadrant B |
|---|---|---|---|
| Quadrant D | 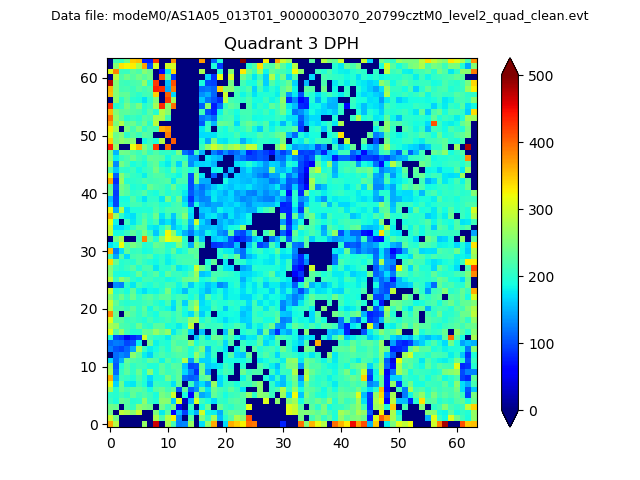 |
 |
Quadrant C |
| Plot type | Count rate plots | Images |
|---|---|---|
| Comparison with Poisson distribution Blue bars denote a histogram of data divided into 1 sec bins. Red curve is a Poisson curve with rate = median count rate of data. |
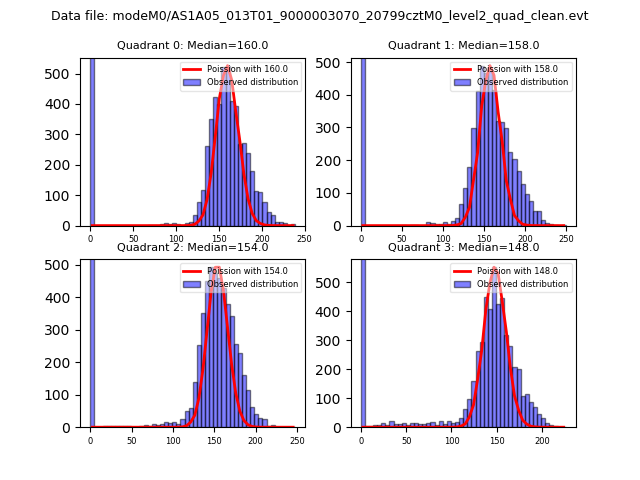 |
 |
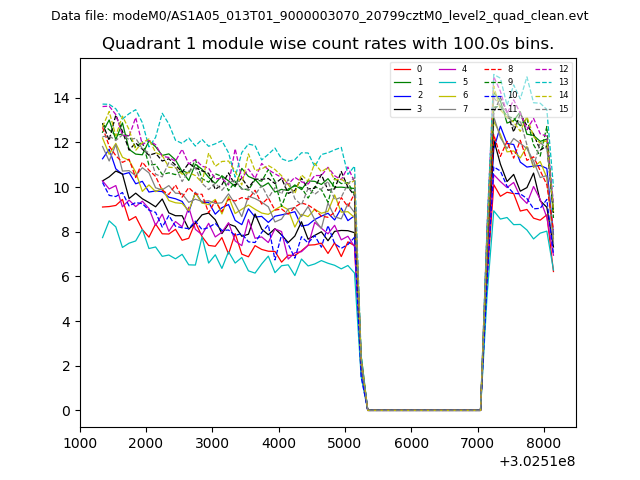
| Quadrant-wise count rates Data is divided into 100 sec bins |
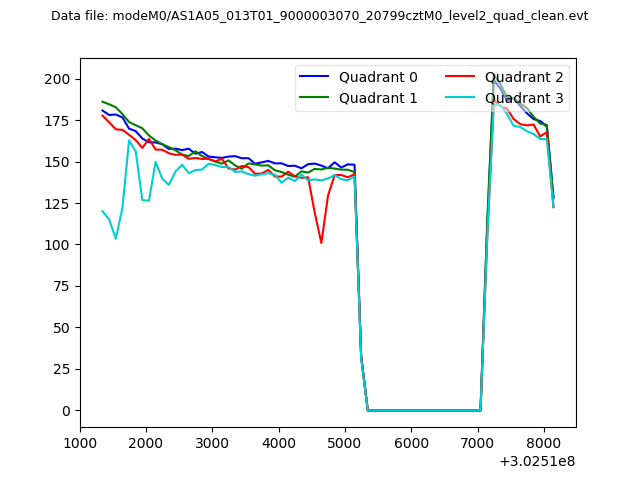 |
|
| Module-wise count rates for Quadrant A Data is divided into 100 sec bins |
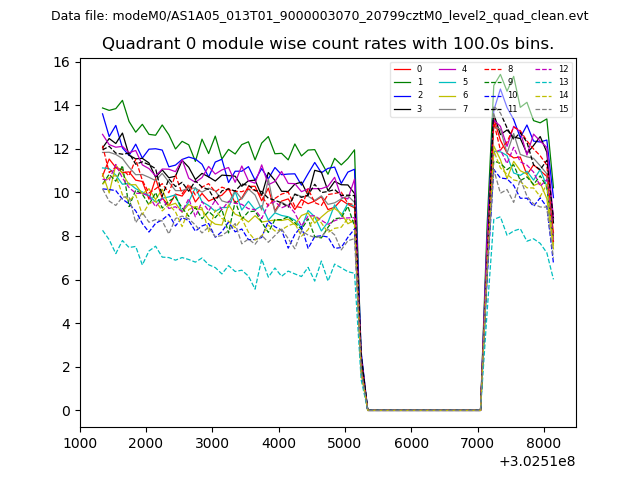 |
 |
| Module-wise count rates for Quadrant B Data is divided into 100 sec bins |
 |
 |
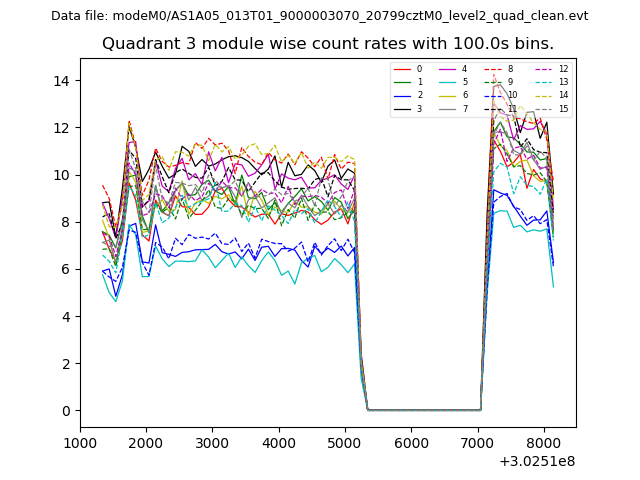
| Module-wise count rates for Quadrant C Data is divided into 100 sec bins |
 |
 |
| Module-wise count rates for Quadrant D Data is divided into 100 sec bins |
 |
 |
| Parameter | Plot |
|---|---|
| CZT HV Monitor | 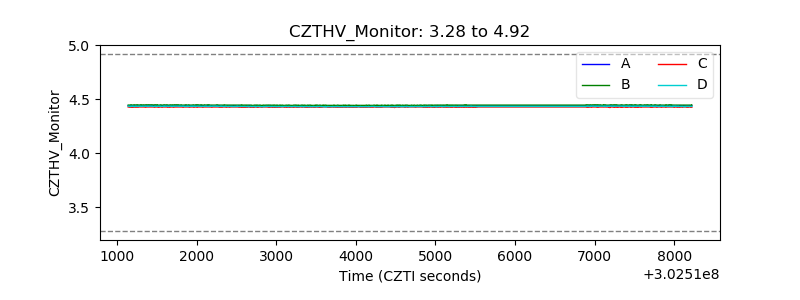 |
| D_VDD | 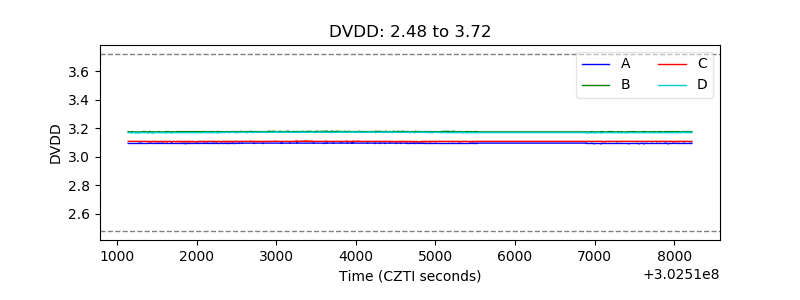 |
| Temperature 1 | 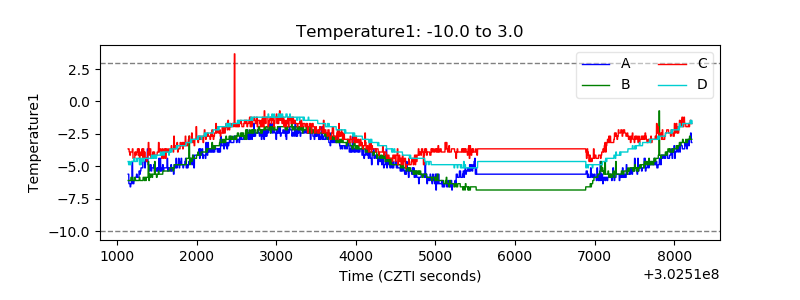 |
| Veto HV Monitor | 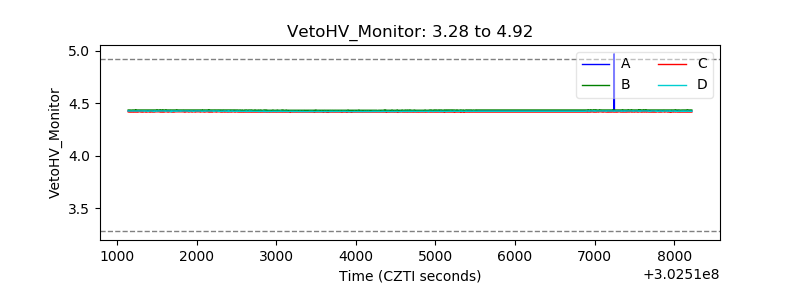 |
| Veto LLD |  |
| Alpha Counter | 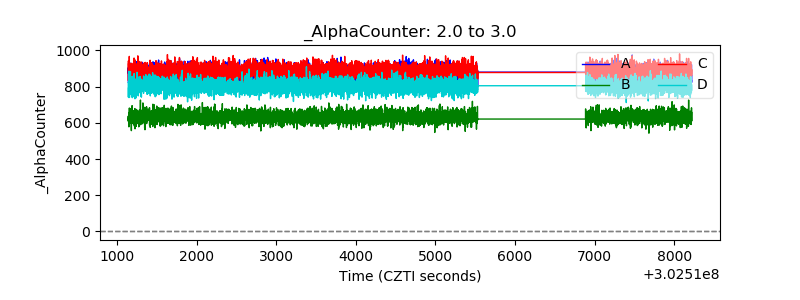 |
| _CPM_Rate | 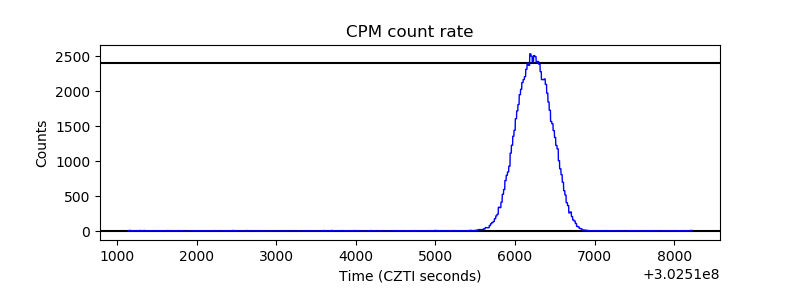 |
| CZT Counter | 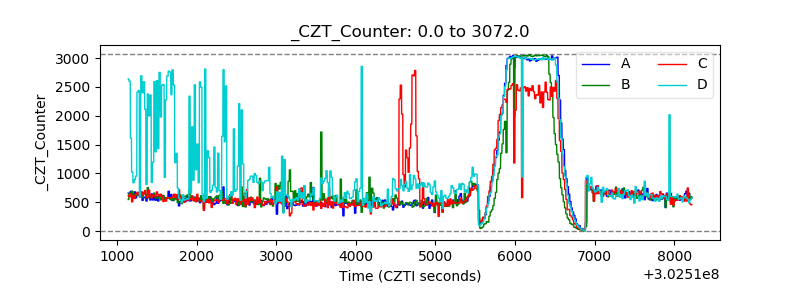 |
| +2.5 Volts monitor |  |
| +5 Volts monitor |  |
| _ROLL_ROT | 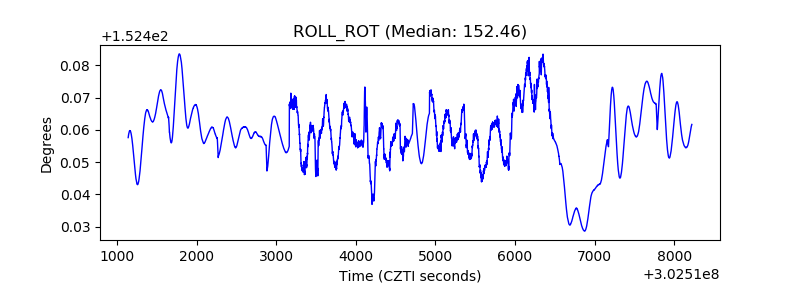 |
| _Roll_DEC | 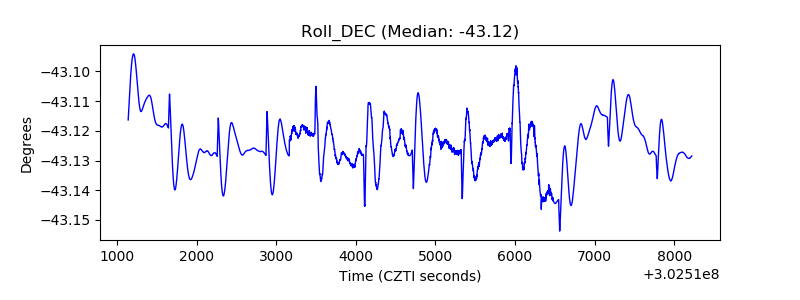 |
| _Roll_RA | 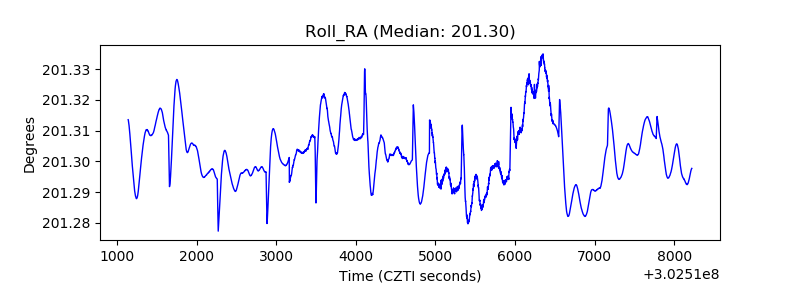 |
| Veto Counter | 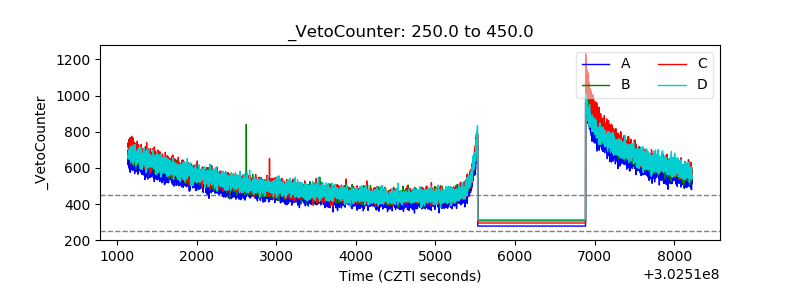 |