| Param | Original file | Final file |
|---|---|---|
| Filename | modeM0/AS1A05_013T01_9000003070_20800cztM0_level2.evt | modeM0/AS1A05_013T01_9000003070_20800cztM0_level2_quad_clean.evt |
| Size (bytes) | 470,715,840 | 124,251,840 |
| Size | 448.9 MB | 118.5 MB |
| Events in quadrant A | 3,163,340 | 864,882 |
| Events in quadrant B | 3,592,693 | 852,156 |
| Events in quadrant C | 3,160,131 | 825,161 |
| Events in quadrant D | 3,942,401 | 812,267 |
| Mode SS | |||
|---|---|---|---|
| Quadrant | BADHDUFLAG | Total packets | Discarded packets |
| A | 0 | 118 | 0 |
| B | 0 | 118 | 0 |
| C | 0 | 118 | 0 |
| D | 0 | 118 | 0 |
| Mode M0 | |||
|---|---|---|---|
| Quadrant | BADHDUFLAG | Total packets | Discarded packets |
| A | 0 | 13080 | 1 |
| B | 0 | 14529 | 1 |
| C | 0 | 13206 | 1 |
| D | 0 | 15598 | 1 |
| Mode M9 | |||
|---|---|---|---|
| Quadrant | BADHDUFLAG | Total packets | Discarded packets |
| A | 0 | 14 | 0 |
| B | 0 | 14 | 0 |
| C | 0 | 14 | 0 |
| D | 0 | 14 | 0 |
| Quadrant | Total seconds | Saturated seconds | Saturation percentage |
|---|---|---|---|
| A | 5855 | 76 | 1.298036% |
| B | 5856 | 131 | 2.237022% |
| C | 5856 | 121 | 2.066257% |
| D | 5856 | 129 | 2.202869% |
Noise dominated data is calculated using 1-second bins in cleaned event files. If a bin has >2000 counts, and if more than 50% of those come from <1% of pixels, then it is considered to be noise-dominated and hence unusable.
| Quadrant | # 1 sec bins | Bins with >0 counts | Bins with >2000 counts | High rate bins dominated by noise | Noise dominated (total time) | Noise dominated (detector-on time) | Marked lightcurve |
|---|---|---|---|---|---|---|---|
| A | 7220 | 5855 | 0 | 0 | 0.00% | 0.00% | 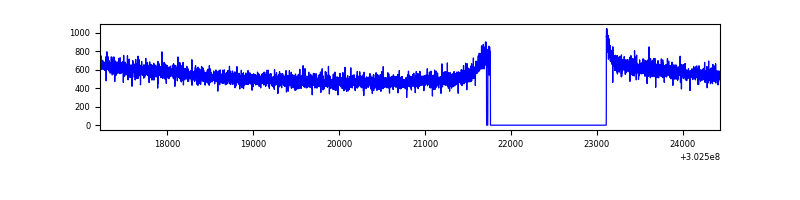 |
| B | 7221 | 5857 | 40 | 40 | 0.55% | 0.68% | 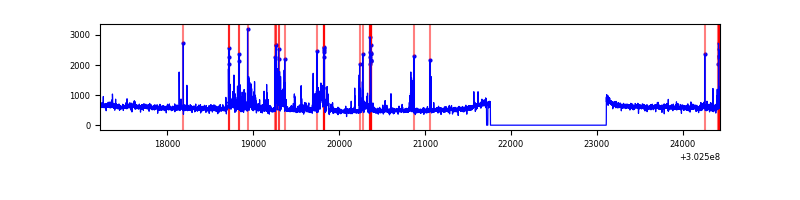 |
| C | 7221 | 5856 | 0 | 0 | 0.00% | 0.00% | 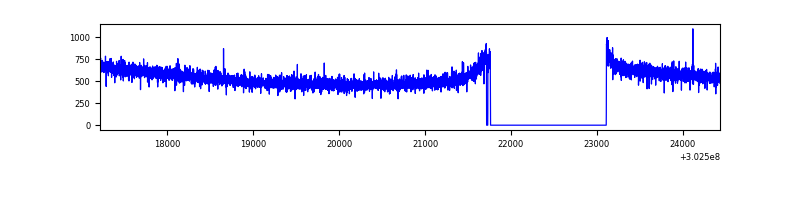 |
| D | 7221 | 5857 | 78 | 78 | 1.08% | 1.33% | 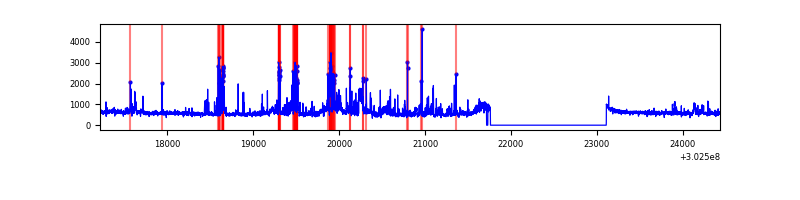 |
Top three noisy pixels from each quadrant. If the there are fewer than three noisy pixels in the level2.evt file, extra rows are filled as -1
| Pixel properties | Quadrant properties | ||||||
|---|---|---|---|---|---|---|---|
| Quadrant | DetID | PixID | Counts | Sigma | Mean | Median | Sigma |
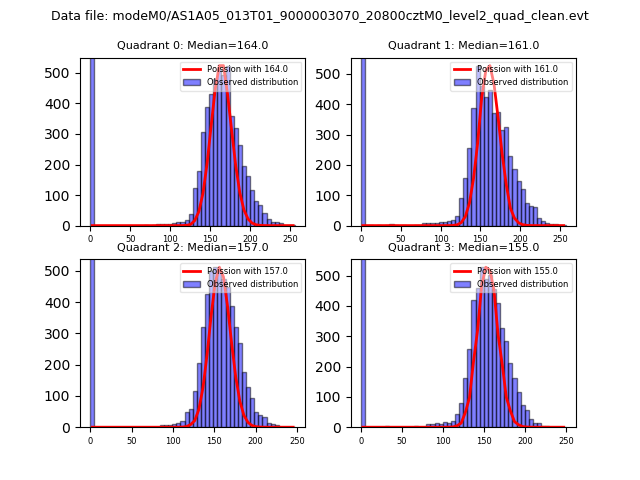
| A | 0 | 226 | 7230 | 39.82 | 823 | 810 | 161.2 |
| A | 3 | 137 | 5910 | 31.63 | 823 | 810 | 161.2 |
| A | 12 | 194 | 5894 | 31.54 | 823 | 810 | 161.2 |
| B | 0 | 182 | 184860 | 1254.47 | 799 | 783 | 146.7 |
| B | 7 | 220 | 124508 | 843.18 | 799 | 783 | 146.7 |
| B | 0 | 189 | 54713 | 367.53 | 799 | 783 | 146.7 |
| C | 14 | 238 | 126354 | 709.37 | 777 | 785 | 177.0 |
| C | 13 | 61 | 5424 | 26.21 | 777 | 785 | 177.0 |
| C | 7 | 247 | 4011 | 18.22 | 777 | 785 | 177.0 |
| D | 1 | 52 | 449852 | 2366.68 | 797 | 776 | 189.7 |
| D | 1 | 239 | 104326 | 545.72 | 797 | 776 | 189.7 |
| D | 9 | 1 | 99587 | 520.74 | 797 | 776 | 189.7 |
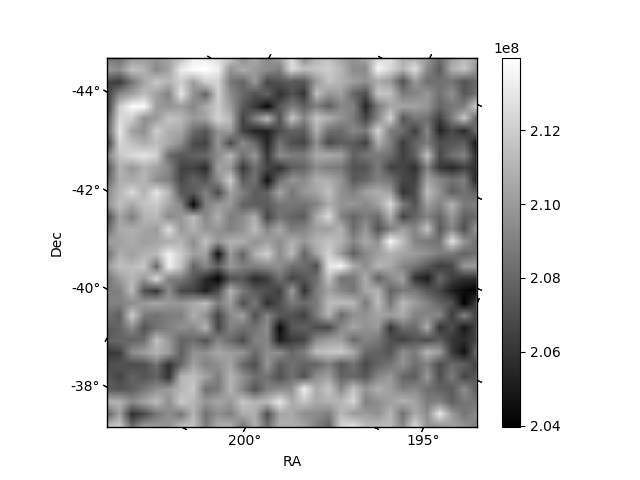
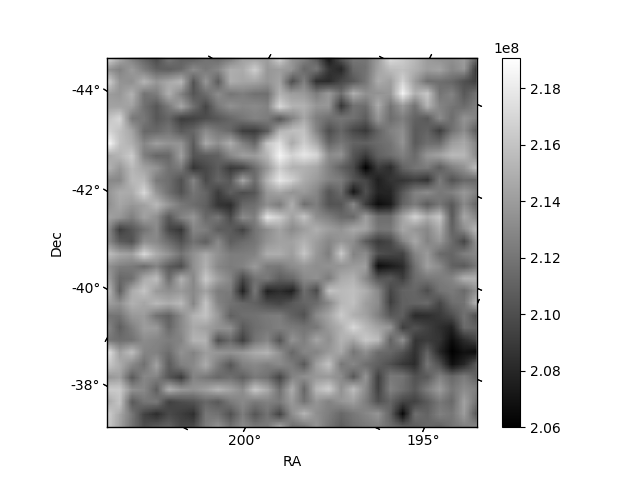
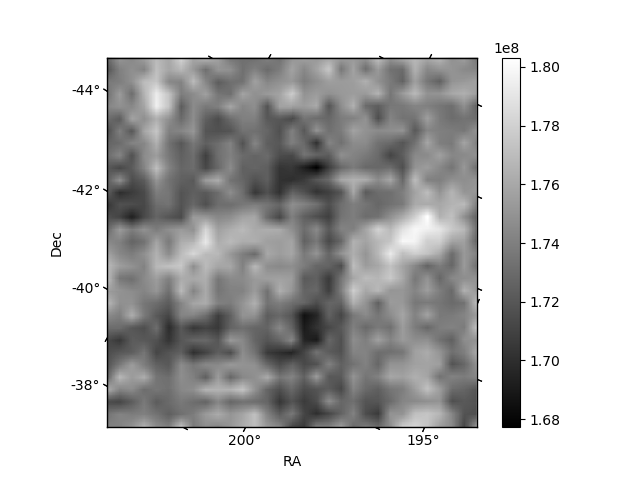
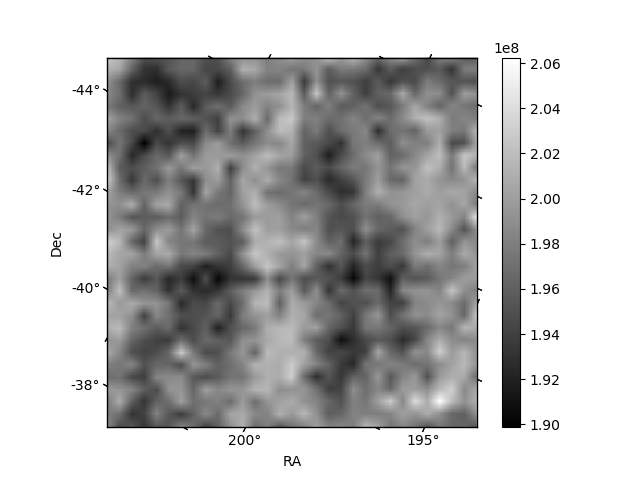
Histogram calculated using DETX and DETY for each event in the final _common_clean file
| Quadrant A |  |
 |
Quadrant B |
|---|---|---|---|
| Quadrant D |  |
 |
Quadrant C |
| Plot type | Count rate plots | Images |
|---|---|---|
| Comparison with Poisson distribution Blue bars denote a histogram of data divided into 1 sec bins. Red curve is a Poisson curve with rate = median count rate of data. |
 |
 |
| Quadrant-wise count rates Data is divided into 100 sec bins |
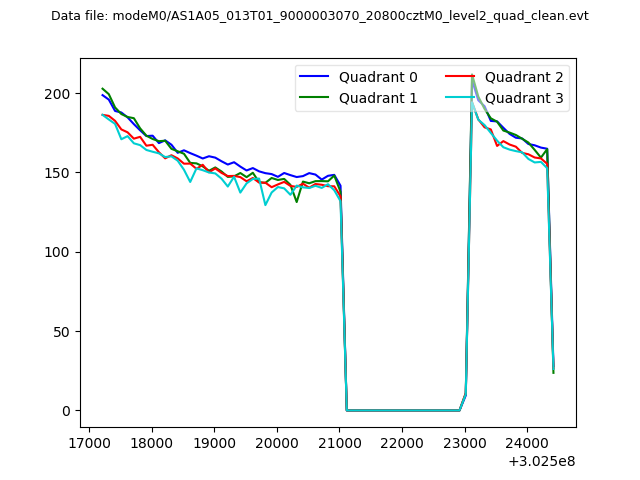 |
|
| Module-wise count rates for Quadrant A Data is divided into 100 sec bins |
 |
 |
| Module-wise count rates for Quadrant B Data is divided into 100 sec bins |
 |
 |
| Module-wise count rates for Quadrant C Data is divided into 100 sec bins |
 |
 |
| Module-wise count rates for Quadrant D Data is divided into 100 sec bins |
 |
 |
| Parameter | Plot |
|---|---|
| CZT HV Monitor |  |
| D_VDD | 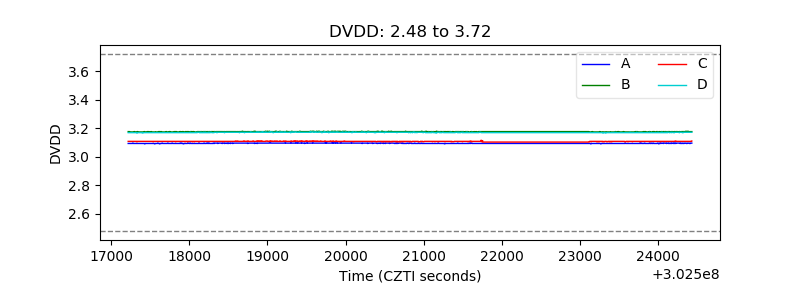 |
| Temperature 1 |  |
| Veto HV Monitor |  |
| Veto LLD |  |
| Alpha Counter | 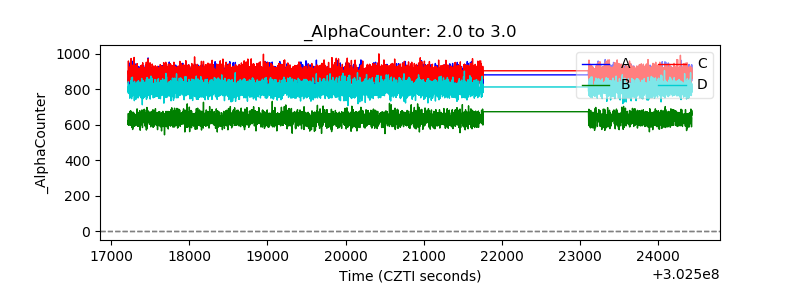 |
| _CPM_Rate | 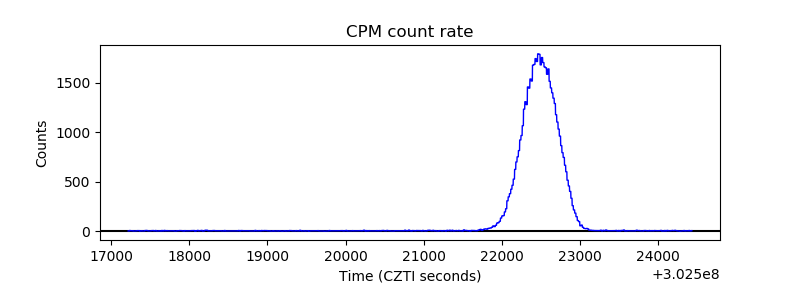 |
| CZT Counter |  |
| +2.5 Volts monitor |  |
| +5 Volts monitor |  |
| _ROLL_ROT |  |
| _Roll_DEC |  |
| _Roll_RA |  |
| Veto Counter |  |