| Param | Original file | Final file |
|---|---|---|
| Filename | modeM0/AS1A05_013T01_9000003070_20802cztM0_level2.evt | modeM0/AS1A05_013T01_9000003070_20802cztM0_level2_quad_clean.evt |
| Size (bytes) | 482,705,280 | 97,623,360 |
| Size | 460.3 MB | 93.1 MB |
| Events in quadrant A | 3,127,330 | 658,645 |
| Events in quadrant B | 3,647,385 | 640,450 |
| Events in quadrant C | 3,131,587 | 625,510 |
| Events in quadrant D | 4,279,564 | 586,969 |
| Mode SS | |||
|---|---|---|---|
| Quadrant | BADHDUFLAG | Total packets | Discarded packets |
| A | 0 | 130 | 0 |
| B | 0 | 130 | 0 |
| C | 0 | 130 | 0 |
| D | 0 | 130 | 0 |
| Mode M0 | |||
|---|---|---|---|
| Quadrant | BADHDUFLAG | Total packets | Discarded packets |
| A | 0 | 13235 | 1 |
| B | 0 | 14977 | 1 |
| C | 0 | 13313 | 1 |
| D | 0 | 16845 | 1 |
| Mode M9 | |||
|---|---|---|---|
| Quadrant | BADHDUFLAG | Total packets | Discarded packets |
| A | 0 | 9 | 0 |
| B | 0 | 9 | 0 |
| C | 0 | 9 | 0 |
| D | 0 | 9 | 0 |
| Quadrant | Total seconds | Saturated seconds | Saturation percentage |
|---|---|---|---|
| A | 6372 | 85 | 1.333961% |
| B | 6372 | 138 | 2.165725% |
| C | 6373 | 100 | 1.569120% |
| D | 6373 | 446 | 6.998274% |
Noise dominated data is calculated using 1-second bins in cleaned event files. If a bin has >2000 counts, and if more than 50% of those come from <1% of pixels, then it is considered to be noise-dominated and hence unusable.
| Quadrant | # 1 sec bins | Bins with >0 counts | Bins with >2000 counts | High rate bins dominated by noise | Noise dominated (total time) | Noise dominated (detector-on time) | Marked lightcurve |
|---|---|---|---|---|---|---|---|
| A | 7357 | 6372 | 0 | 0 | 0.00% | 0.00% | 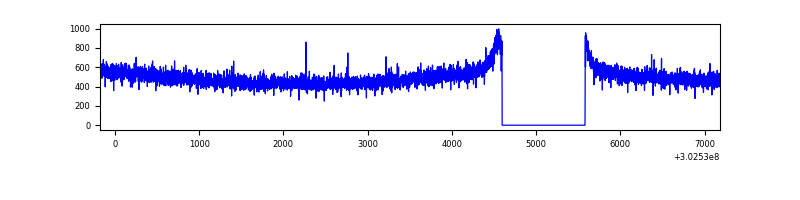 |
| B | 7357 | 6372 | 40 | 40 | 0.54% | 0.63% | 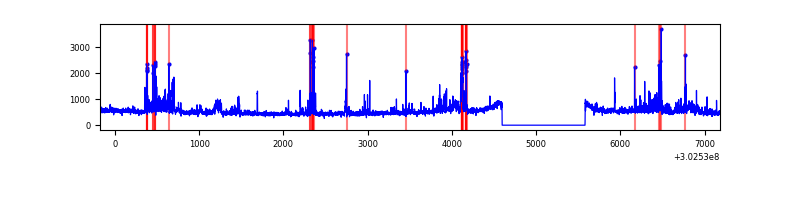 |
| C | 7358 | 6374 | 3 | 3 | 0.04% | 0.05% | 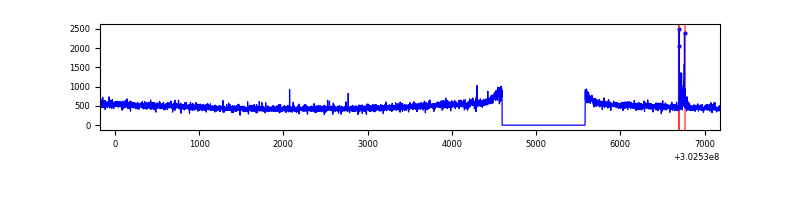 |
| D | 7358 | 6374 | 395 | 395 | 5.37% | 6.20% | 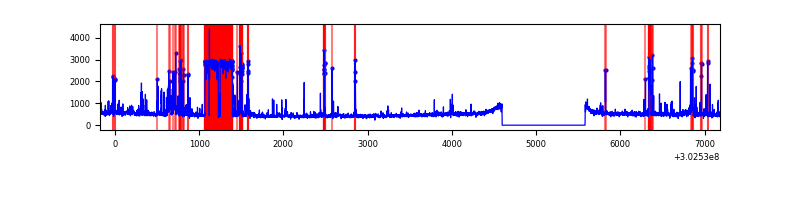 |
Top three noisy pixels from each quadrant. If the there are fewer than three noisy pixels in the level2.evt file, extra rows are filled as -1
| Pixel properties | Quadrant properties | ||||||
|---|---|---|---|---|---|---|---|
| Quadrant | DetID | PixID | Counts | Sigma | Mean | Median | Sigma |
| A | 0 | 226 | 7249 | 39.5 | 814 | 798 | 163.3 |
| A | 3 | 137 | 6270 | 33.51 | 814 | 798 | 163.3 |
| A | 12 | 194 | 5845 | 30.9 | 814 | 798 | 163.3 |
| B | 7 | 220 | 171696 | 1133.1 | 793 | 774 | 150.8 |
| B | 3 | 64 | 146177 | 963.92 | 793 | 774 | 150.8 |
| B | 0 | 189 | 52777 | 344.75 | 793 | 774 | 150.8 |
| C | 14 | 238 | 120635 | 679.4 | 762 | 769 | 176.4 |
| C | 9 | 54 | 23516 | 128.93 | 762 | 769 | 176.4 |
| C | 7 | 247 | 15438 | 83.14 | 762 | 769 | 176.4 |
| D | 1 | 52 | 1109680 | 6075.31 | 762 | 742 | 182.5 |
| D | 7 | 38 | 91310 | 496.18 | 762 | 742 | 182.5 |
| D | 13 | 153 | 61200 | 331.22 | 762 | 742 | 182.5 |
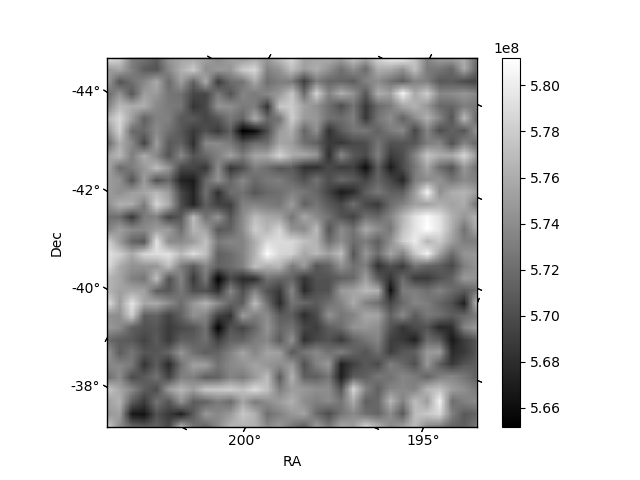
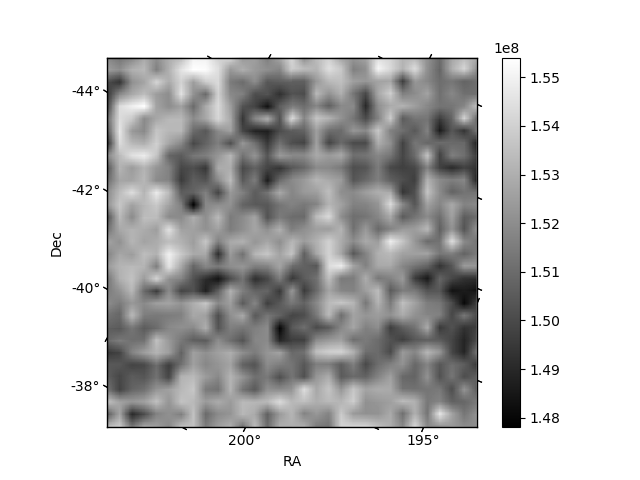
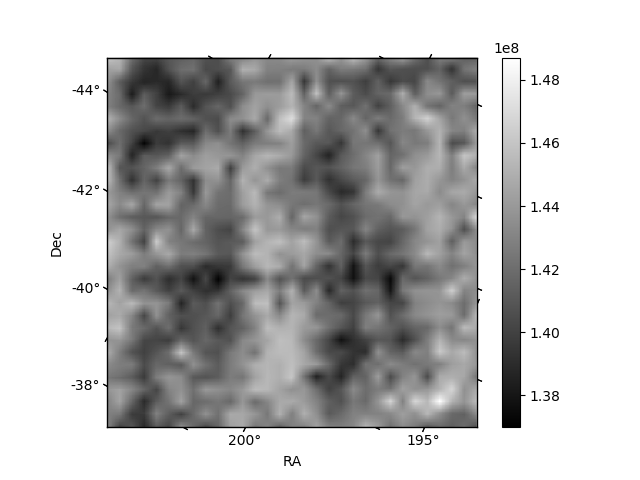
Histogram calculated using DETX and DETY for each event in the final _common_clean file
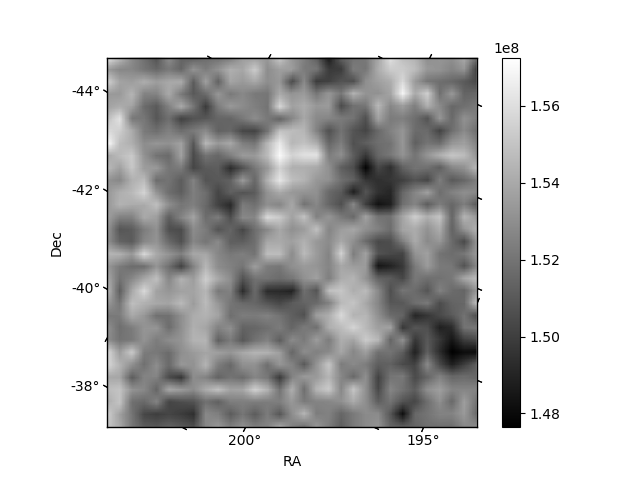
| Quadrant A | 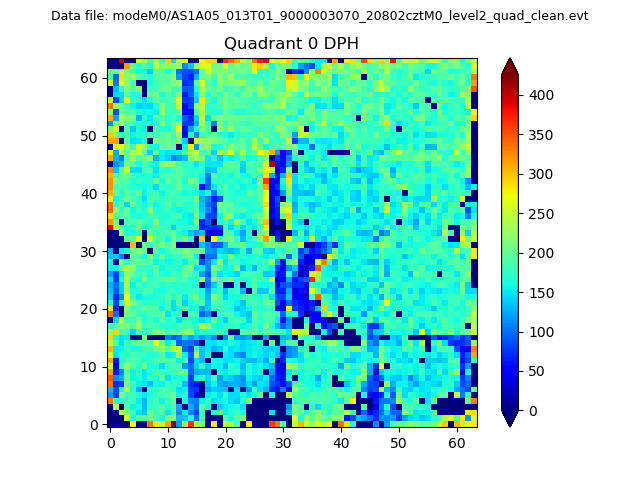 |
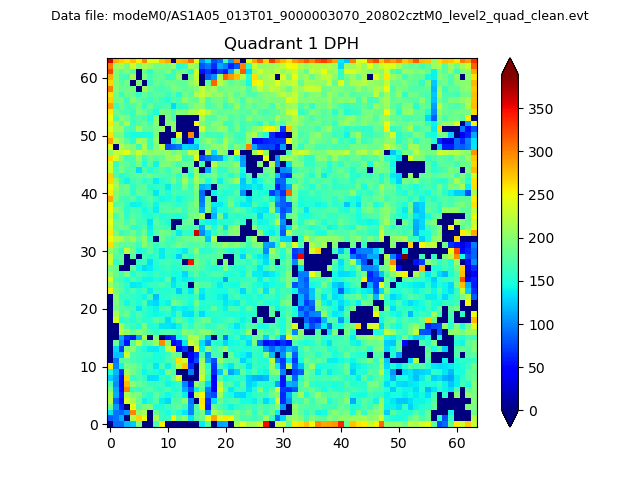 |
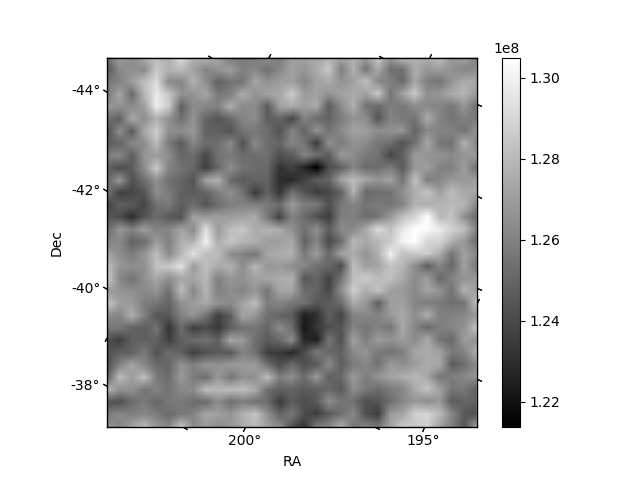
Quadrant B |
|---|---|---|---|
| Quadrant D | 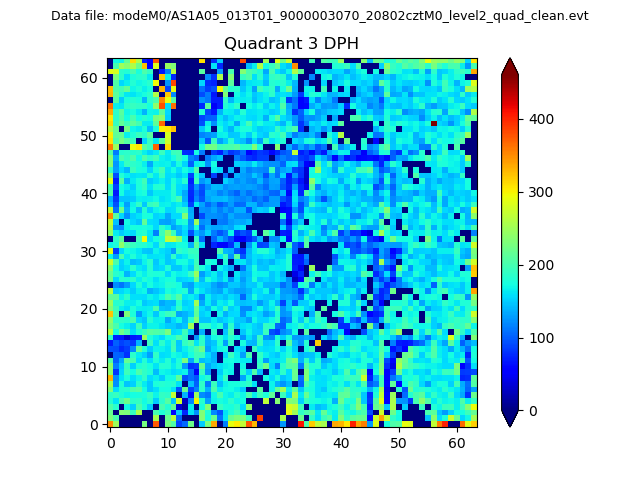 |
 |
Quadrant C |
| Plot type | Count rate plots | Images |
|---|---|---|
| Comparison with Poisson distribution Blue bars denote a histogram of data divided into 1 sec bins. Red curve is a Poisson curve with rate = median count rate of data. |
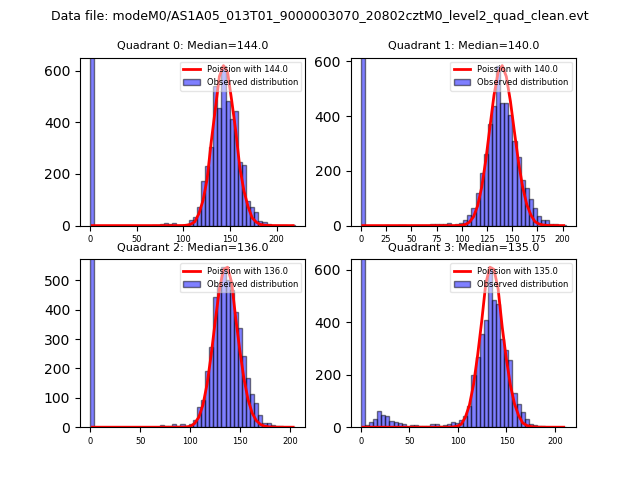 |
 |
| Quadrant-wise count rates Data is divided into 100 sec bins |
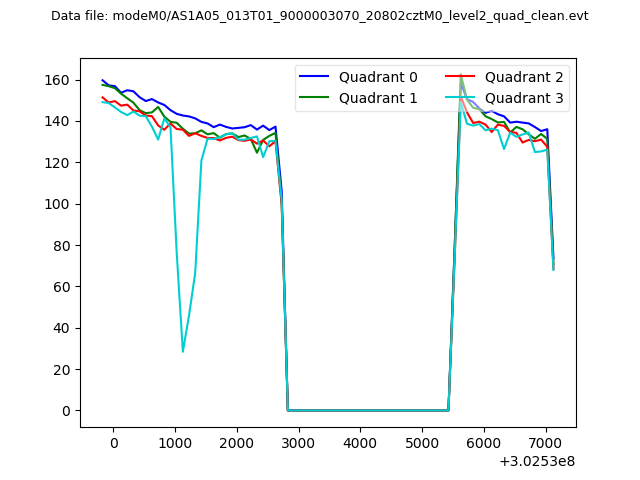 |
|
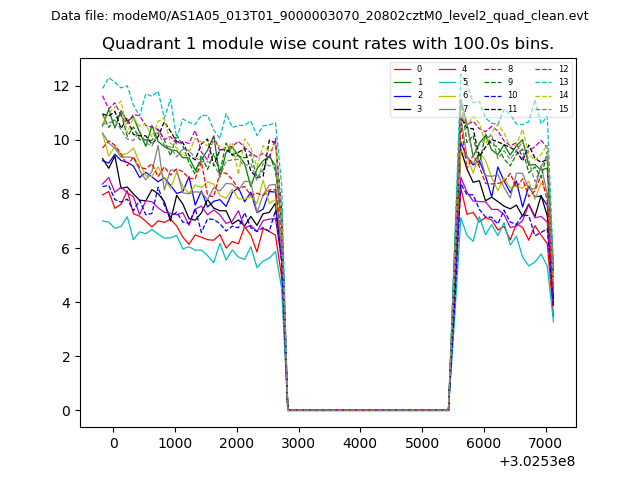
| Module-wise count rates for Quadrant A Data is divided into 100 sec bins |
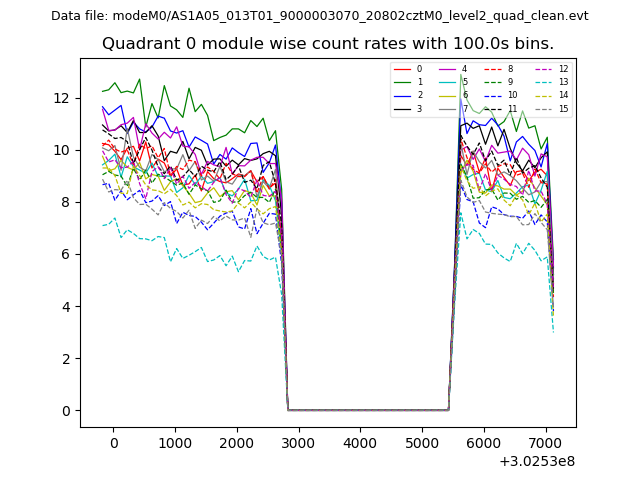 |
 |
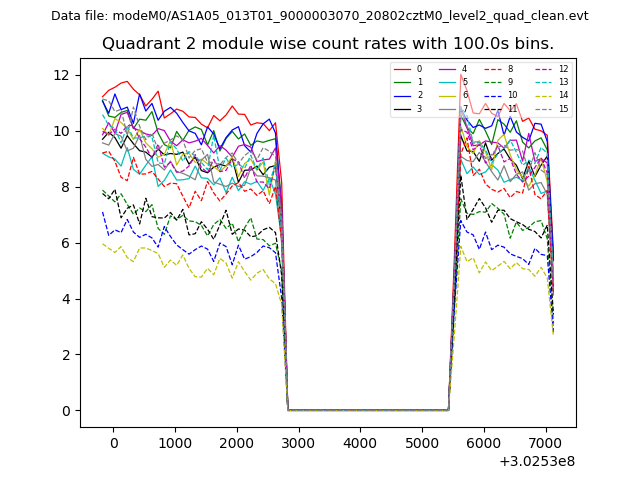
| Module-wise count rates for Quadrant B Data is divided into 100 sec bins |
 |
 |
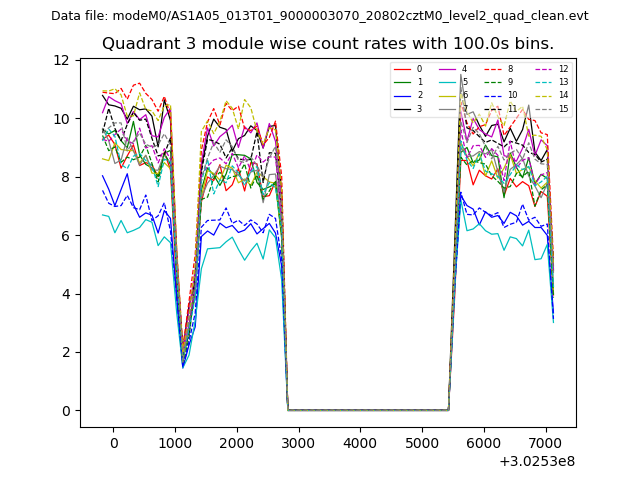
| Module-wise count rates for Quadrant C Data is divided into 100 sec bins |
 |
 |
| Module-wise count rates for Quadrant D Data is divided into 100 sec bins |
 |
 |
| Parameter | Plot |
|---|---|
| CZT HV Monitor | 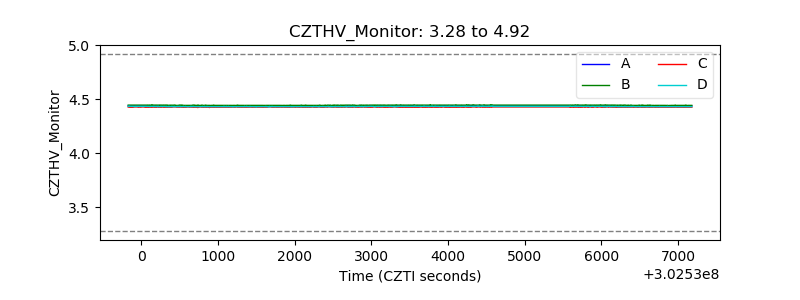 |
| D_VDD | 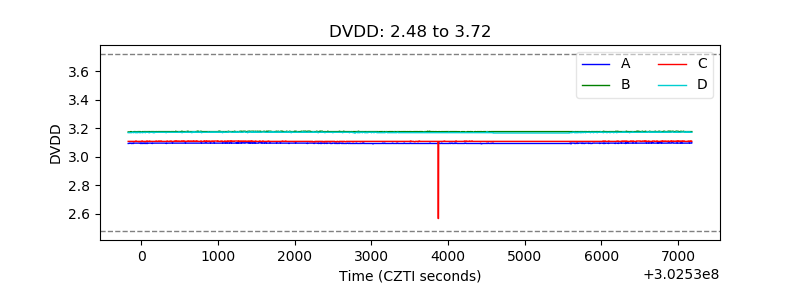 |
| Temperature 1 | 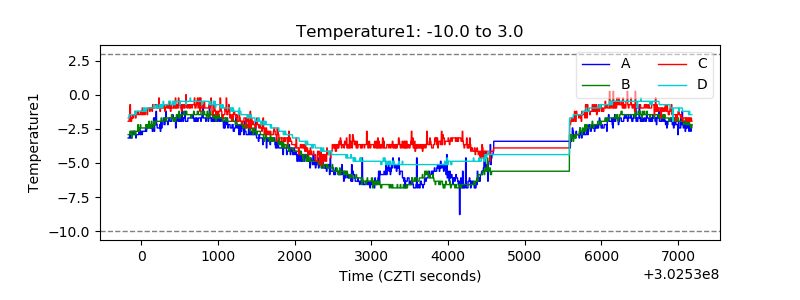 |
| Veto HV Monitor | 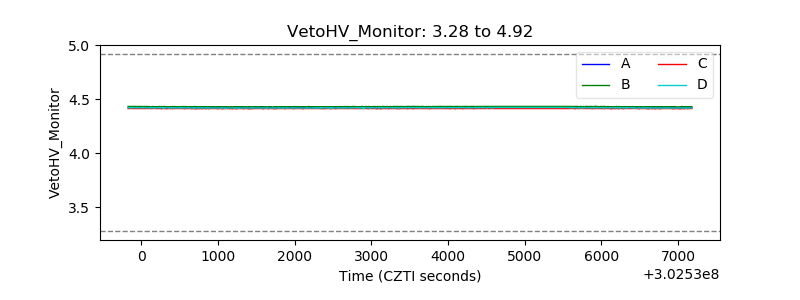 |
| Veto LLD | 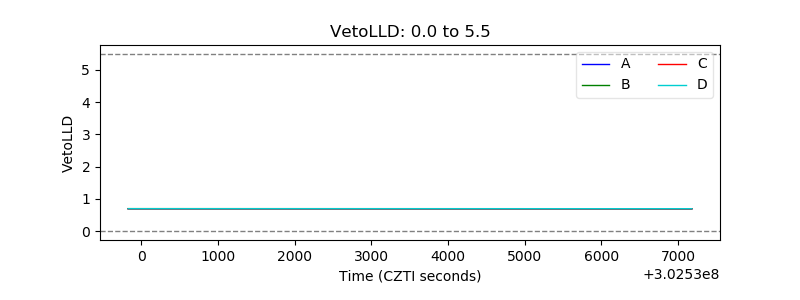 |
| Alpha Counter | 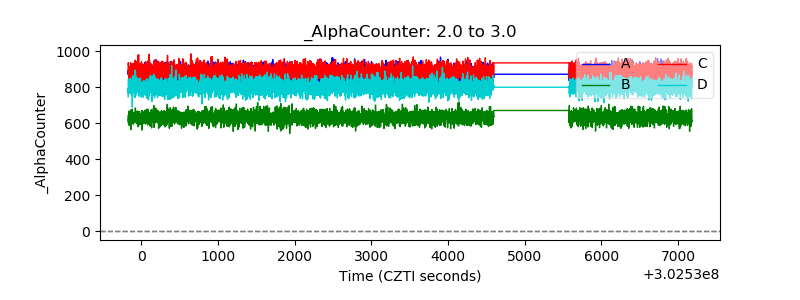 |
| _CPM_Rate | 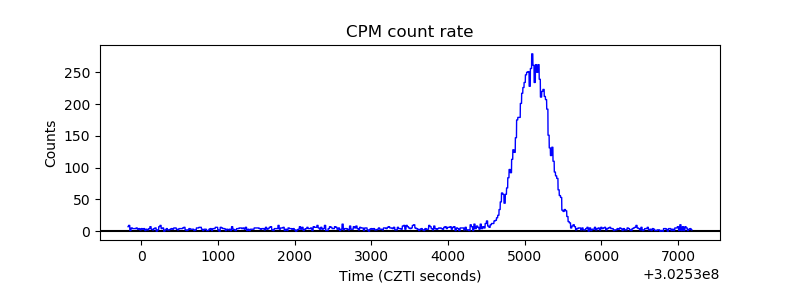 |
| CZT Counter |  |
| +2.5 Volts monitor |  |
| +5 Volts monitor | 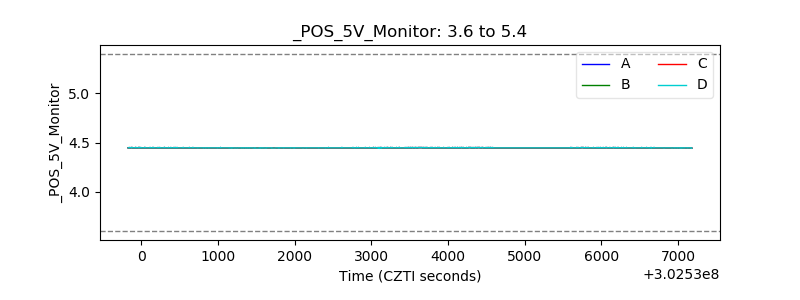 |
| _ROLL_ROT | 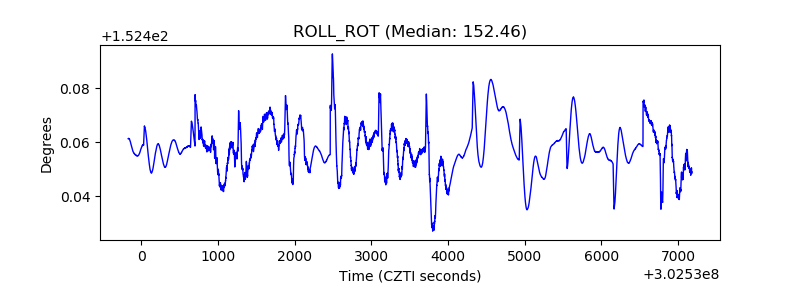 |
| _Roll_DEC | 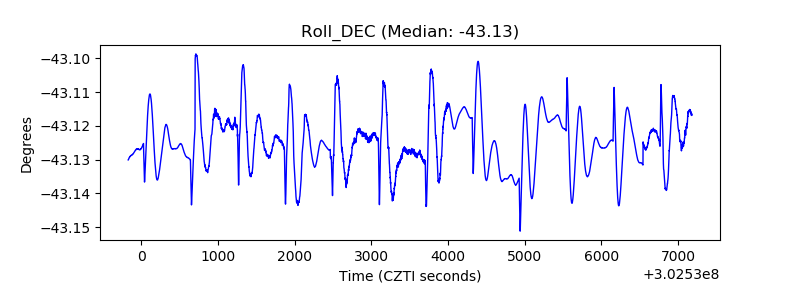 |
| _Roll_RA | 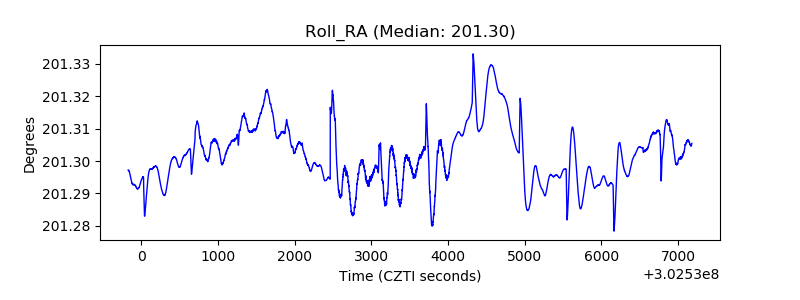 |
| Veto Counter | 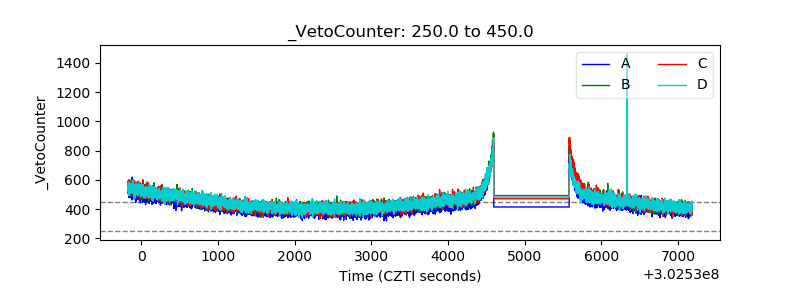 |