| Param | Original file | Final file |
|---|---|---|
| Filename | modeM0/AS1A05_013T01_9000003070_20803cztM0_level2.evt | modeM0/AS1A05_013T01_9000003070_20803cztM0_level2_quad_clean.evt |
| Size (bytes) | 507,179,520 | 96,600,960 |
| Size | 483.7 MB | 92.1 MB |
| Events in quadrant A | 3,137,285 | 638,757 |
| Events in quadrant B | 3,454,954 | 625,364 |
| Events in quadrant C | 3,146,920 | 610,505 |
| Events in quadrant D | 5,172,427 | 590,091 |
| Mode SS | |||
|---|---|---|---|
| Quadrant | BADHDUFLAG | Total packets | Discarded packets |
| A | 0 | 134 | 0 |
| B | 0 | 134 | 0 |
| C | 0 | 134 | 0 |
| D | 0 | 134 | 0 |
| Mode M0 | |||
|---|---|---|---|
| Quadrant | BADHDUFLAG | Total packets | Discarded packets |
| A | 0 | 13601 | 2 |
| B | 0 | 14521 | 1 |
| C | 0 | 13715 | 1 |
| D | 0 | 19858 | 1 |
| Mode M9 | |||
|---|---|---|---|
| Quadrant | BADHDUFLAG | Total packets | Discarded packets |
| A | 0 | 6 | 0 |
| B | 0 | 6 | 0 |
| C | 0 | 6 | 0 |
| D | 0 | 6 | 0 |
| Quadrant | Total seconds | Saturated seconds | Saturation percentage |
|---|---|---|---|
| A | 6605 | 61 | 0.923543% |
| B | 6605 | 86 | 1.302044% |
| C | 6606 | 82 | 1.241296% |
| D | 6606 | 444 | 6.721163% |
Noise dominated data is calculated using 1-second bins in cleaned event files. If a bin has >2000 counts, and if more than 50% of those come from <1% of pixels, then it is considered to be noise-dominated and hence unusable.
| Quadrant | # 1 sec bins | Bins with >0 counts | Bins with >2000 counts | High rate bins dominated by noise | Noise dominated (total time) | Noise dominated (detector-on time) | Marked lightcurve |
|---|---|---|---|---|---|---|---|
| A | 7195 | 6606 | 0 | 0 | 0.00% | 0.00% | 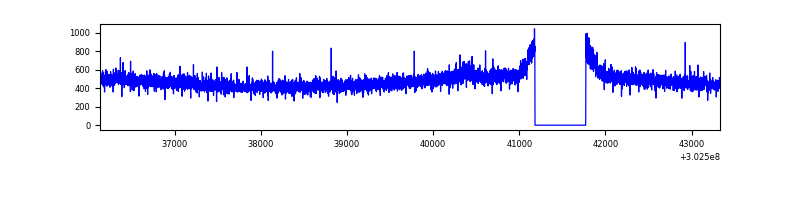 |
| B | 7195 | 6606 | 12 | 12 | 0.17% | 0.18% | 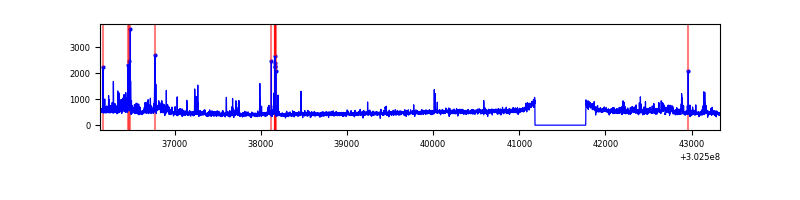 |
| C | 7196 | 6607 | 3 | 3 | 0.04% | 0.05% | 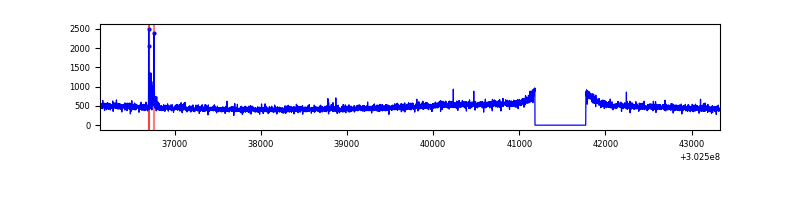 |
| D | 7196 | 6607 | 370 | 370 | 5.14% | 5.60% | 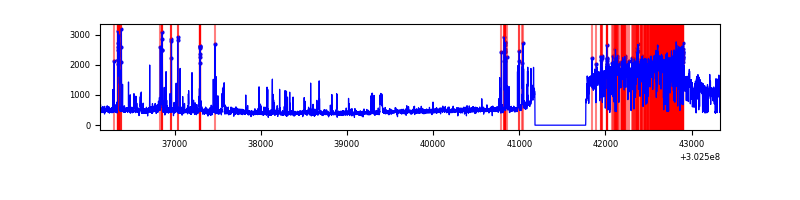 |
Top three noisy pixels from each quadrant. If the there are fewer than three noisy pixels in the level2.evt file, extra rows are filled as -1
| Pixel properties | Quadrant properties | ||||||
|---|---|---|---|---|---|---|---|
| Quadrant | DetID | PixID | Counts | Sigma | Mean | Median | Sigma |
| A | 13 | 252 | 10259 | 57.86 | 814 | 798 | 163.5 |
| A | 0 | 226 | 7152 | 38.86 | 814 | 798 | 163.5 |
| A | 3 | 137 | 6450 | 34.56 | 814 | 798 | 163.5 |
| B | 7 | 220 | 99194 | 644.32 | 800 | 780 | 152.7 |
| B | 0 | 189 | 48169 | 310.26 | 800 | 780 | 152.7 |
| B | 0 | 197 | 45931 | 295.61 | 800 | 780 | 152.7 |
| C | 14 | 238 | 120829 | 670.3 | 768 | 774 | 179.1 |
| C | 9 | 54 | 23736 | 128.2 | 768 | 774 | 179.1 |
| C | 13 | 61 | 5468 | 26.21 | 768 | 774 | 179.1 |
| D | 1 | 20 | 1717476 | 9168.08 | 778 | 757 | 187.2 |
| D | 9 | 1 | 198267 | 1054.8 | 778 | 757 | 187.2 |
| D | 1 | 52 | 91092 | 482.43 | 778 | 757 | 187.2 |
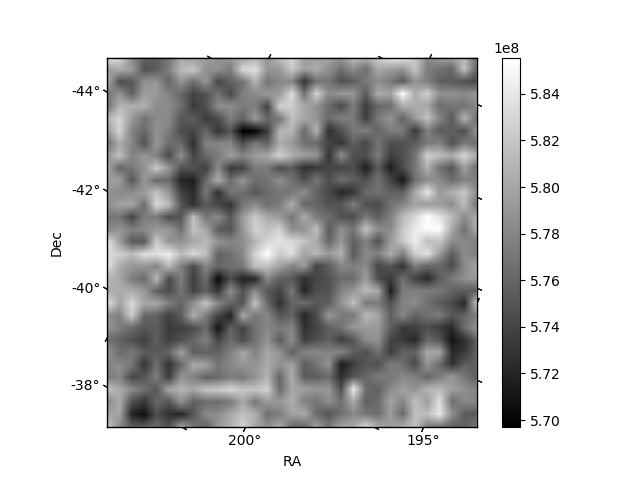
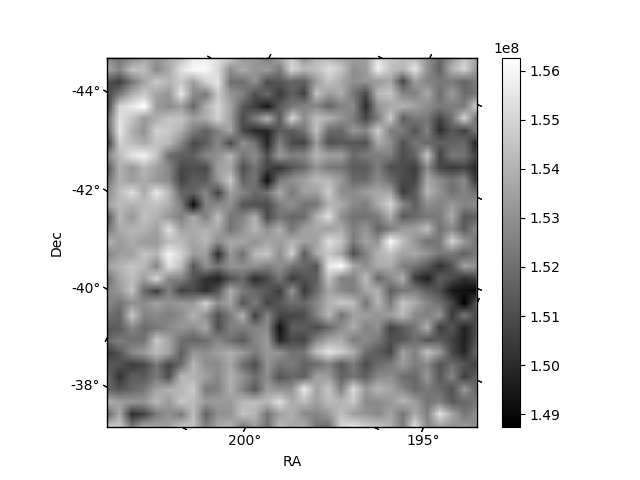
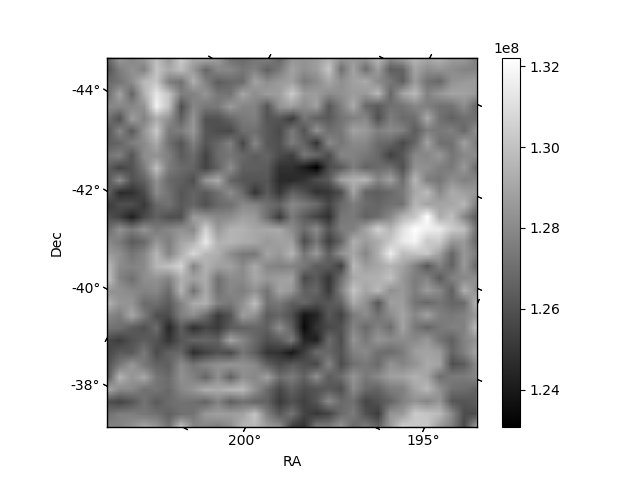
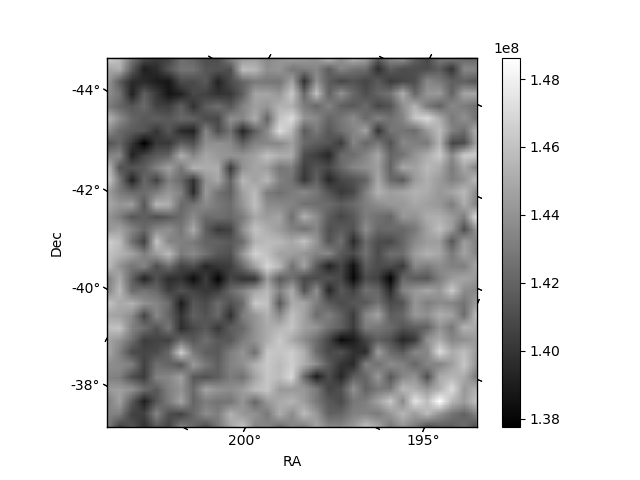
Histogram calculated using DETX and DETY for each event in the final _common_clean file
| Quadrant A | 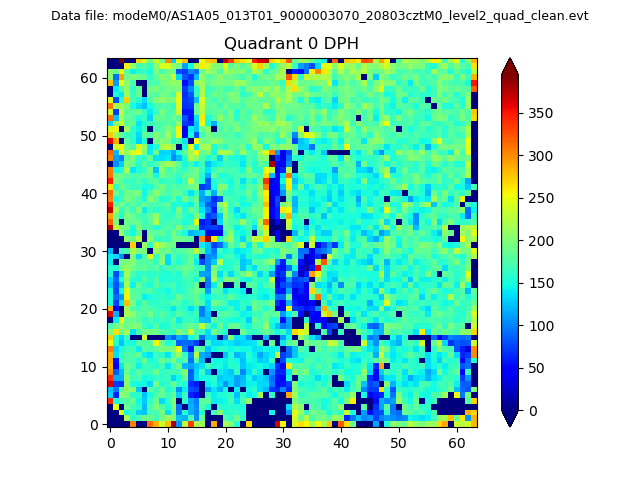 |
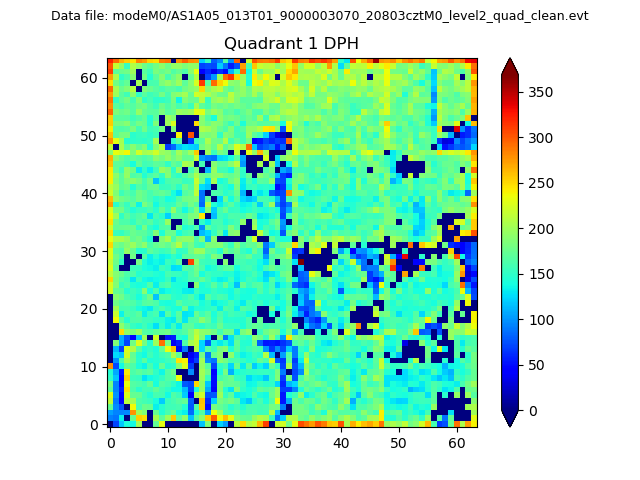 |
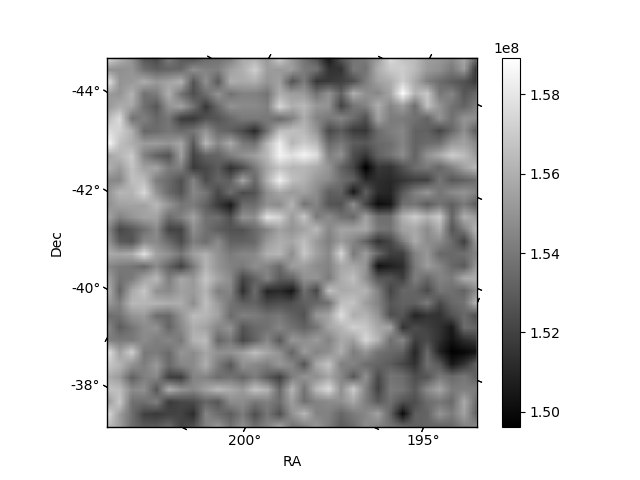
Quadrant B |
|---|---|---|---|
| Quadrant D | 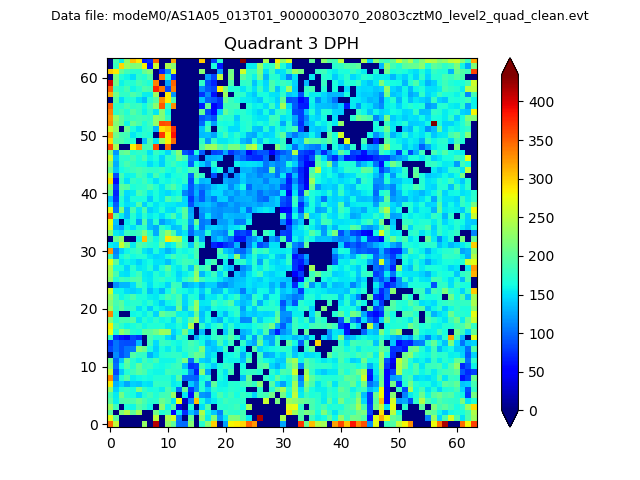 |
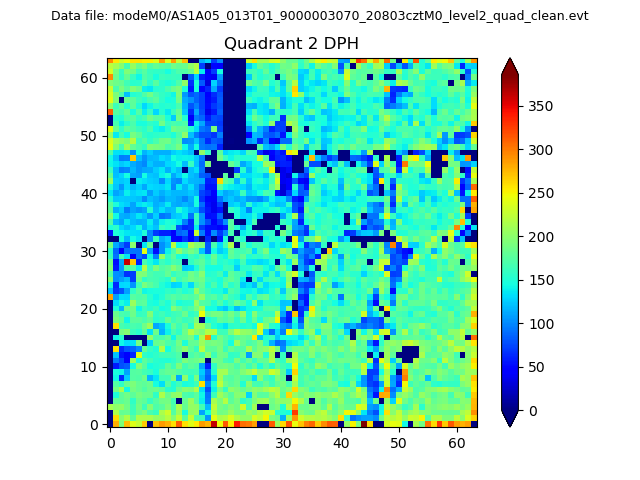 |
Quadrant C |
| Plot type | Count rate plots | Images |
|---|---|---|
| Comparison with Poisson distribution Blue bars denote a histogram of data divided into 1 sec bins. Red curve is a Poisson curve with rate = median count rate of data. |
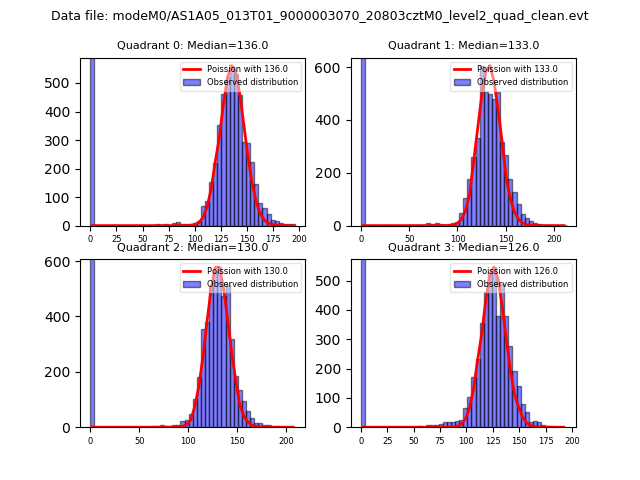 |
 |
| Quadrant-wise count rates Data is divided into 100 sec bins |
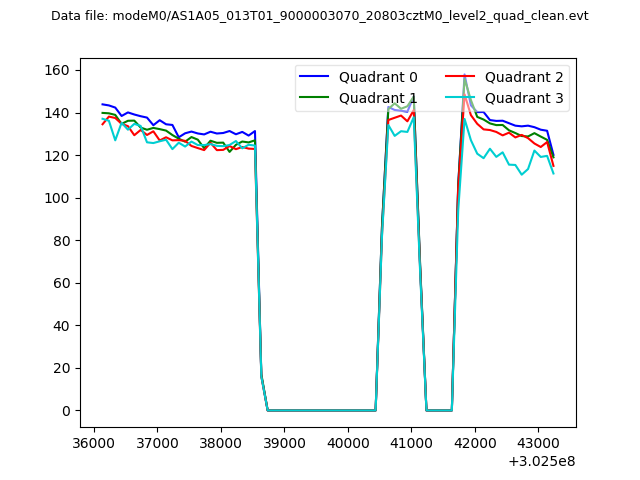 |
|
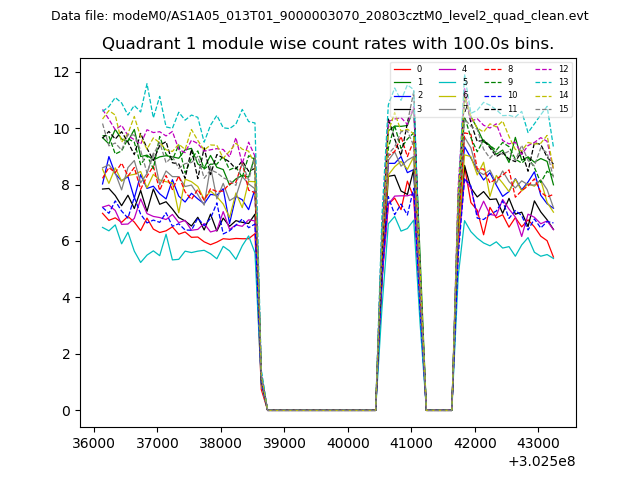
| Module-wise count rates for Quadrant A Data is divided into 100 sec bins |
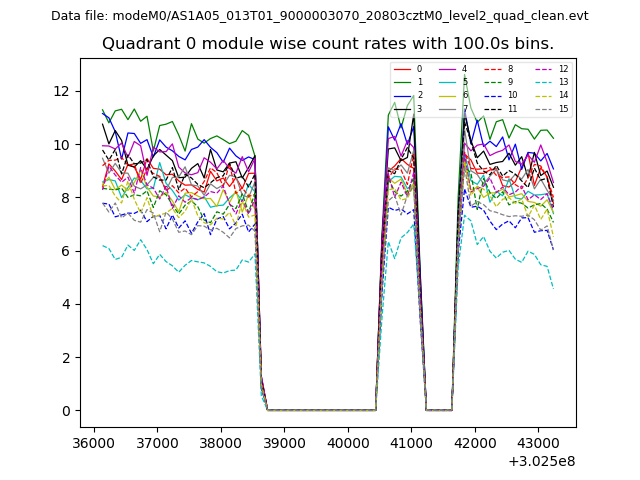 |
 |
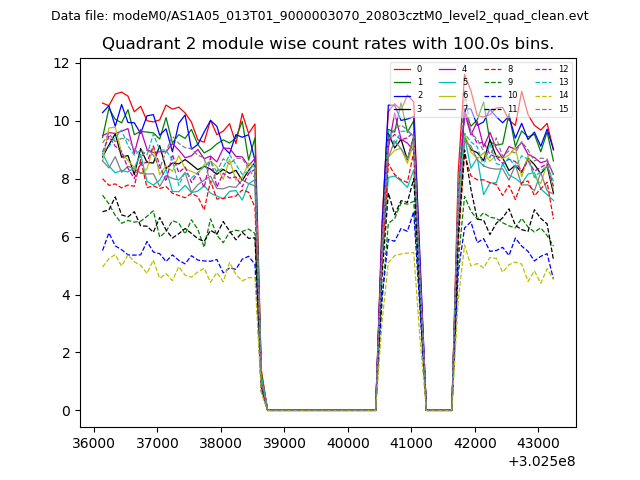
| Module-wise count rates for Quadrant B Data is divided into 100 sec bins |
 |
 |
| Module-wise count rates for Quadrant C Data is divided into 100 sec bins |
 |
 |
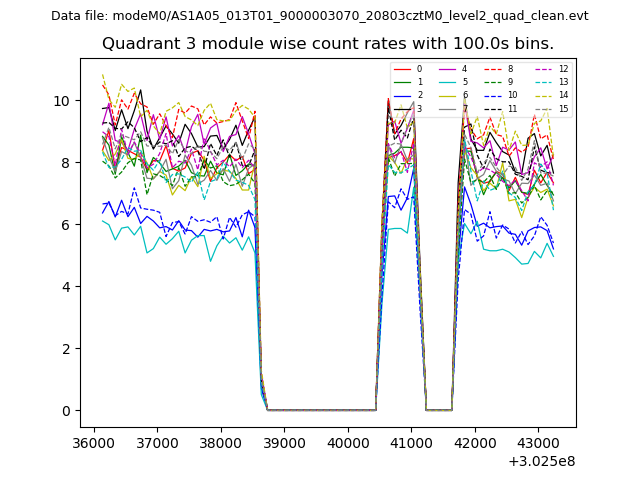
| Module-wise count rates for Quadrant D Data is divided into 100 sec bins |
 |
 |
| Parameter | Plot |
|---|---|
| CZT HV Monitor | 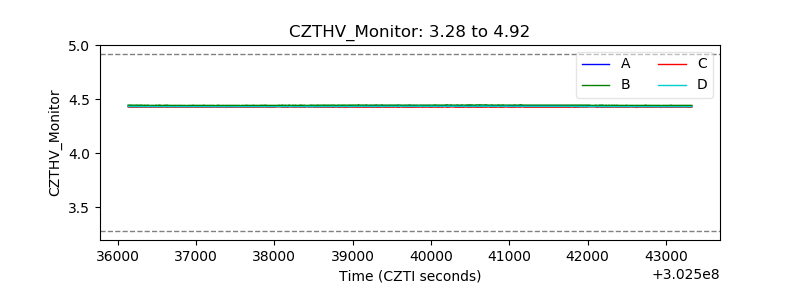 |
| D_VDD | 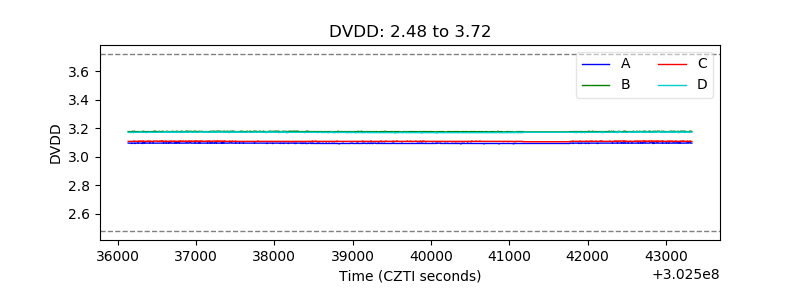 |
| Temperature 1 | 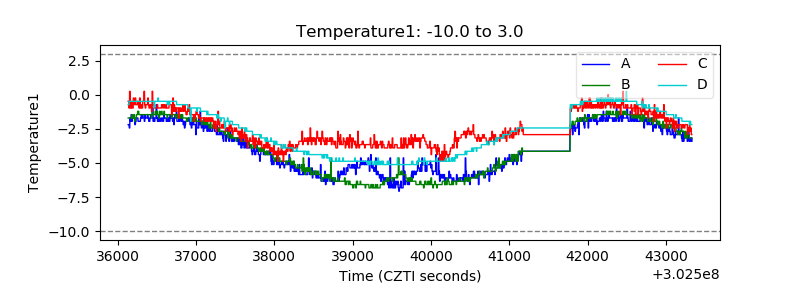 |
| Veto HV Monitor | 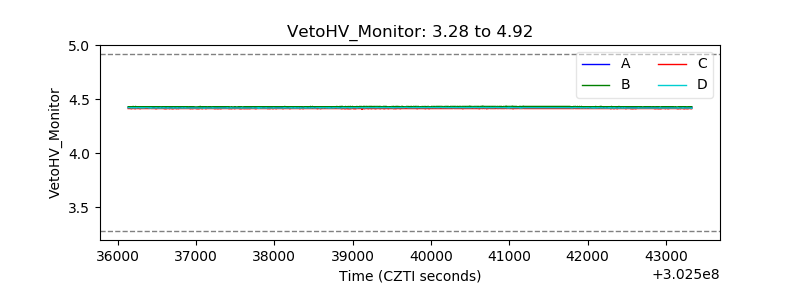 |
| Veto LLD | 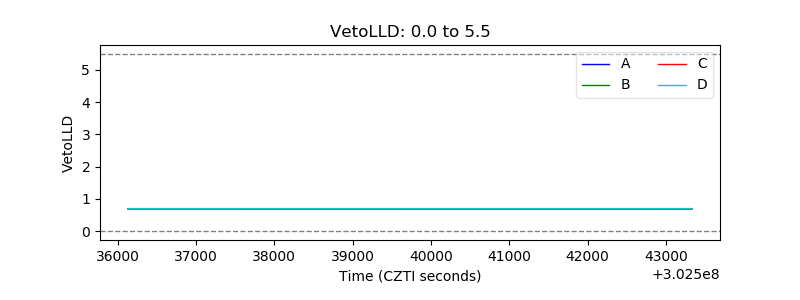 |
| Alpha Counter | 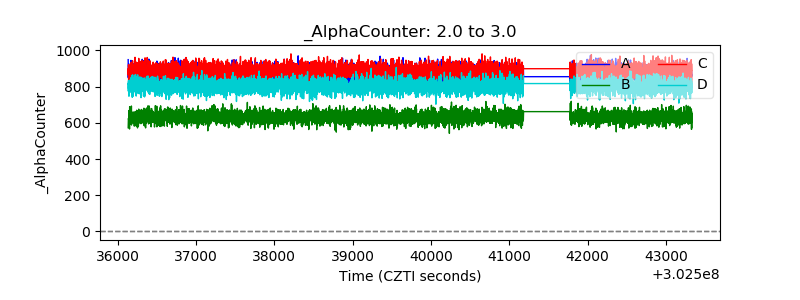 |
| _CPM_Rate | 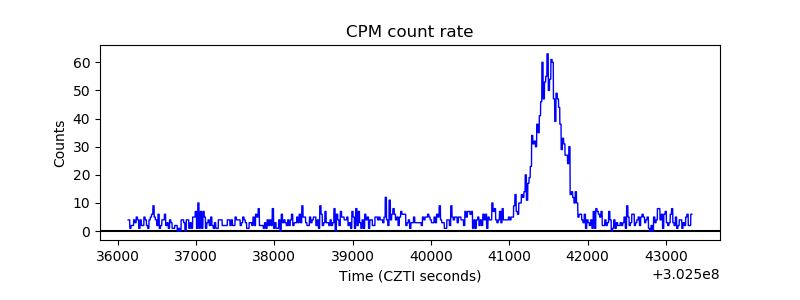 |
| CZT Counter | 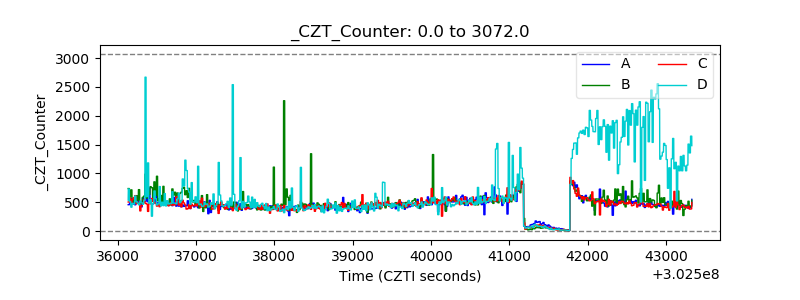 |
| +2.5 Volts monitor |  |
| +5 Volts monitor |  |
| _ROLL_ROT | 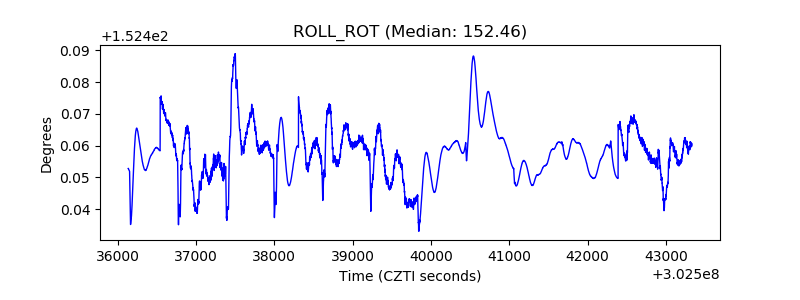 |
| _Roll_DEC | 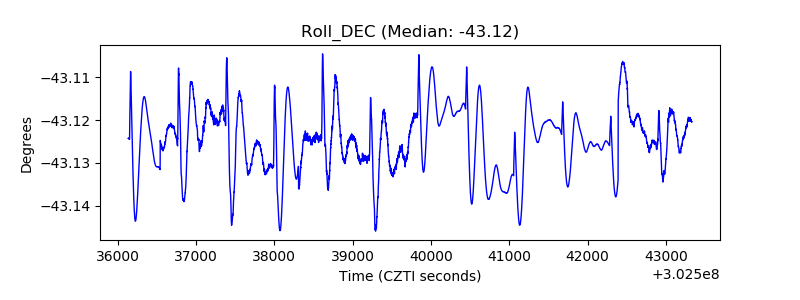 |
| _Roll_RA | 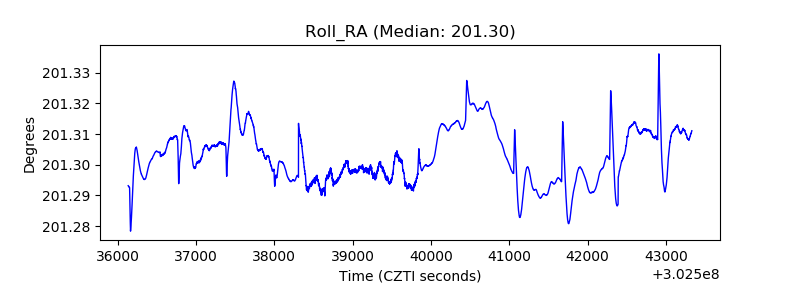 |
| Veto Counter | 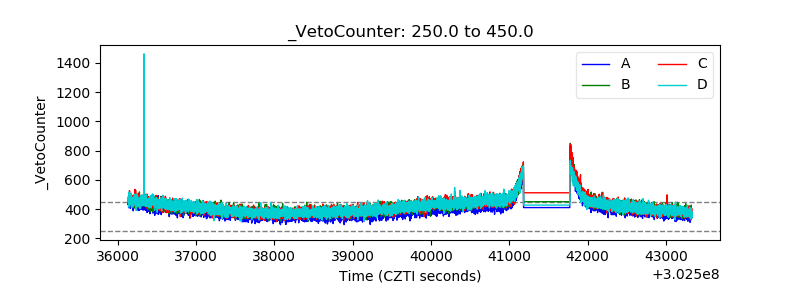 |