| Param | Original file | Final file |
|---|---|---|
| Filename | modeM0/AS1A05_013T01_9000003070_20804cztM0_level2.evt | modeM0/AS1A05_013T01_9000003070_20804cztM0_level2_quad_clean.evt |
| Size (bytes) | 592,505,280 | 100,437,120 |
| Size | 565.1 MB | 95.8 MB |
| Events in quadrant A | 3,225,341 | 660,603 |
| Events in quadrant B | 3,504,918 | 653,417 |
| Events in quadrant C | 3,231,260 | 635,770 |
| Events in quadrant D | 7,516,046 | 611,362 |
| Mode SS | |||
|---|---|---|---|
| Quadrant | BADHDUFLAG | Total packets | Discarded packets |
| A | 0 | 140 | 0 |
| B | 0 | 140 | 0 |
| C | 0 | 140 | 0 |
| D | 0 | 140 | 0 |
| Mode M0 | |||
|---|---|---|---|
| Quadrant | BADHDUFLAG | Total packets | Discarded packets |
| A | 0 | 14179 | 1 |
| B | 0 | 14803 | 1 |
| C | 0 | 14215 | 1 |
| D | 0 | 27077 | 1 |
| Mode M9 | |||
|---|---|---|---|
| Quadrant | BADHDUFLAG | Total packets | Discarded packets |
| A | 0 | 2 | 0 |
| B | 0 | 2 | 0 |
| C | 0 | 2 | 0 |
| D | 0 | 2 | 0 |
| Quadrant | Total seconds | Saturated seconds | Saturation percentage |
|---|---|---|---|
| A | 6895 | 53 | 0.768673% |
| B | 6896 | 100 | 1.450116% |
| C | 6895 | 69 | 1.000725% |
| D | 6895 | 264 | 3.828861% |
Noise dominated data is calculated using 1-second bins in cleaned event files. If a bin has >2000 counts, and if more than 50% of those come from <1% of pixels, then it is considered to be noise-dominated and hence unusable.
| Quadrant | # 1 sec bins | Bins with >0 counts | Bins with >2000 counts | High rate bins dominated by noise | Noise dominated (total time) | Noise dominated (detector-on time) | Marked lightcurve |
|---|---|---|---|---|---|---|---|
| A | 7110 | 6896 | 0 | 0 | 0.00% | 0.00% |  |
| B | 7111 | 6896 | 3 | 3 | 0.04% | 0.04% |  |
| C | 7110 | 6896 | 0 | 0 | 0.00% | 0.00% |  |
| D | 7110 | 6896 | 323 | 323 | 4.54% | 4.68% |  |
Top three noisy pixels from each quadrant. If the there are fewer than three noisy pixels in the level2.evt file, extra rows are filled as -1
| Pixel properties | Quadrant properties | ||||||
|---|---|---|---|---|---|---|---|
| Quadrant | DetID | PixID | Counts | Sigma | Mean | Median | Sigma |
| A | 0 | 226 | 7336 | 38.34 | 839 | 818 | 170.0 |
| A | 3 | 137 | 6779 | 35.06 | 839 | 818 | 170.0 |
| A | 12 | 194 | 6065 | 30.86 | 839 | 818 | 170.0 |
| B | 0 | 189 | 73169 | 460.42 | 826 | 804 | 157.2 |
| B | 0 | 182 | 35599 | 221.38 | 826 | 804 | 157.2 |
| B | 0 | 190 | 29184 | 180.57 | 826 | 804 | 157.2 |
| C | 14 | 238 | 124425 | 665.59 | 792 | 797 | 185.7 |
| C | 3 | 233 | 14107 | 71.66 | 792 | 797 | 185.7 |
| C | 13 | 61 | 5629 | 26.01 | 792 | 797 | 185.7 |
| D | 1 | 20 | 4153481 | 21183.62 | 803 | 781 | 196.0 |
| D | 9 | 1 | 81325 | 410.87 | 803 | 781 | 196.0 |
| D | 13 | 153 | 66188 | 333.65 | 803 | 781 | 196.0 |
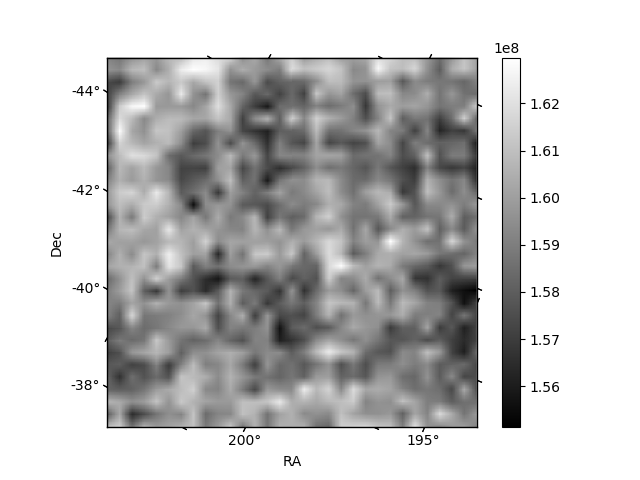
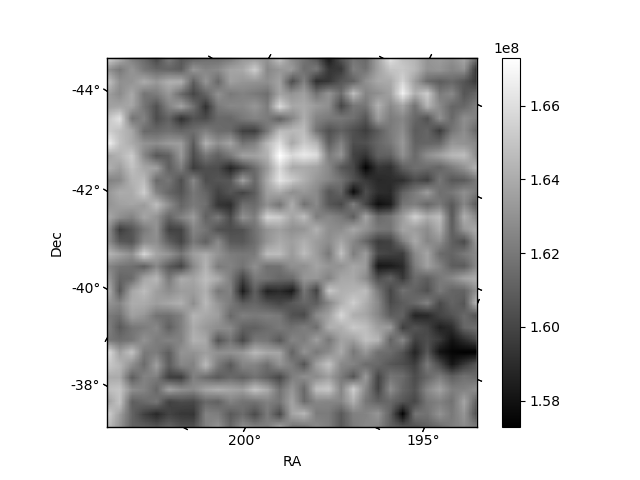
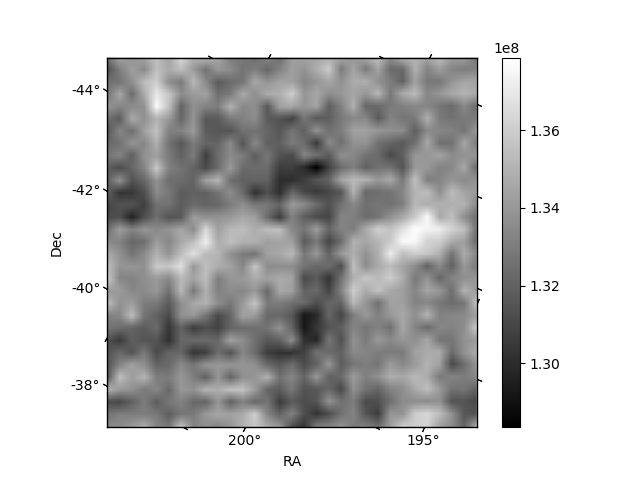
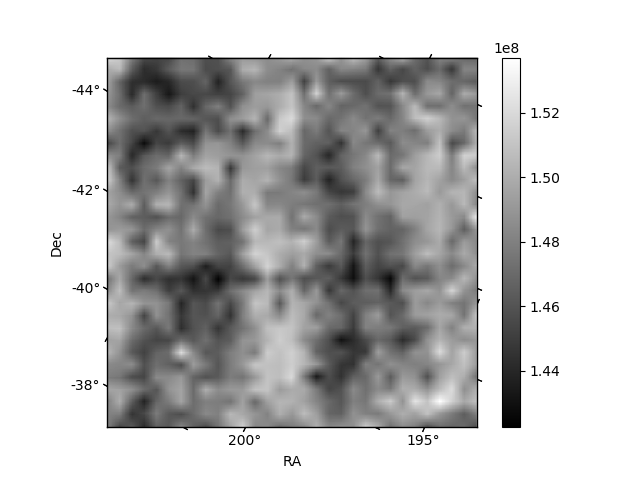
Histogram calculated using DETX and DETY for each event in the final _common_clean file
| Quadrant A | 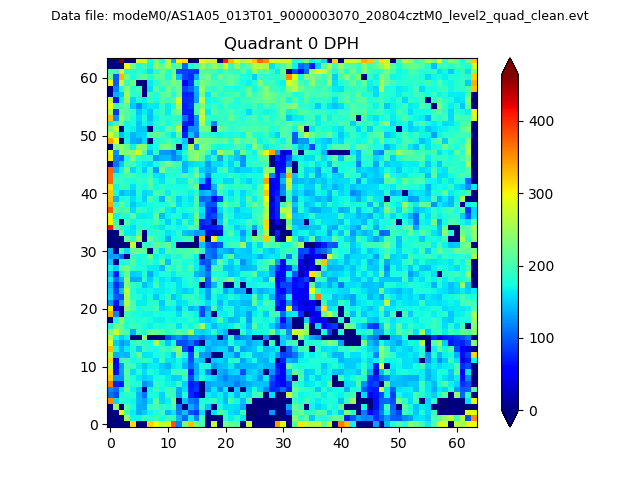 |
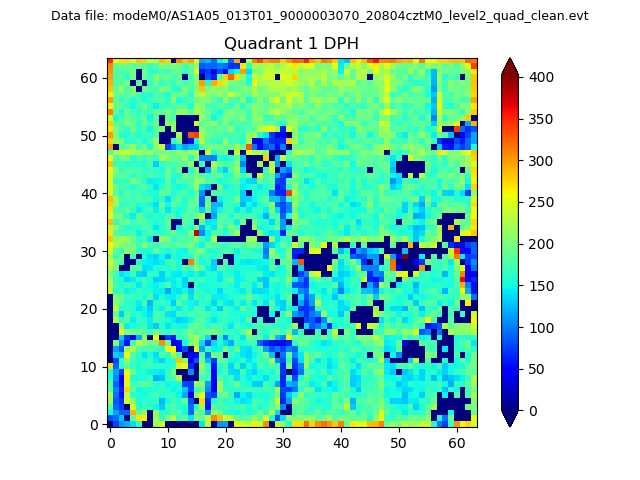 |
Quadrant B |
|---|---|---|---|
| Quadrant D | 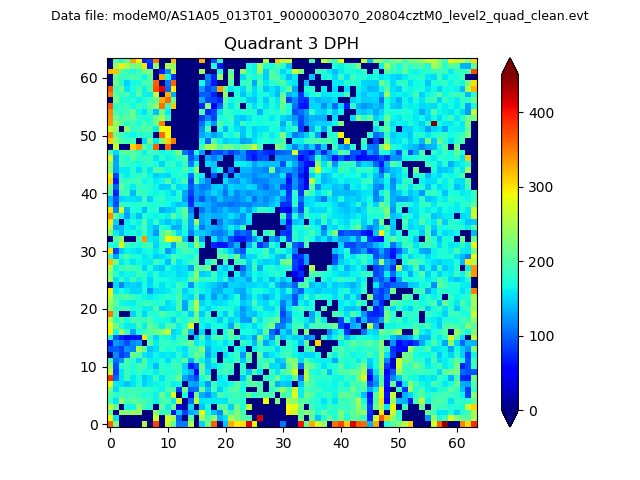 |
 |
Quadrant C |
| Plot type | Count rate plots | Images |
|---|---|---|
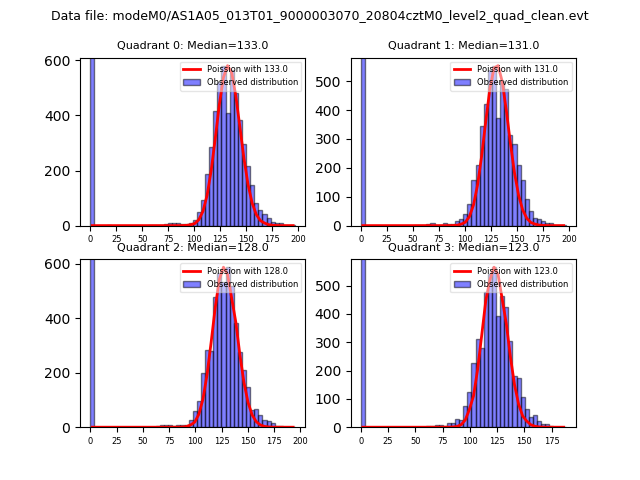
| Comparison with Poisson distribution Blue bars denote a histogram of data divided into 1 sec bins. Red curve is a Poisson curve with rate = median count rate of data. |
 |
 |
| Quadrant-wise count rates Data is divided into 100 sec bins |
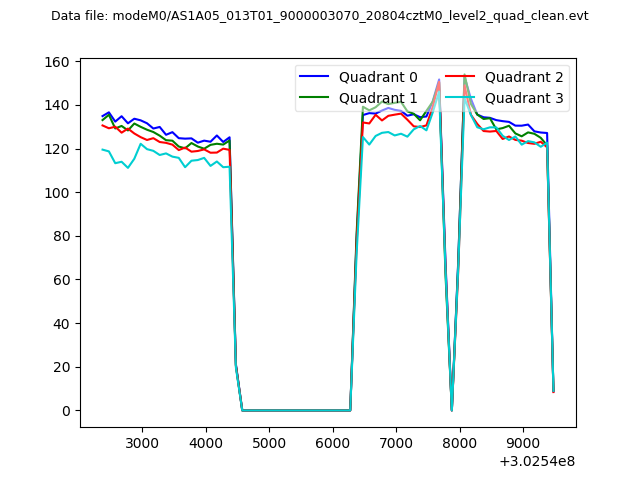 |
|
| Module-wise count rates for Quadrant A Data is divided into 100 sec bins |
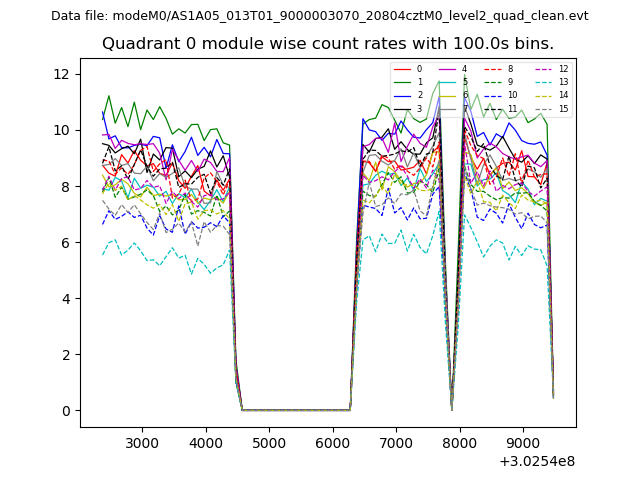 |
 |
| Module-wise count rates for Quadrant B Data is divided into 100 sec bins |
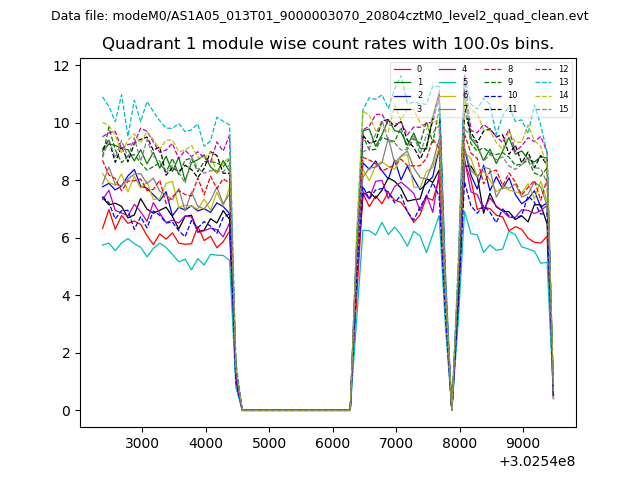 |
 |
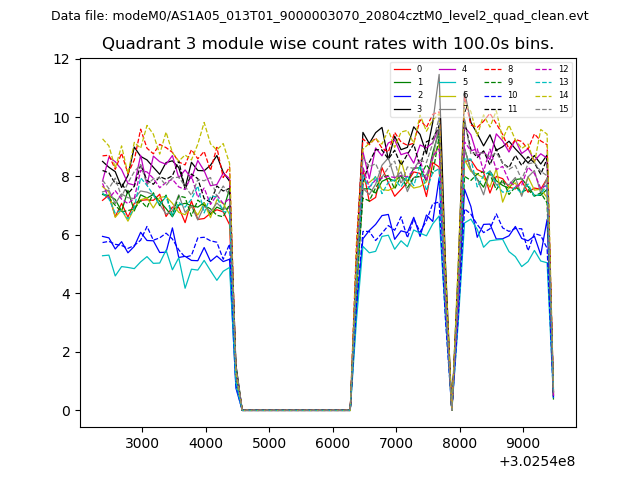
| Module-wise count rates for Quadrant C Data is divided into 100 sec bins |
 |
 |
| Module-wise count rates for Quadrant D Data is divided into 100 sec bins |
 |
 |
| Parameter | Plot |
|---|---|
| CZT HV Monitor | 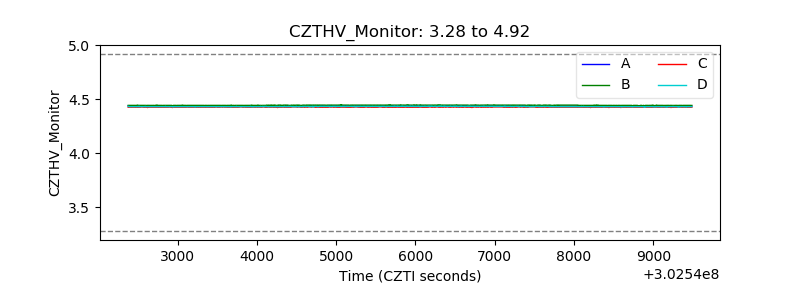 |
| D_VDD | 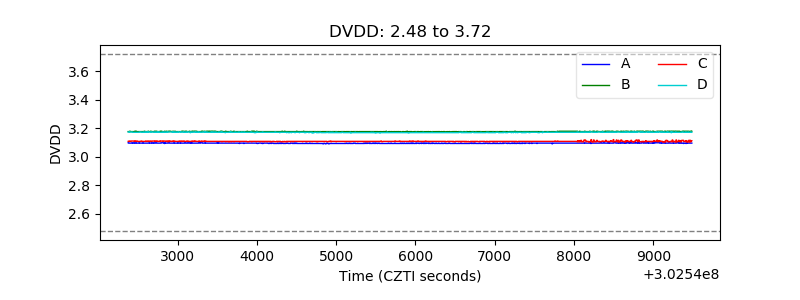 |
| Temperature 1 | 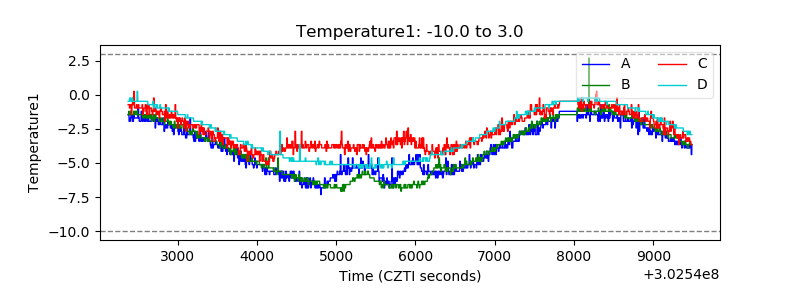 |
| Veto HV Monitor | 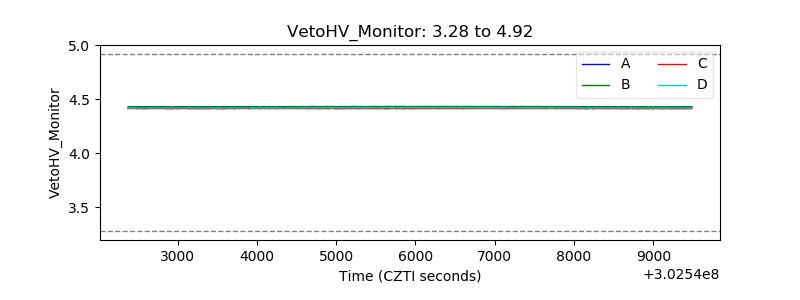 |
| Veto LLD | 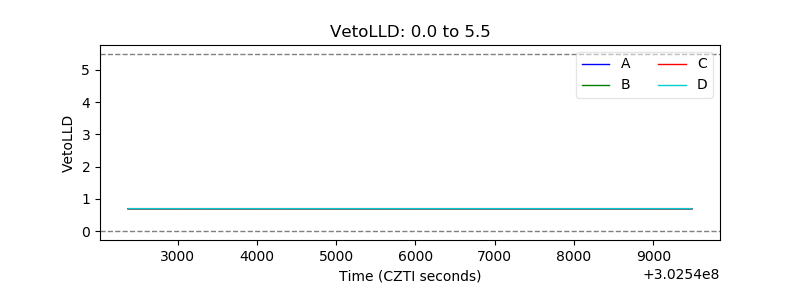 |
| Alpha Counter | 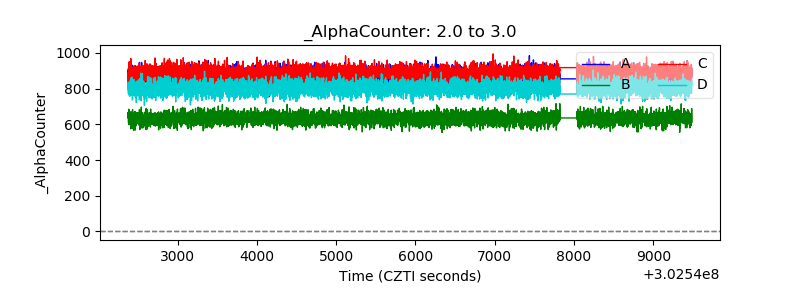 |
| _CPM_Rate | 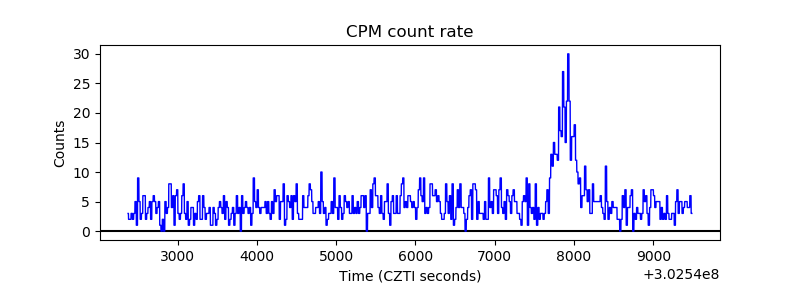 |
| CZT Counter |  |
| +2.5 Volts monitor | 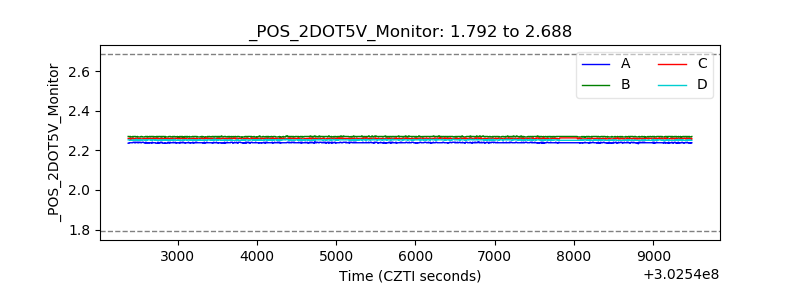 |
| +5 Volts monitor |  |
| _ROLL_ROT | 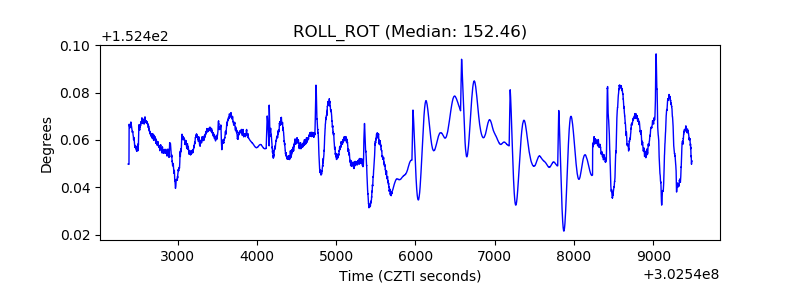 |
| _Roll_DEC | 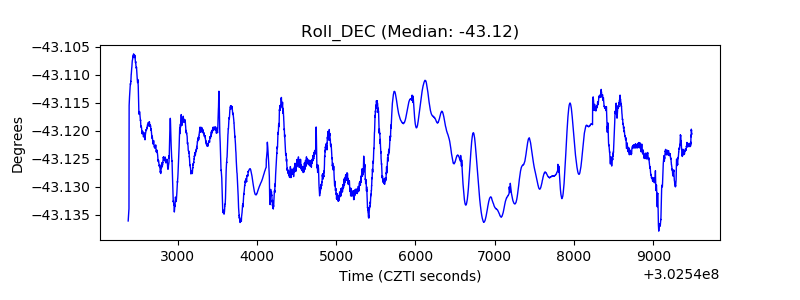 |
| _Roll_RA | 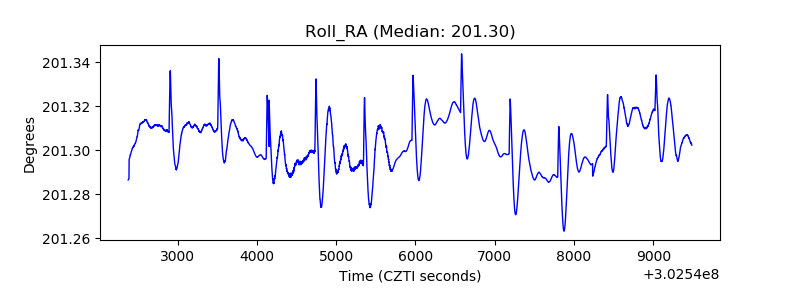 |
| Veto Counter | 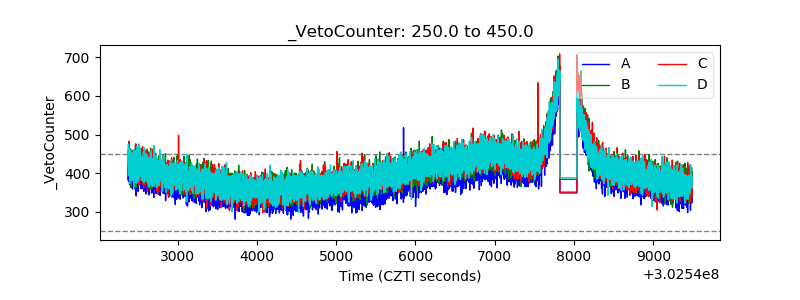 |