| Param | Original file | Final file |
|---|---|---|
| Filename | modeM0/AS1A05_013T01_9000003070_20805cztM0_level2.evt | modeM0/AS1A05_013T01_9000003070_20805cztM0_level2_quad_clean.evt |
| Size (bytes) | 524,986,560 | 109,036,800 |
| Size | 500.7 MB | 104.0 MB |
| Events in quadrant A | 3,429,026 | 721,081 |
| Events in quadrant B | 4,213,328 | 691,302 |
| Events in quadrant C | 3,474,499 | 690,523 |
| Events in quadrant D | 4,279,594 | 683,689 |
| Mode SS | |||
|---|---|---|---|
| Quadrant | BADHDUFLAG | Total packets | Discarded packets |
| A | 0 | 150 | 0 |
| B | 0 | 150 | 0 |
| C | 0 | 150 | 0 |
| D | 0 | 150 | 0 |
| Mode M0 | |||
|---|---|---|---|
| Quadrant | BADHDUFLAG | Total packets | Discarded packets |
| A | 0 | 15138 | 1 |
| B | 0 | 17324 | 1 |
| C | 0 | 15196 | 1 |
| D | 0 | 17772 | 1 |
| Mode M9 | |||
|---|---|---|---|
| Quadrant | BADHDUFLAG | Total packets | Discarded packets |
| A | 0 | 3 | 0 |
| B | 0 | 3 | 0 |
| C | 0 | 3 | 0 |
| D | 0 | 3 | 0 |
| Quadrant | Total seconds | Saturated seconds | Saturation percentage |
|---|---|---|---|
| A | 7407 | 58 | 0.783043% |
| B | 7407 | 329 | 4.441744% |
| C | 7408 | 62 | 0.836933% |
| D | 7408 | 99 | 1.336393% |
Noise dominated data is calculated using 1-second bins in cleaned event files. If a bin has >2000 counts, and if more than 50% of those come from <1% of pixels, then it is considered to be noise-dominated and hence unusable.
| Quadrant | # 1 sec bins | Bins with >0 counts | Bins with >2000 counts | High rate bins dominated by noise | Noise dominated (total time) | Noise dominated (detector-on time) | Marked lightcurve |
|---|---|---|---|---|---|---|---|
| A | 7647 | 7407 | 0 | 0 | 0.00% | 0.00% | 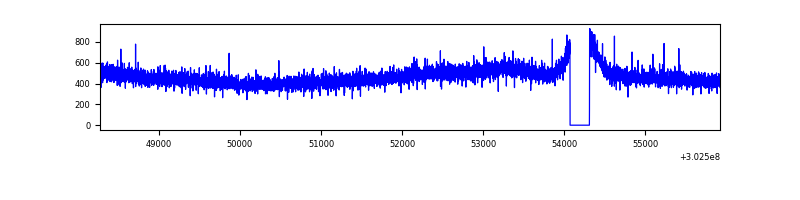 |
| B | 7647 | 7407 | 230 | 230 | 3.01% | 3.11% | 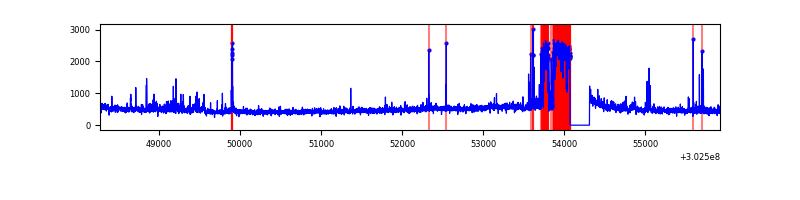 |
| C | 7648 | 7409 | 0 | 0 | 0.00% | 0.00% | 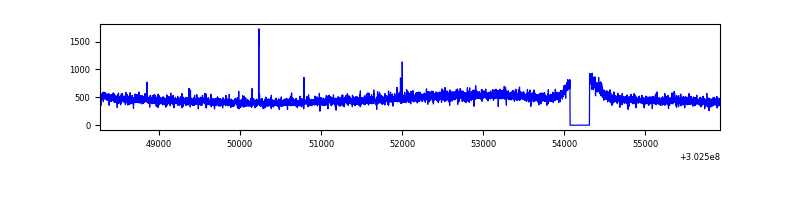 |
| D | 7648 | 7409 | 50 | 50 | 0.65% | 0.67% | 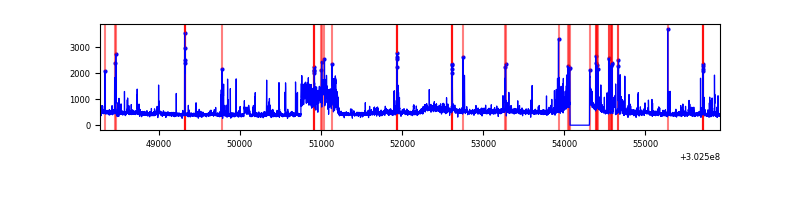 |
Top three noisy pixels from each quadrant. If the there are fewer than three noisy pixels in the level2.evt file, extra rows are filled as -1
| Pixel properties | Quadrant properties | ||||||
|---|---|---|---|---|---|---|---|
| Quadrant | DetID | PixID | Counts | Sigma | Mean | Median | Sigma |
| A | 0 | 226 | 7779 | 38.06 | 892 | 869 | 181.6 |
| A | 3 | 137 | 7025 | 33.9 | 892 | 869 | 181.6 |
| A | 12 | 194 | 6455 | 30.76 | 892 | 869 | 181.6 |
| B | 0 | 182 | 533639 | 3267.06 | 860 | 840 | 163.1 |
| B | 7 | 220 | 114841 | 699.04 | 860 | 840 | 163.1 |
| B | 0 | 189 | 53630 | 323.7 | 860 | 840 | 163.1 |
| C | 14 | 238 | 131629 | 662.96 | 840 | 845 | 197.3 |
| C | 3 | 233 | 21017 | 102.25 | 840 | 845 | 197.3 |
| C | 7 | 247 | 14341 | 68.41 | 840 | 845 | 197.3 |
| D | 1 | 20 | 361255 | 1736.95 | 856 | 832 | 207.5 |
| D | 9 | 1 | 255441 | 1227.01 | 856 | 832 | 207.5 |
| D | 1 | 52 | 125904 | 602.75 | 856 | 832 | 207.5 |
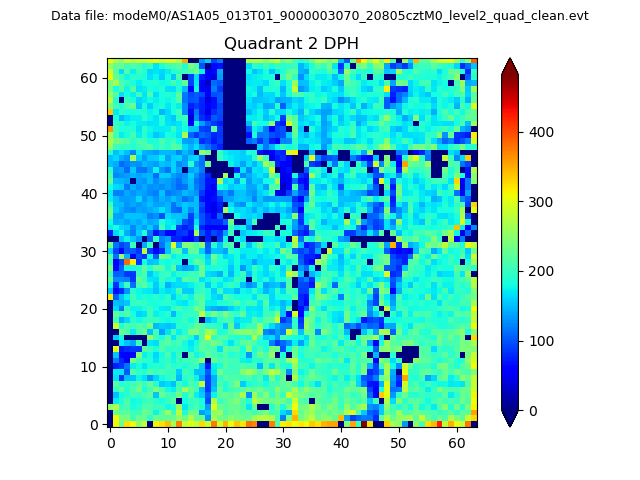
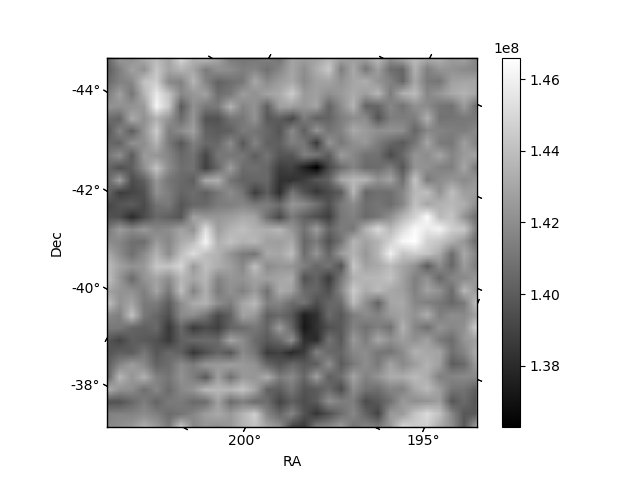
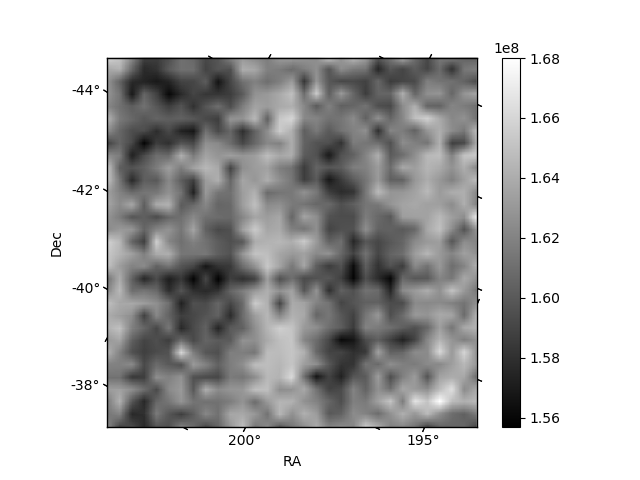
Histogram calculated using DETX and DETY for each event in the final _common_clean file
| Quadrant A | 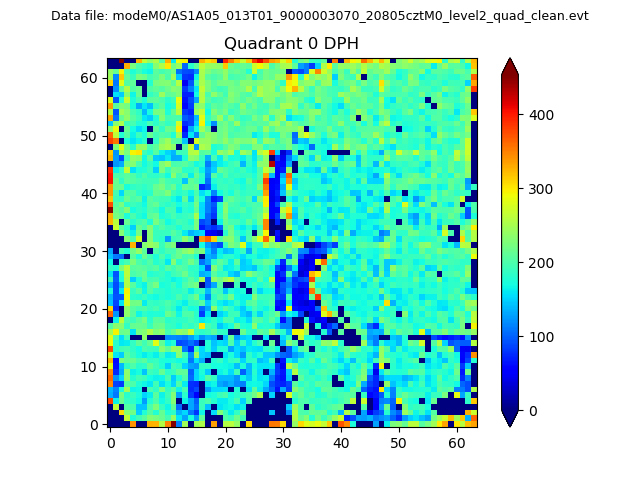 |
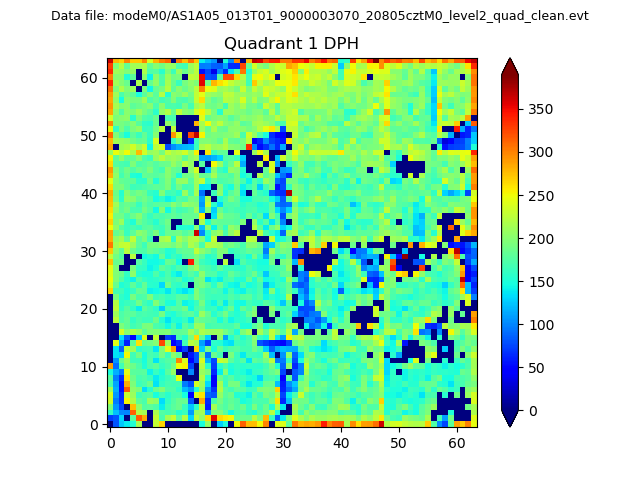 |
Quadrant B |
|---|---|---|---|
| Quadrant D | 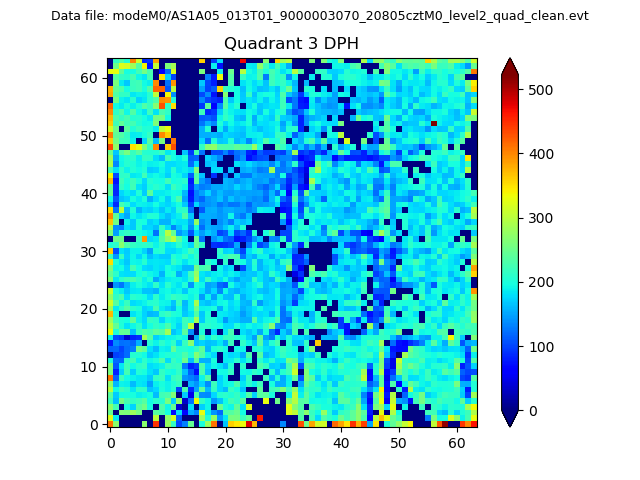 |
 |
Quadrant C |
| Plot type | Count rate plots | Images |
|---|---|---|
| Comparison with Poisson distribution Blue bars denote a histogram of data divided into 1 sec bins. Red curve is a Poisson curve with rate = median count rate of data. |
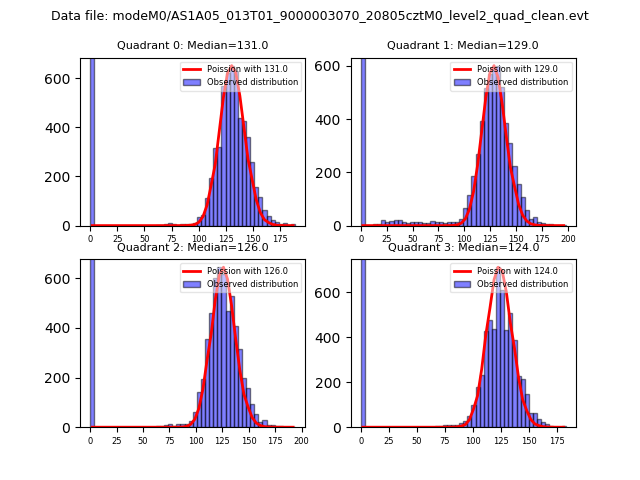 |
 |
| Quadrant-wise count rates Data is divided into 100 sec bins |
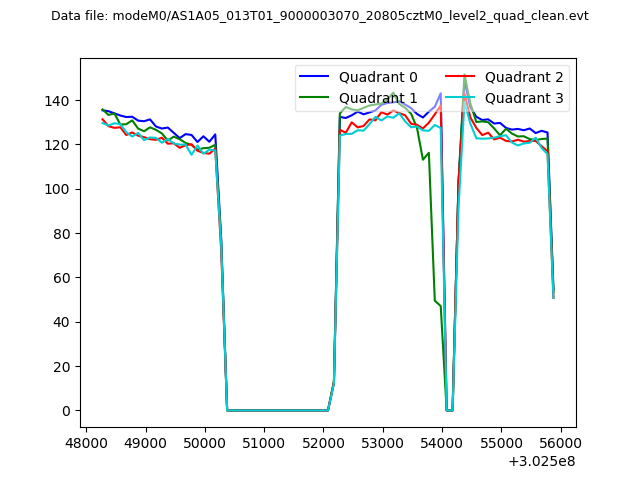 |
|
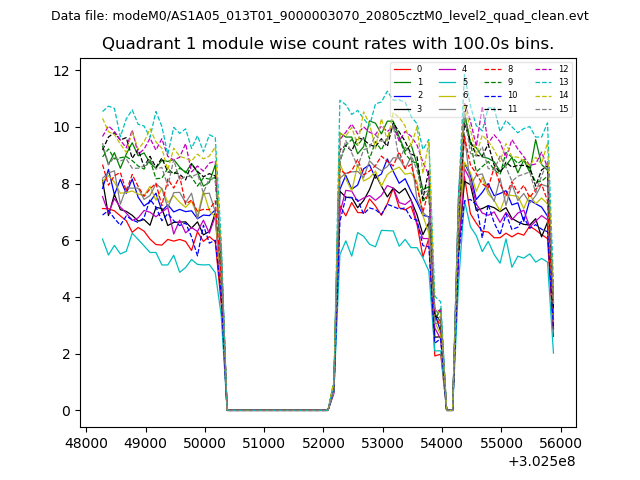
| Module-wise count rates for Quadrant A Data is divided into 100 sec bins |
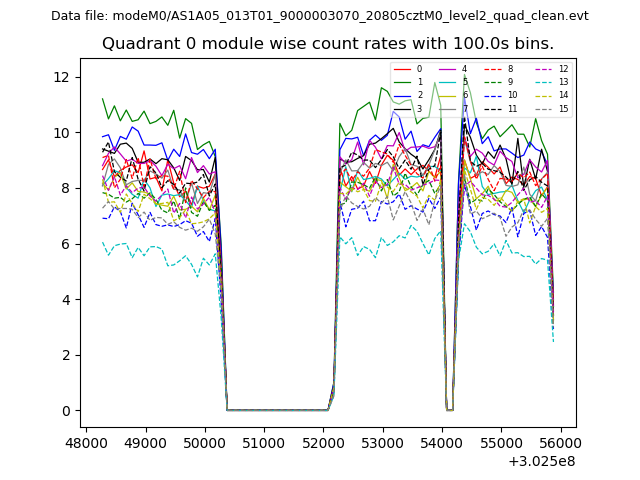 |
 |
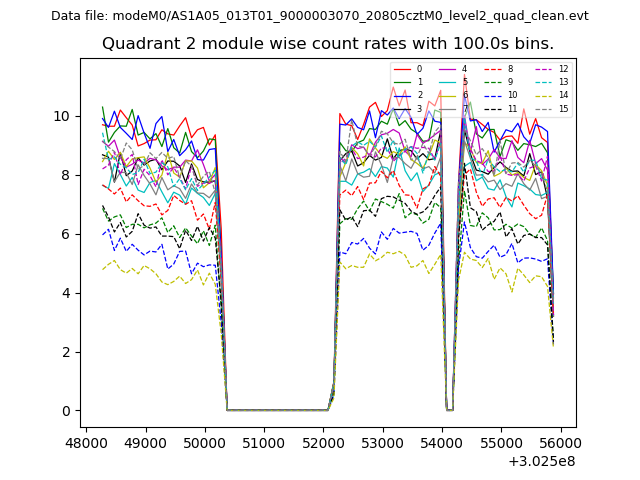
| Module-wise count rates for Quadrant B Data is divided into 100 sec bins |
 |
 |
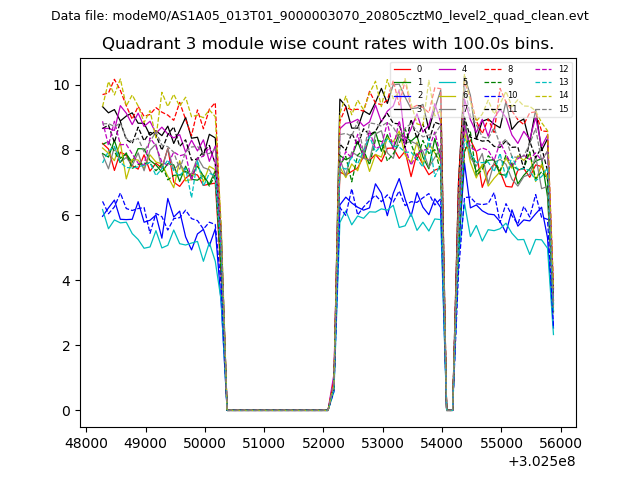
| Module-wise count rates for Quadrant C Data is divided into 100 sec bins |
 |
 |
| Module-wise count rates for Quadrant D Data is divided into 100 sec bins |
 |
 |
| Parameter | Plot |
|---|---|
| CZT HV Monitor | 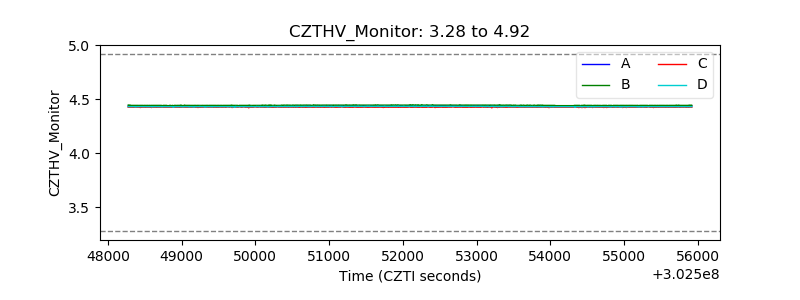 |
| D_VDD | 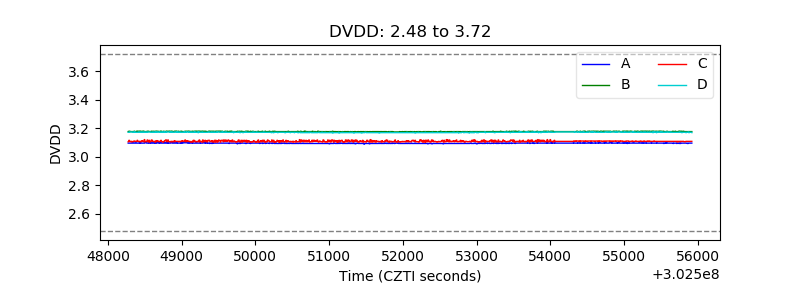 |
| Temperature 1 |  |
| Veto HV Monitor | 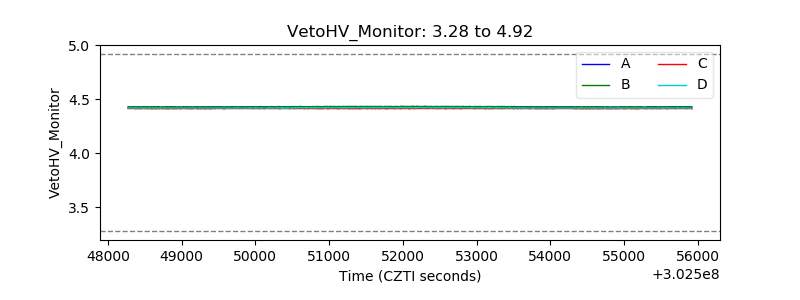 |
| Veto LLD | 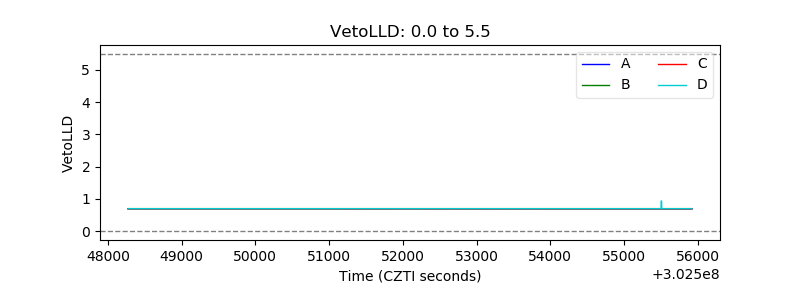 |
| Alpha Counter | 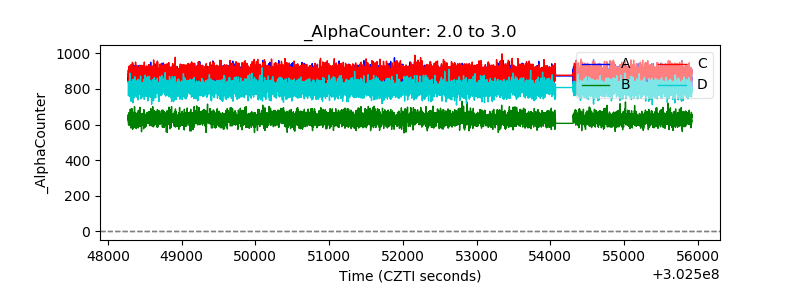 |
| _CPM_Rate | 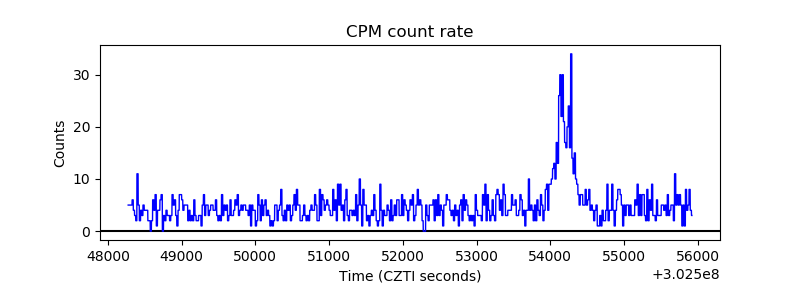 |
| CZT Counter |  |
| +2.5 Volts monitor |  |
| +5 Volts monitor |  |
| _ROLL_ROT | 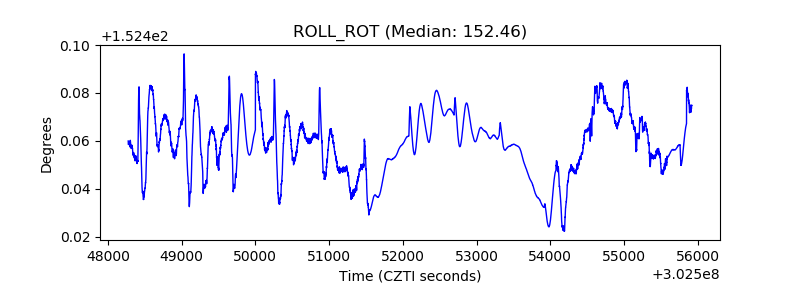 |
| _Roll_DEC | 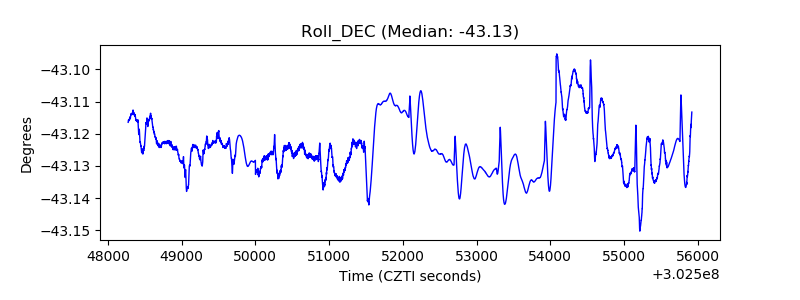 |
| _Roll_RA |  |
| Veto Counter | 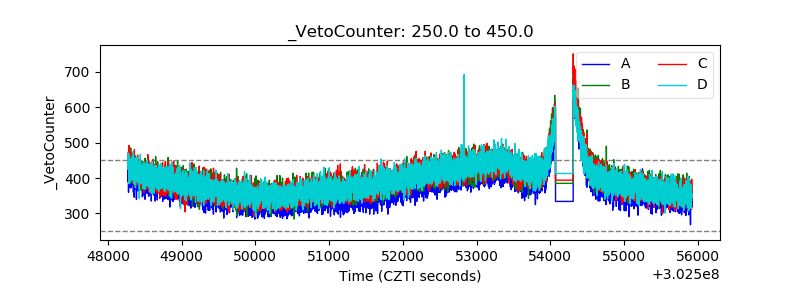 |