| Param | Original file | Final file |
|---|---|---|
| Filename | modeM0/AS1A05_013T01_9000003070_20808cztM0_level2.evt | modeM0/AS1A05_013T01_9000003070_20808cztM0_level2_quad_clean.evt |
| Size (bytes) | 1,313,317,440 | 237,476,160 |
| Size | 1.2 GB | 226.5 MB |
| Events in quadrant A | 8,559,703 | 1,520,520 |
| Events in quadrant B | 9,400,914 | 1,507,629 |
| Events in quadrant C | 8,565,571 | 1,468,119 |
| Events in quadrant D | 11,999,455 | 1,423,240 |
| Mode SS | |||
|---|---|---|---|
| Quadrant | BADHDUFLAG | Total packets | Discarded packets |
| A | 0 | 374 | 0 |
| B | 0 | 374 | 0 |
| C | 0 | 374 | 0 |
| D | 0 | 374 | 0 |
| Mode M0 | |||
|---|---|---|---|
| Quadrant | BADHDUFLAG | Total packets | Discarded packets |
| A | 0 | 37695 | 3 |
| B | 0 | 39905 | 3 |
| C | 0 | 37573 | 3 |
| D | 0 | 48219 | 3 |
| Mode M9 | |||
|---|---|---|---|
| Quadrant | BADHDUFLAG | Total packets | Discarded packets |
| A | 0 | 20 | 0 |
| B | 0 | 20 | 0 |
| C | 0 | 20 | 0 |
| D | 0 | 20 | 0 |
| Quadrant | Total seconds | Saturated seconds | Saturation percentage |
|---|---|---|---|
| A | 18478 | 80 | 0.432947% |
| B | 18479 | 173 | 0.936198% |
| C | 18479 | 143 | 0.773851% |
| D | 18479 | 632 | 3.420098% |
Noise dominated data is calculated using 1-second bins in cleaned event files. If a bin has >2000 counts, and if more than 50% of those come from <1% of pixels, then it is considered to be noise-dominated and hence unusable.
| Quadrant | # 1 sec bins | Bins with >0 counts | Bins with >2000 counts | High rate bins dominated by noise | Noise dominated (total time) | Noise dominated (detector-on time) | Marked lightcurve |
|---|---|---|---|---|---|---|---|
| A | 20403 | 18479 | 7 | 7 | 0.03% | 0.04% | 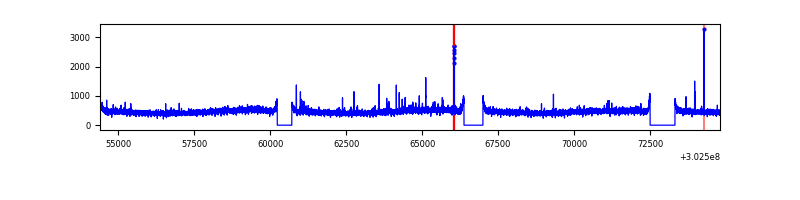 |
| B | 20404 | 18480 | 37 | 37 | 0.18% | 0.20% | 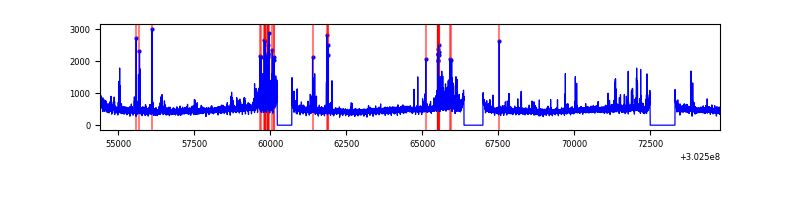 |
| C | 20404 | 18480 | 1 | 1 | 0.00% | 0.01% | 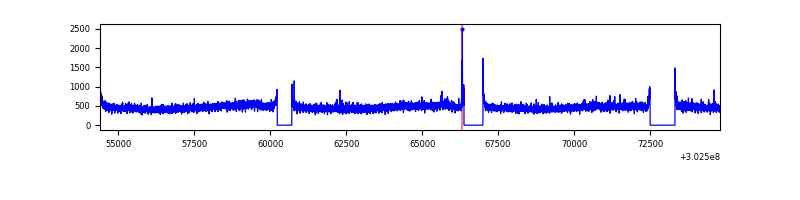 |
| D | 20404 | 18480 | 585 | 585 | 2.87% | 3.17% | 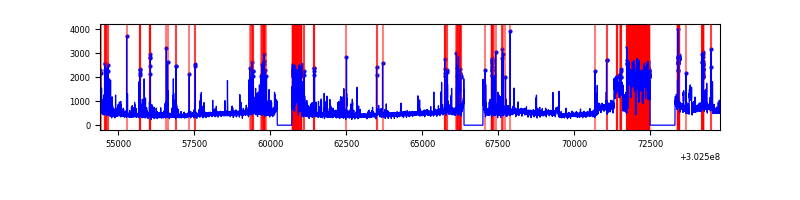 |
Top three noisy pixels from each quadrant. If the there are fewer than three noisy pixels in the level2.evt file, extra rows are filled as -1
| Pixel properties | Quadrant properties | ||||||
|---|---|---|---|---|---|---|---|
| Quadrant | DetID | PixID | Counts | Sigma | Mean | Median | Sigma |
| A | 12 | 96 | 79572 | 175.39 | 2203 | 2155 | 441.4 |
| A | 0 | 226 | 19057 | 38.29 | 2203 | 2155 | 441.4 |
| A | 3 | 137 | 17980 | 35.85 | 2203 | 2155 | 441.4 |
| B | 7 | 220 | 374376 | 909.02 | 2180 | 2124 | 409.5 |
| B | 0 | 189 | 160853 | 387.61 | 2180 | 2124 | 409.5 |
| B | 4 | 216 | 80725 | 191.94 | 2180 | 2124 | 409.5 |
| C | 14 | 238 | 329609 | 672.59 | 2094 | 2104 | 486.9 |
| C | 9 | 54 | 43232 | 84.46 | 2094 | 2104 | 486.9 |
| C | 3 | 233 | 17912 | 32.46 | 2094 | 2104 | 486.9 |
| D | 1 | 20 | 2365123 | 4623.17 | 2114 | 2051 | 511.1 |
| D | 7 | 38 | 409042 | 796.25 | 2114 | 2051 | 511.1 |
| D | 9 | 1 | 336642 | 654.6 | 2114 | 2051 | 511.1 |
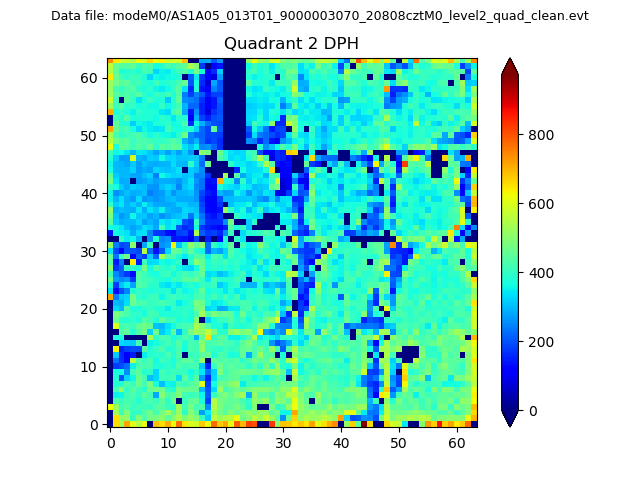
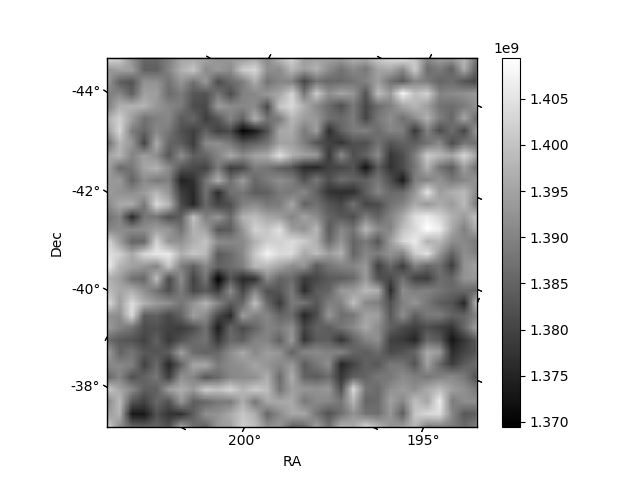
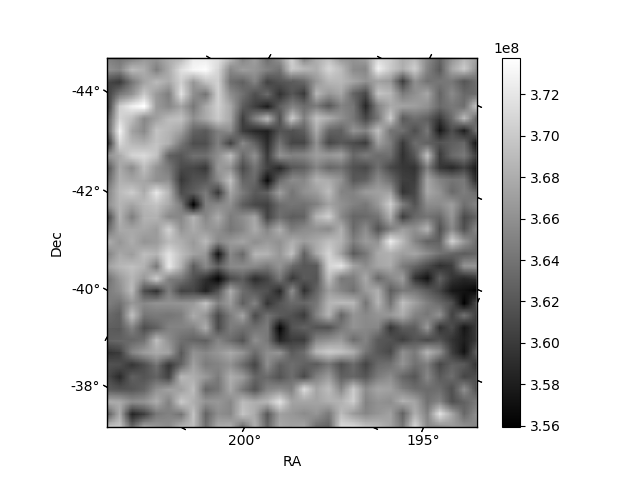
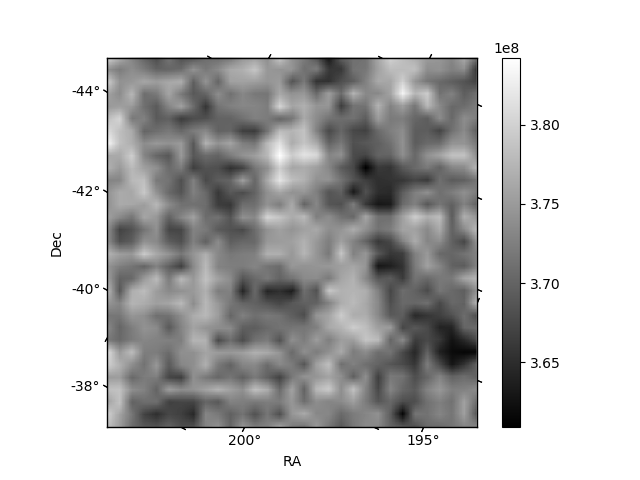
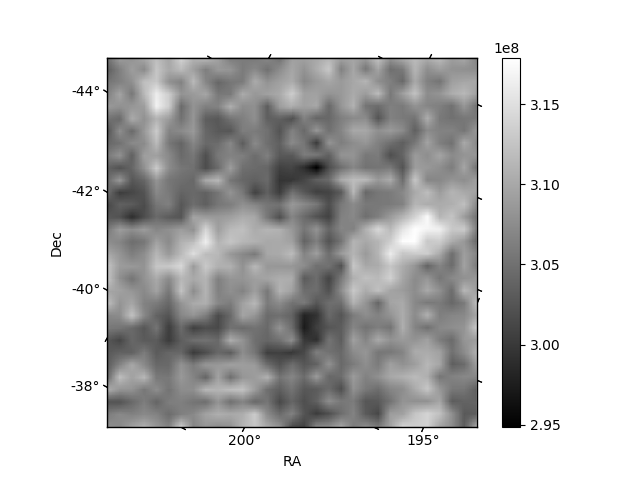
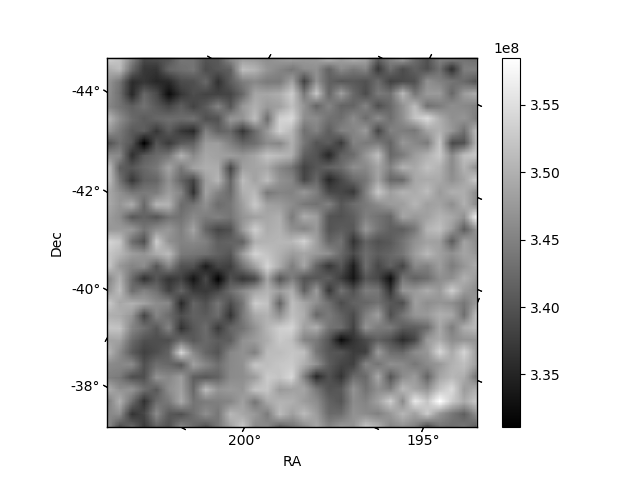
Histogram calculated using DETX and DETY for each event in the final _common_clean file
| Quadrant A | 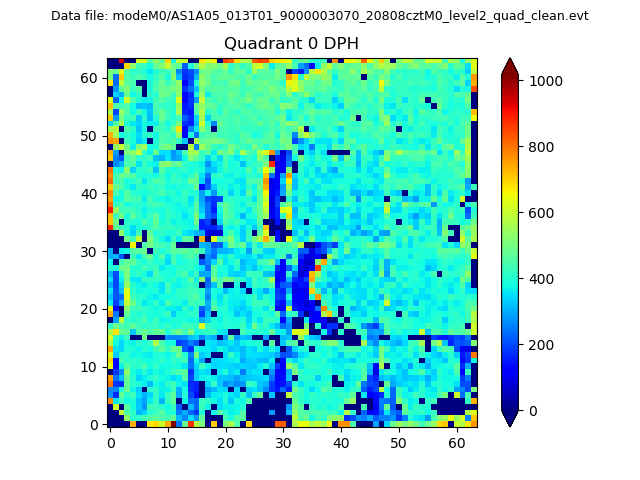 |
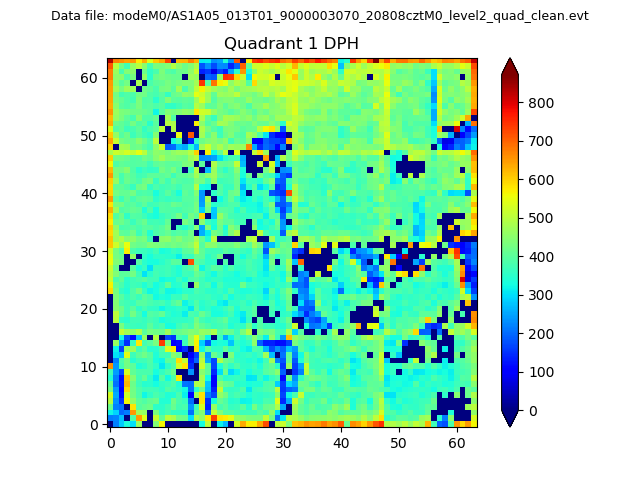 |
Quadrant B |
|---|---|---|---|
| Quadrant D | 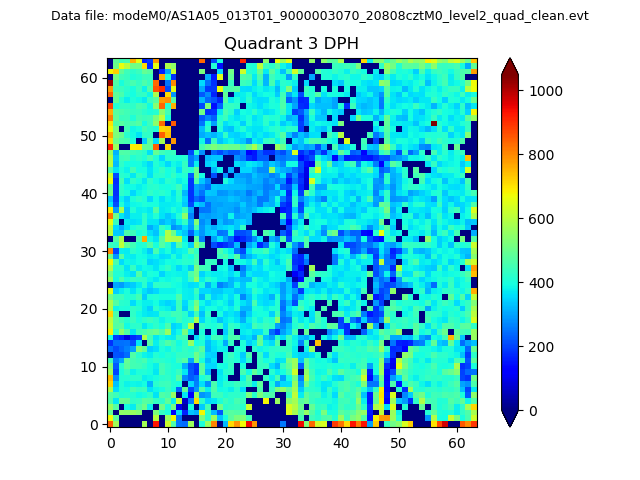 |
 |
Quadrant C |
| Plot type | Count rate plots | Images |
|---|---|---|
| Comparison with Poisson distribution Blue bars denote a histogram of data divided into 1 sec bins. Red curve is a Poisson curve with rate = median count rate of data. |
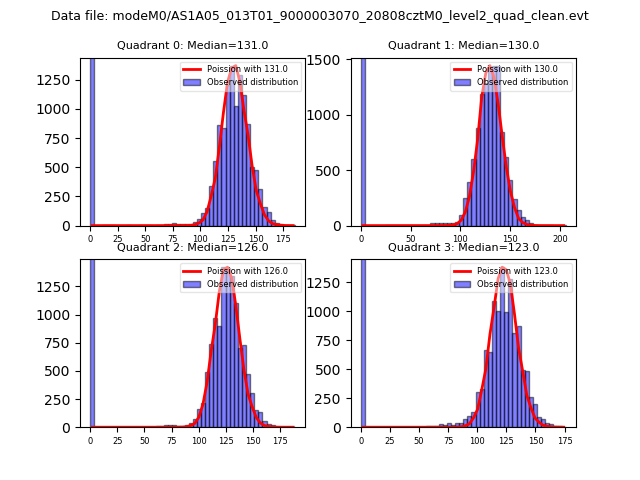 |
 |
| Quadrant-wise count rates Data is divided into 100 sec bins |
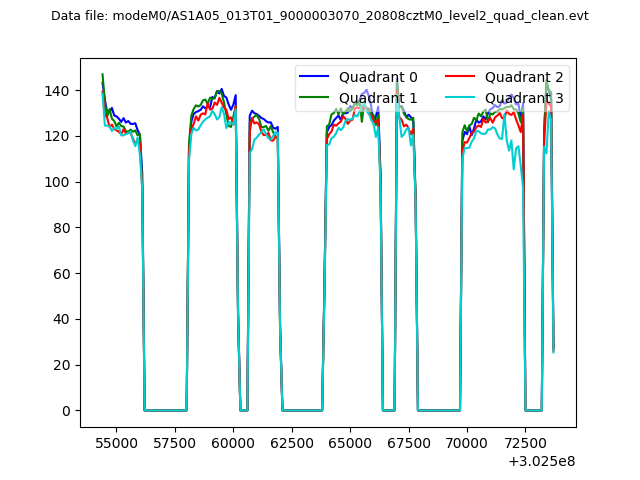 |
|
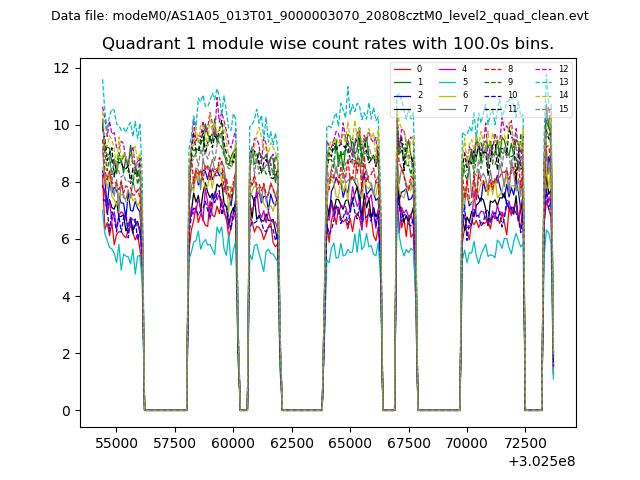
| Module-wise count rates for Quadrant A Data is divided into 100 sec bins |
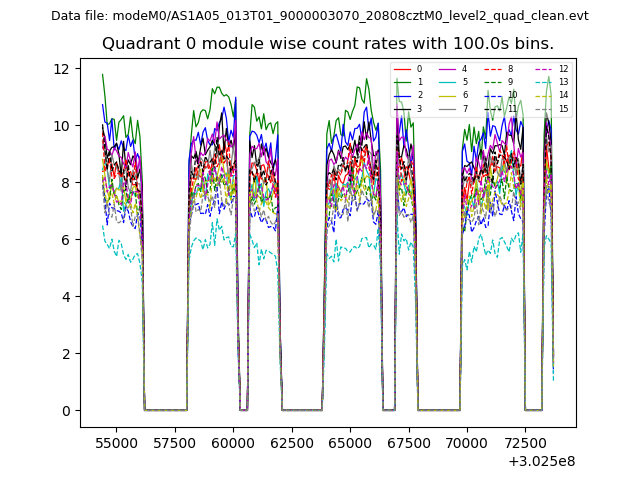 |
 |
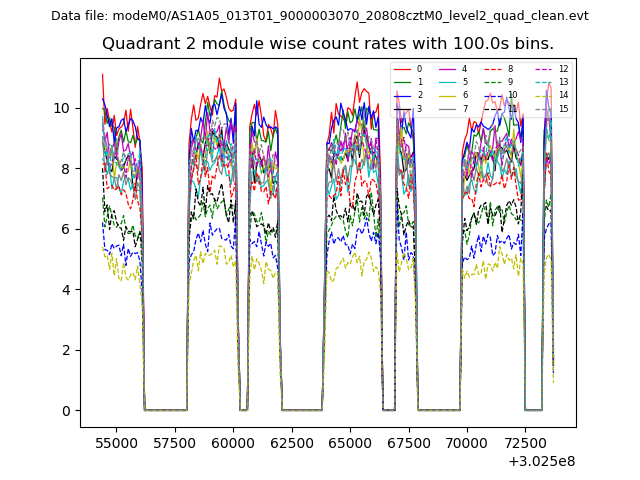
| Module-wise count rates for Quadrant B Data is divided into 100 sec bins |
 |
 |
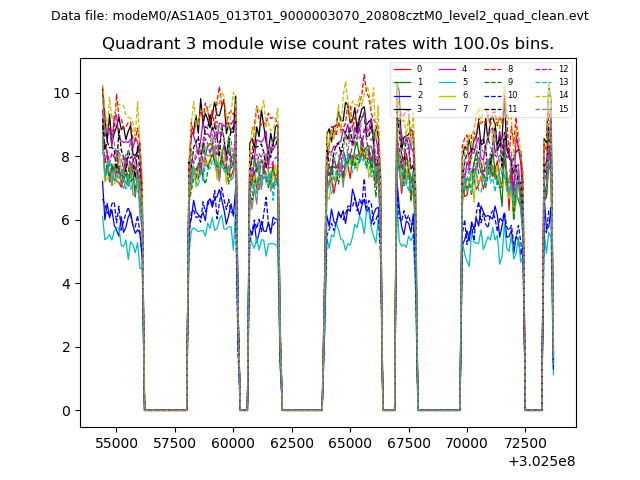
| Module-wise count rates for Quadrant C Data is divided into 100 sec bins |
 |
 |
| Module-wise count rates for Quadrant D Data is divided into 100 sec bins |
 |
 |
| Parameter | Plot |
|---|---|
| CZT HV Monitor | 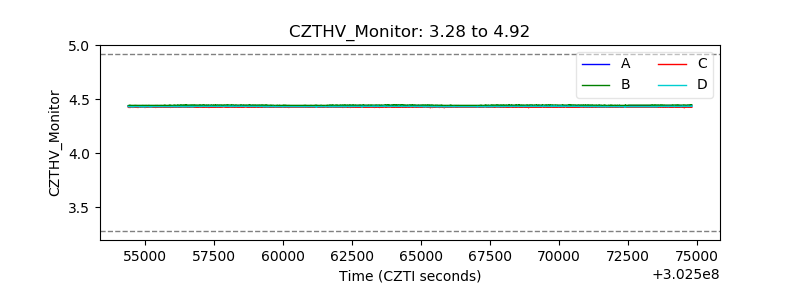 |
| D_VDD | 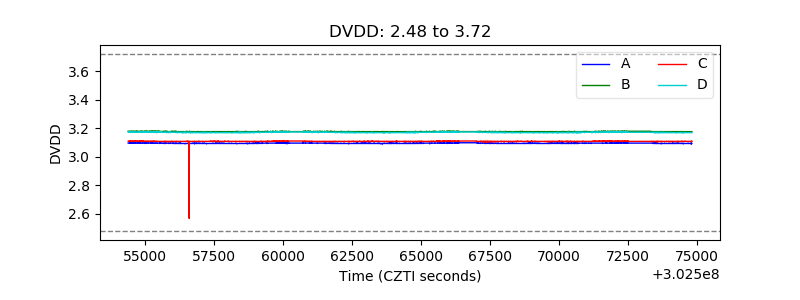 |
| Temperature 1 | 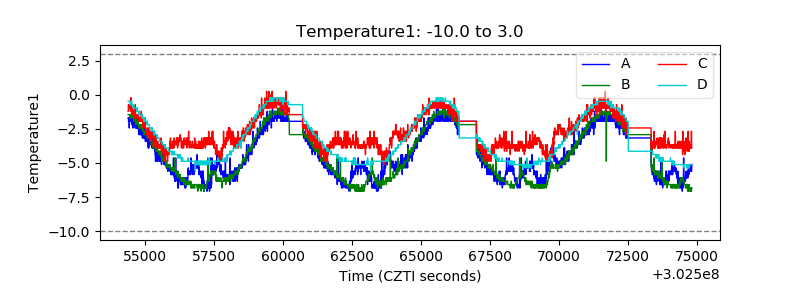 |
| Veto HV Monitor |  |
| Veto LLD | 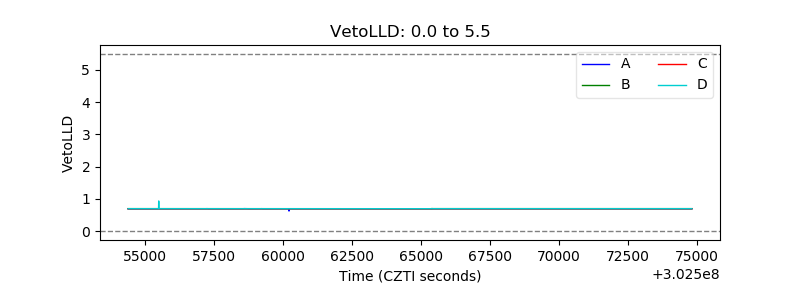 |
| Alpha Counter | 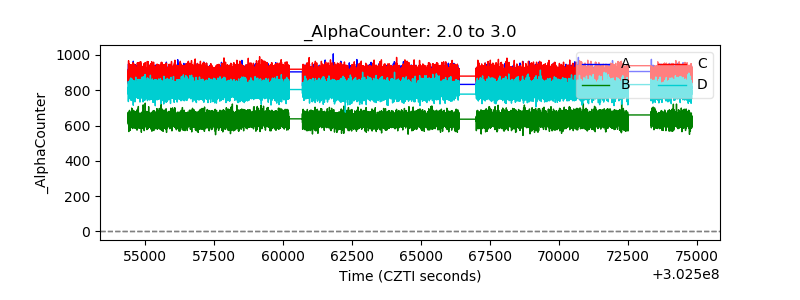 |
| _CPM_Rate | 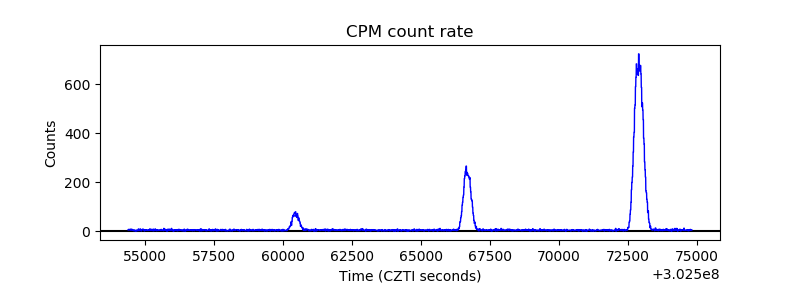 |
| CZT Counter | 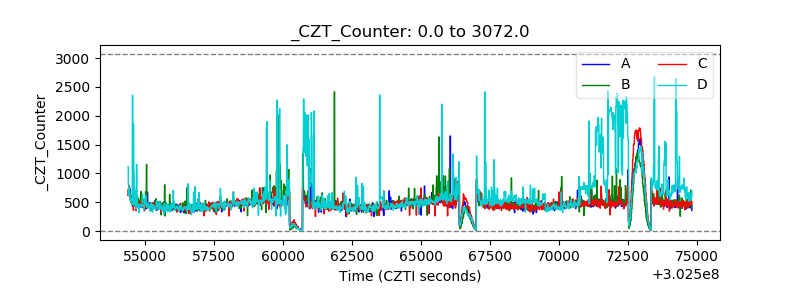 |
| +2.5 Volts monitor | 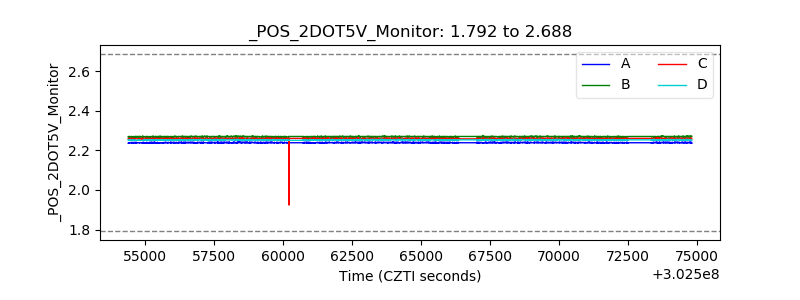 |
| +5 Volts monitor |  |
| _ROLL_ROT | 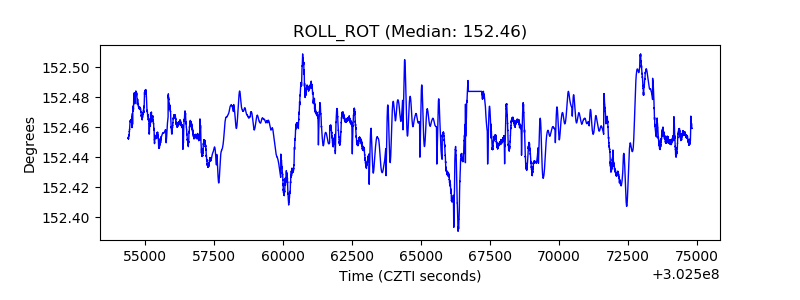 |
| _Roll_DEC | 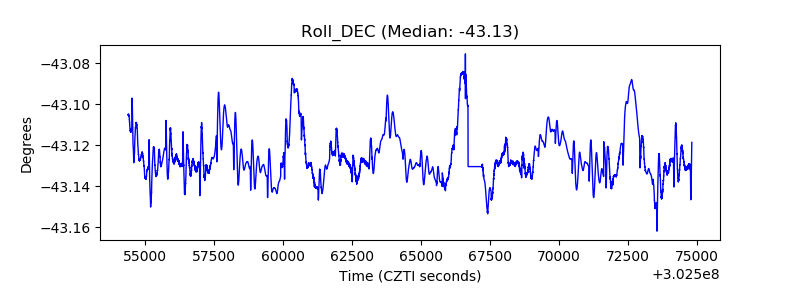 |
| _Roll_RA | 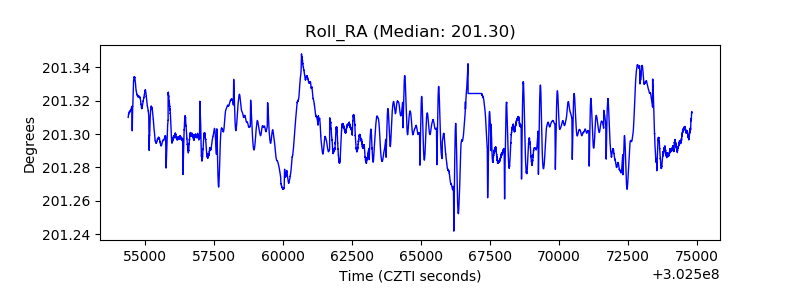 |
| Veto Counter | 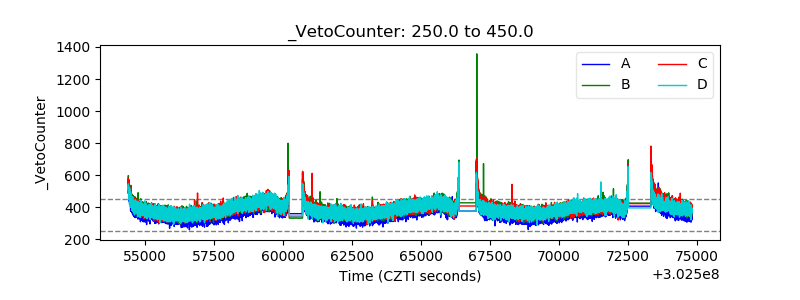 |