| Param | Original file | Final file |
|---|---|---|
| Filename | modeM0/AS1A05_013T01_9000003070_20809cztM0_level2.evt | modeM0/AS1A05_013T01_9000003070_20809cztM0_level2_quad_clean.evt |
| Size (bytes) | 349,519,680 | 47,419,200 |
| Size | 333.3 MB | 45.2 MB |
| Events in quadrant A | 2,053,801 | 293,187 |
| Events in quadrant B | 2,232,613 | 292,196 |
| Events in quadrant C | 2,053,025 | 282,766 |
| Events in quadrant D | 3,947,031 | 258,921 |
| Mode SS | |||
|---|---|---|---|
| Quadrant | BADHDUFLAG | Total packets | Discarded packets |
| A | 0 | 113 | 17 |
| B | 0 | 115 | 21 |
| C | 0 | 114 | 28 |
| D | 0 | 113 | 25 |
| Mode M0 | |||
|---|---|---|---|
| Quadrant | BADHDUFLAG | Total packets | Discarded packets |
| A | 0 | 10850 | 1893 |
| B | 0 | 11594 | 2244 |
| C | 0 | 10802 | 1906 |
| D | 0 | 18771 | 3900 |
| Mode M9 | |||
|---|---|---|---|
| Quadrant | BADHDUFLAG | Total packets | Discarded packets |
| A | 0 | 12 | 4 |
| B | 0 | 10 | 2 |
| C | 0 | 12 | 4 |
| D | 0 | 13 | 5 |
| Quadrant | Total seconds | Saturated seconds | Saturation percentage |
|---|---|---|---|
| A | 4401 | 19 | 0.431720% |
| B | 4414 | 32 | 0.724966% |
| C | 4386 | 39 | 0.889193% |
| D | 4297 | 211 | 4.910403% |
Noise dominated data is calculated using 1-second bins in cleaned event files. If a bin has >2000 counts, and if more than 50% of those come from <1% of pixels, then it is considered to be noise-dominated and hence unusable.
| Quadrant | # 1 sec bins | Bins with >0 counts | Bins with >2000 counts | High rate bins dominated by noise | Noise dominated (total time) | Noise dominated (detector-on time) | Marked lightcurve |
|---|---|---|---|---|---|---|---|
| A | 8680 | 4560 | 1 | 1 | 0.01% | 0.02% | 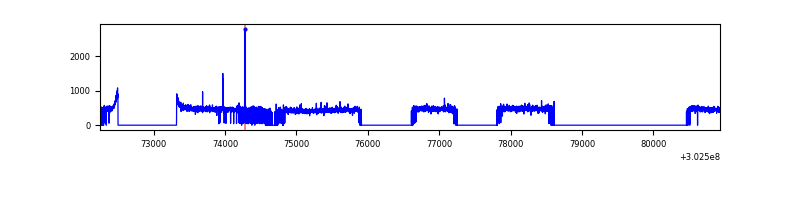 |
| B | 8683 | 4578 | 4 | 4 | 0.05% | 0.09% | 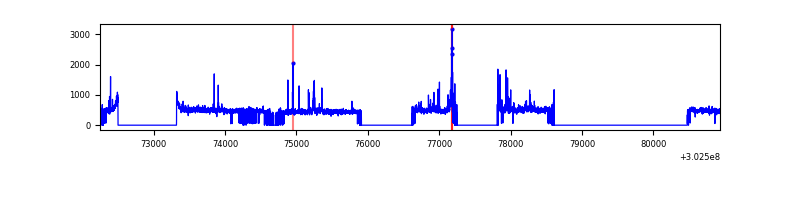 |
| C | 8680 | 4546 | 0 | 0 | 0.00% | 0.00% | 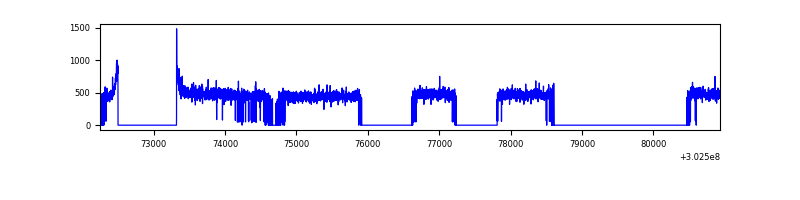 |
| D | 8677 | 4469 | 190 | 190 | 2.19% | 4.25% | 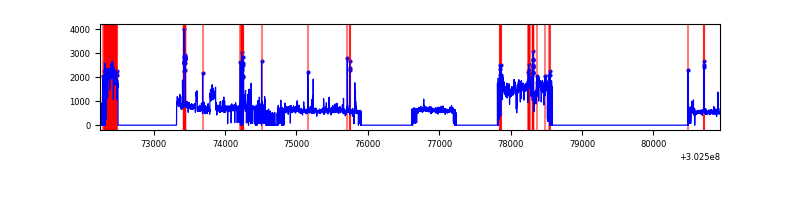 |
Top three noisy pixels from each quadrant. If the there are fewer than three noisy pixels in the level2.evt file, extra rows are filled as -1
| Pixel properties | Quadrant properties | ||||||
|---|---|---|---|---|---|---|---|
| Quadrant | DetID | PixID | Counts | Sigma | Mean | Median | Sigma |
| A | 0 | 253 | 12650 | 112.4 | 527 | 516 | 108.0 |
| A | 5 | 98 | 6135 | 52.05 | 527 | 516 | 108.0 |
| A | 12 | 96 | 5146 | 42.89 | 527 | 516 | 108.0 |
| B | 7 | 220 | 43469 | 423.97 | 528 | 514 | 101.3 |
| B | 4 | 171 | 38372 | 373.66 | 528 | 514 | 101.3 |
| B | 0 | 189 | 30777 | 298.7 | 528 | 514 | 101.3 |
| C | 14 | 238 | 80616 | 677.93 | 503 | 506 | 118.2 |
| C | 7 | 247 | 5447 | 41.81 | 503 | 506 | 118.2 |
| C | 9 | 54 | 4351 | 32.54 | 503 | 506 | 118.2 |
| D | 1 | 20 | 1774094 | 14775.11 | 489 | 474 | 120.0 |
| D | 1 | 52 | 136711 | 1134.92 | 489 | 474 | 120.0 |
| D | 1 | 239 | 62008 | 512.61 | 489 | 474 | 120.0 |
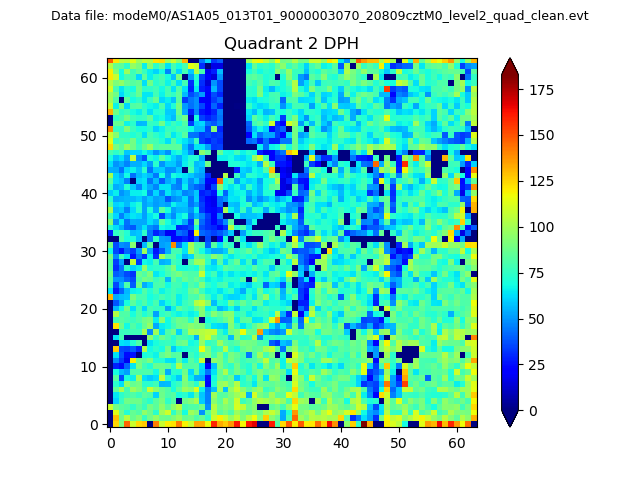
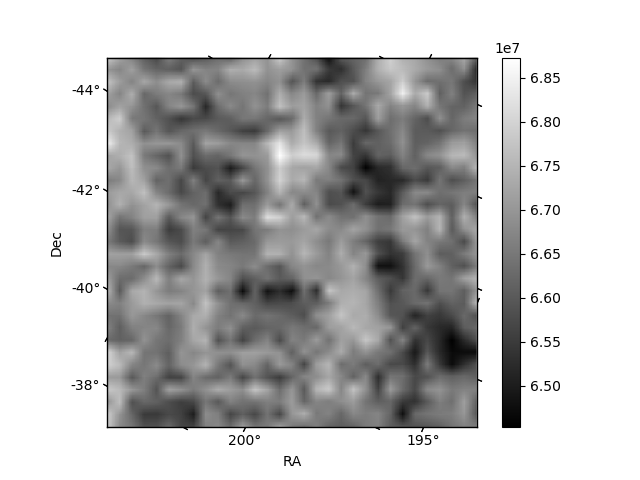
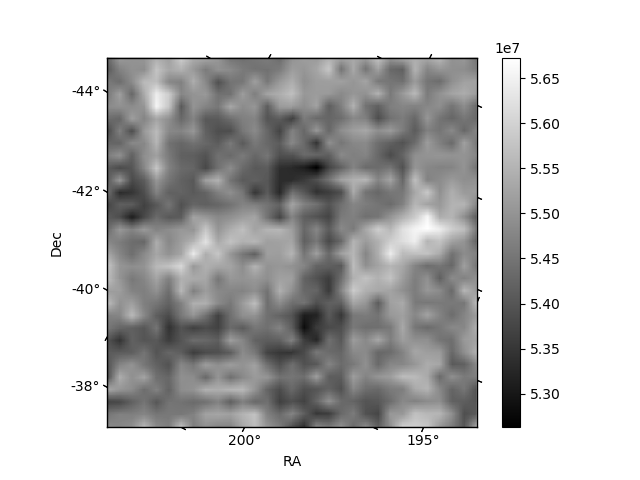
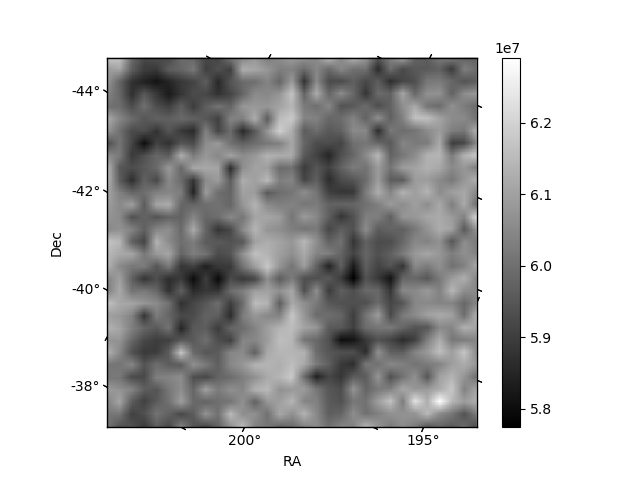
Histogram calculated using DETX and DETY for each event in the final _common_clean file
| Quadrant A | 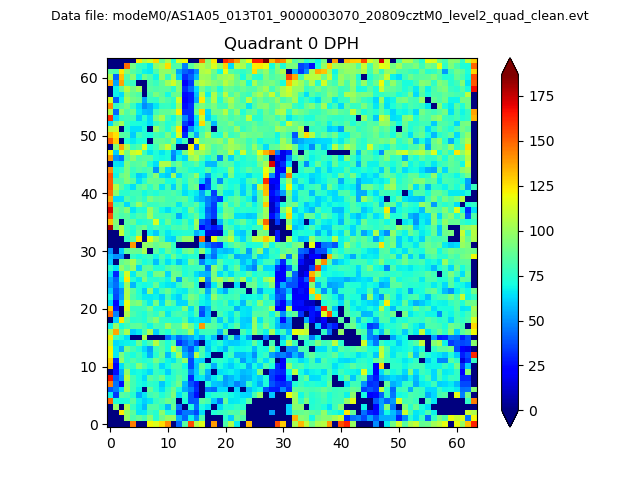 |
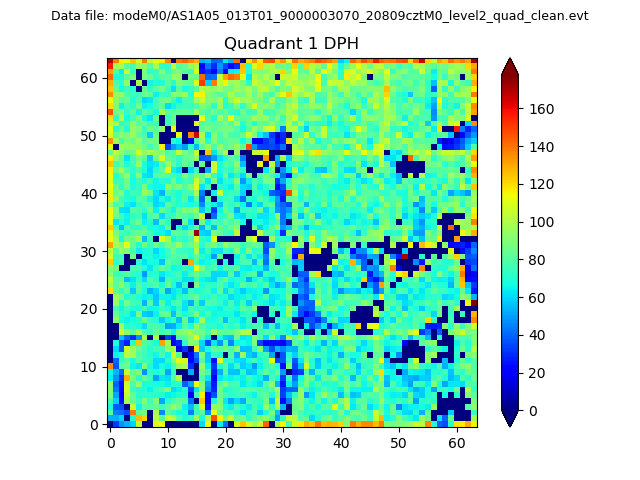 |
Quadrant B |
|---|---|---|---|
| Quadrant D | 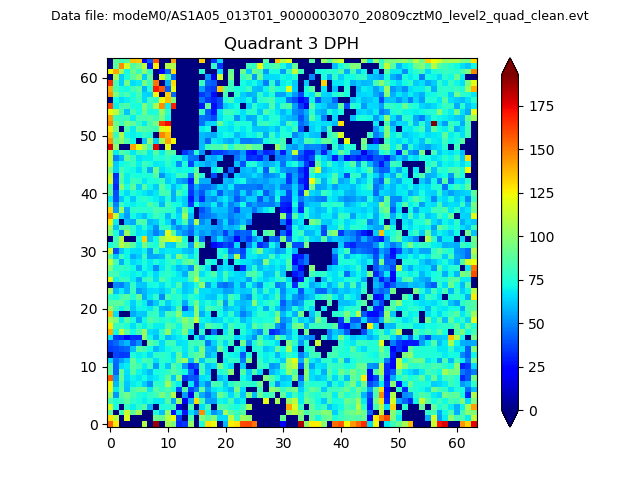 |
 |
Quadrant C |
| Plot type | Count rate plots | Images |
|---|---|---|
| Comparison with Poisson distribution Blue bars denote a histogram of data divided into 1 sec bins. Red curve is a Poisson curve with rate = median count rate of data. |
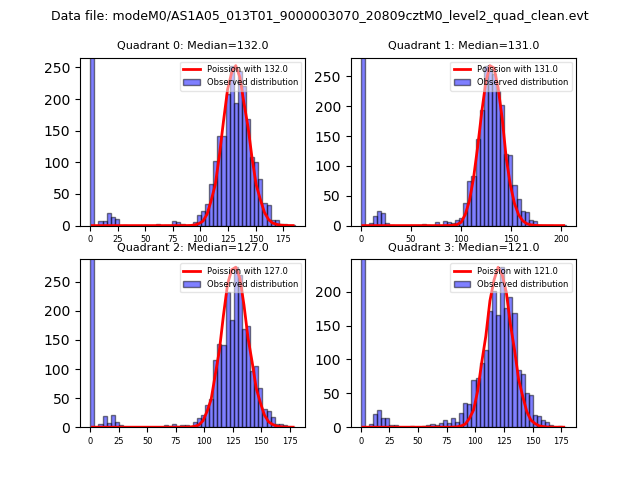 |
 |
| Quadrant-wise count rates Data is divided into 100 sec bins |
 |
|
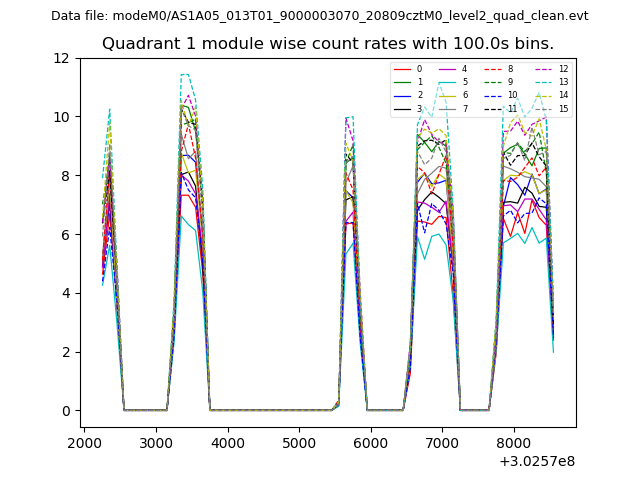
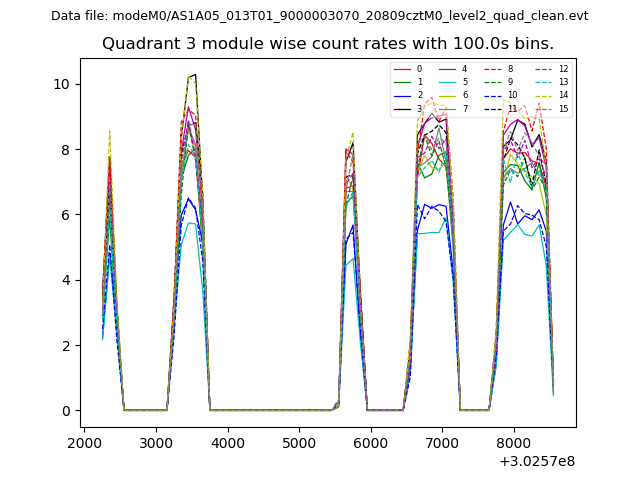
| Module-wise count rates for Quadrant A Data is divided into 100 sec bins |
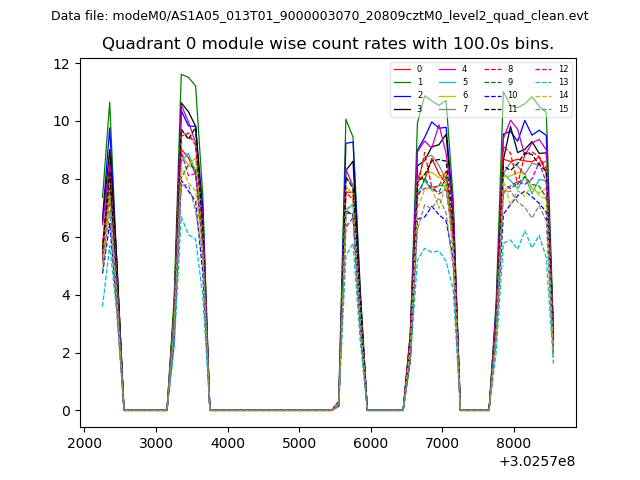 |
 |
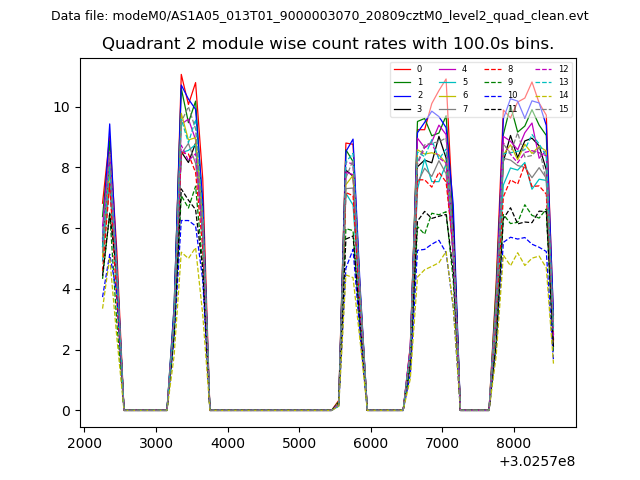
| Module-wise count rates for Quadrant B Data is divided into 100 sec bins |
 |
 |
| Module-wise count rates for Quadrant C Data is divided into 100 sec bins |
 |
 |
| Module-wise count rates for Quadrant D Data is divided into 100 sec bins |
 |
 |
| Parameter | Plot |
|---|---|
| CZT HV Monitor | 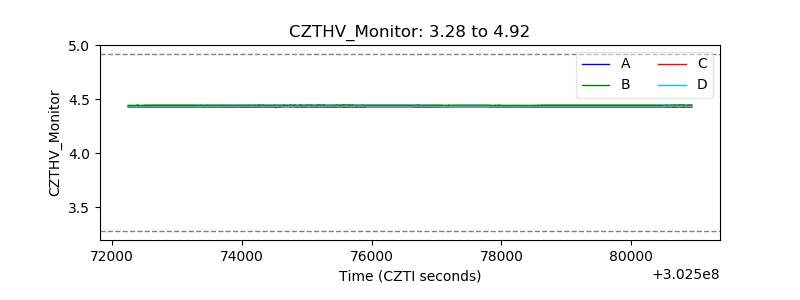 |
| D_VDD | 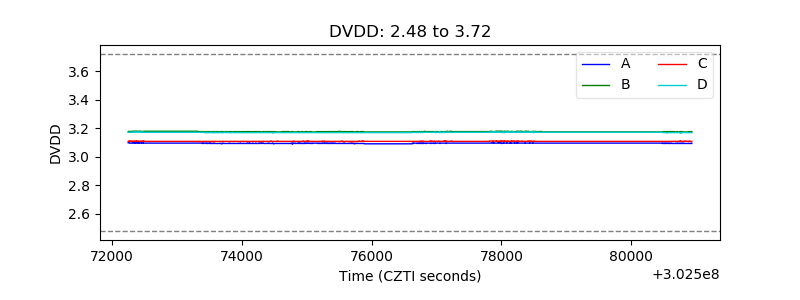 |
| Temperature 1 |  |
| Veto HV Monitor | 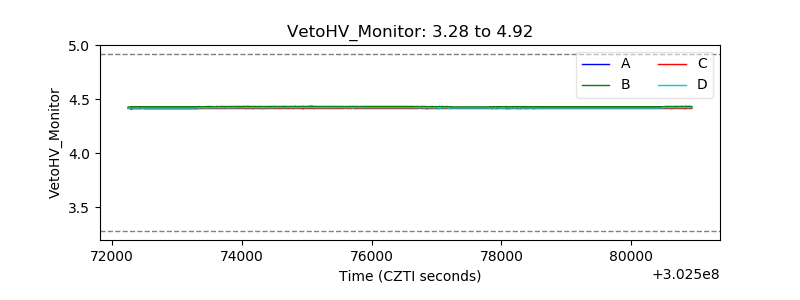 |
| Veto LLD | 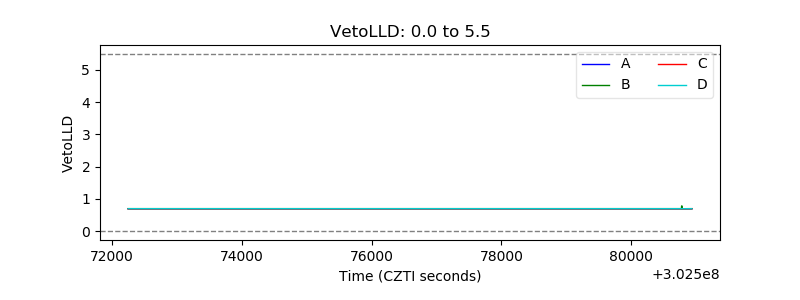 |
| Alpha Counter | 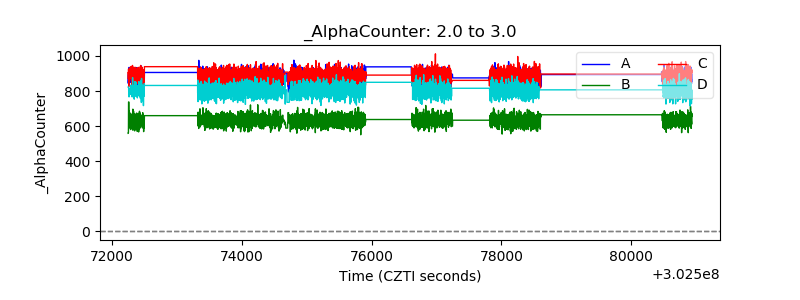 |
| _CPM_Rate | 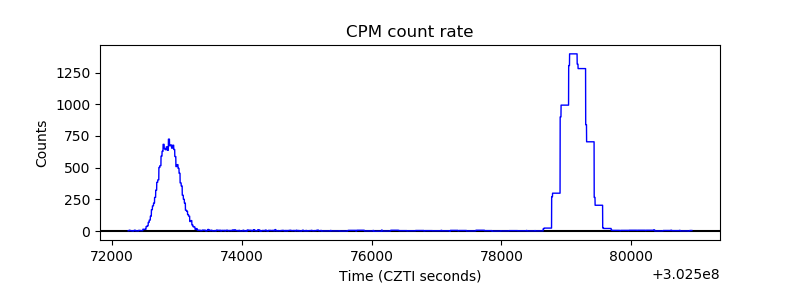 |
| CZT Counter | 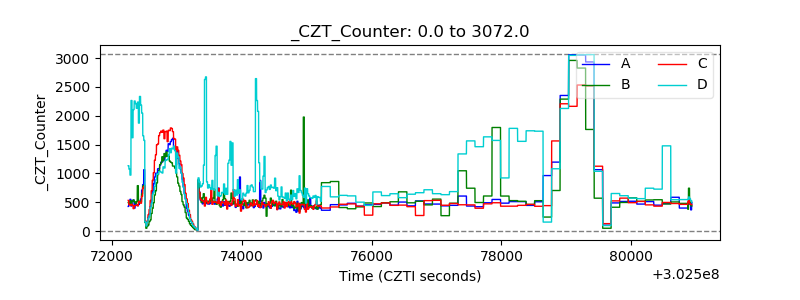 |
| +2.5 Volts monitor |  |
| +5 Volts monitor |  |
| _ROLL_ROT | 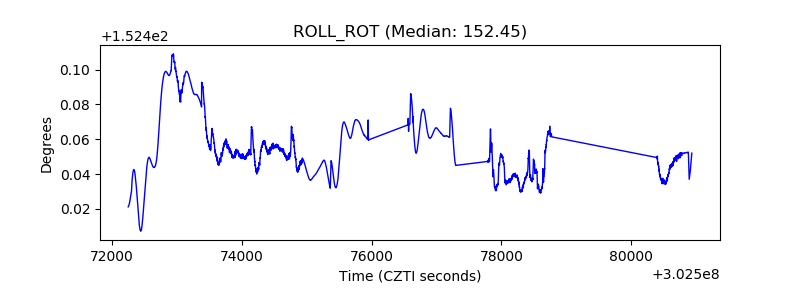 |
| _Roll_DEC | 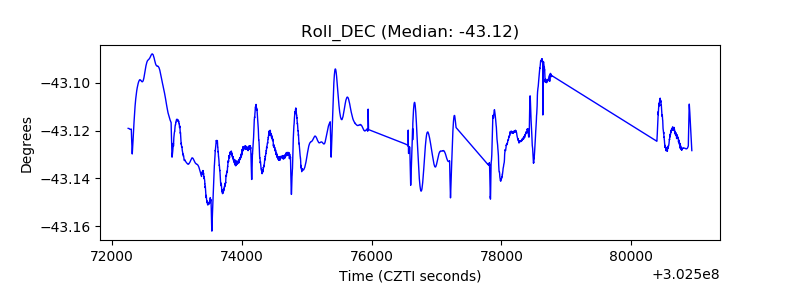 |
| _Roll_RA | 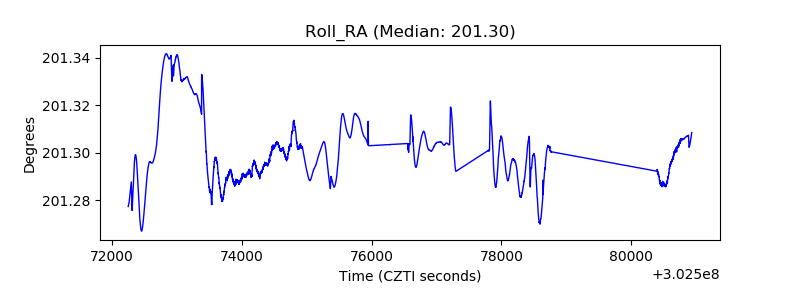 |
| Veto Counter | 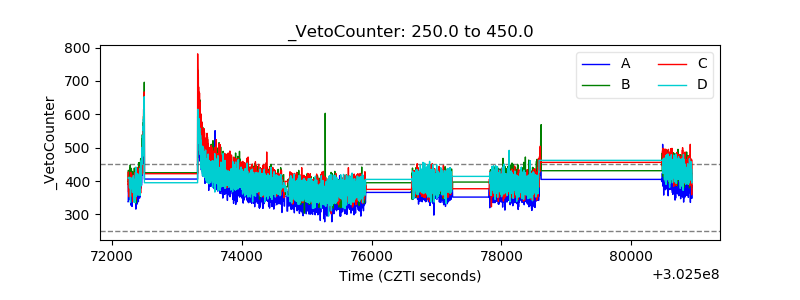 |