| Param | Original file | Final file |
|---|---|---|
| Filename | modeM0/AS1A05_013T01_9000003070_20812cztM0_level2.evt | modeM0/AS1A05_013T01_9000003070_20812cztM0_level2_quad_clean.evt |
| Size (bytes) | 1,297,080,000 | 214,329,600 |
| Size | 1.2 GB | 204.4 MB |
| Events in quadrant A | 7,976,723 | 1,374,778 |
| Events in quadrant B | 8,940,877 | 1,371,928 |
| Events in quadrant C | 8,033,955 | 1,343,086 |
| Events in quadrant D | 13,231,526 | 1,277,888 |
| Mode SS | |||
|---|---|---|---|
| Quadrant | BADHDUFLAG | Total packets | Discarded packets |
| A | 0 | 330 | 0 |
| B | 0 | 330 | 0 |
| C | 0 | 330 | 0 |
| D | 0 | 330 | 0 |
| Mode M0 | |||
|---|---|---|---|
| Quadrant | BADHDUFLAG | Total packets | Discarded packets |
| A | 0 | 33994 | 3 |
| B | 0 | 36787 | 3 |
| C | 0 | 34257 | 3 |
| D | 0 | 50908 | 3 |
| Mode M9 | |||
|---|---|---|---|
| Quadrant | BADHDUFLAG | Total packets | Discarded packets |
| A | 0 | 34 | 0 |
| B | 0 | 34 | 0 |
| C | 0 | 34 | 0 |
| D | 0 | 34 | 0 |
| Quadrant | Total seconds | Saturated seconds | Saturation percentage |
|---|---|---|---|
| A | 16297 | 82 | 0.503160% |
| B | 16298 | 231 | 1.417352% |
| C | 16298 | 176 | 1.079887% |
| D | 16298 | 592 | 3.632348% |
Noise dominated data is calculated using 1-second bins in cleaned event files. If a bin has >2000 counts, and if more than 50% of those come from <1% of pixels, then it is considered to be noise-dominated and hence unusable.
| Quadrant | # 1 sec bins | Bins with >0 counts | Bins with >2000 counts | High rate bins dominated by noise | Noise dominated (total time) | Noise dominated (detector-on time) | Marked lightcurve |
|---|---|---|---|---|---|---|---|
| A | 19672 | 16297 | 1 | 1 | 0.01% | 0.01% | 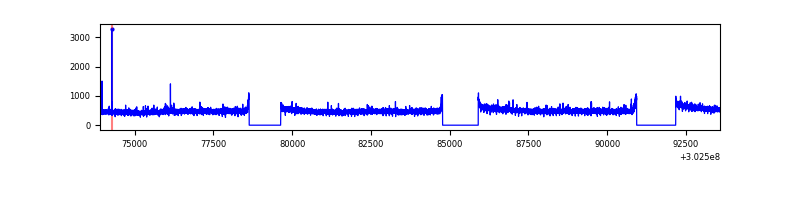 |
| B | 19673 | 16298 | 77 | 77 | 0.39% | 0.47% | 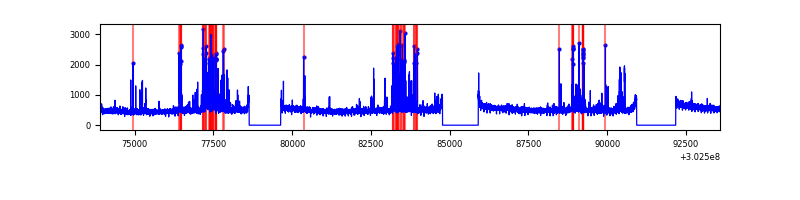 |
| C | 19673 | 16298 | 0 | 0 | 0.00% | 0.00% |  |
| D | 19673 | 16298 | 425 | 425 | 2.16% | 2.61% | 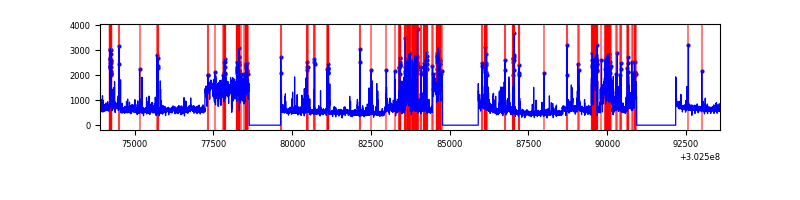 |
Top three noisy pixels from each quadrant. If the there are fewer than three noisy pixels in the level2.evt file, extra rows are filled as -1
| Pixel properties | Quadrant properties | ||||||
|---|---|---|---|---|---|---|---|
| Quadrant | DetID | PixID | Counts | Sigma | Mean | Median | Sigma |
| A | 13 | 252 | 30910 | 70.89 | 2059 | 2019 | 407.6 |
| A | 0 | 253 | 23637 | 53.04 | 2059 | 2019 | 407.6 |
| A | 0 | 226 | 17582 | 38.19 | 2059 | 2019 | 407.6 |
| B | 7 | 220 | 496378 | 1317.93 | 2032 | 1990 | 375.1 |
| B | 4 | 171 | 226166 | 597.6 | 2032 | 1990 | 375.1 |
| B | 0 | 189 | 98599 | 257.54 | 2032 | 1990 | 375.1 |
| C | 14 | 238 | 317070 | 700.05 | 1971 | 1986 | 450.1 |
| C | 9 | 54 | 21251 | 42.8 | 1971 | 1986 | 450.1 |
| C | 13 | 61 | 13769 | 26.18 | 1971 | 1986 | 450.1 |
| D | 1 | 20 | 3680807 | 7817.01 | 1973 | 1920 | 470.6 |
| D | 1 | 52 | 1083618 | 2298.43 | 1973 | 1920 | 470.6 |
| D | 9 | 1 | 744668 | 1578.21 | 1973 | 1920 | 470.6 |
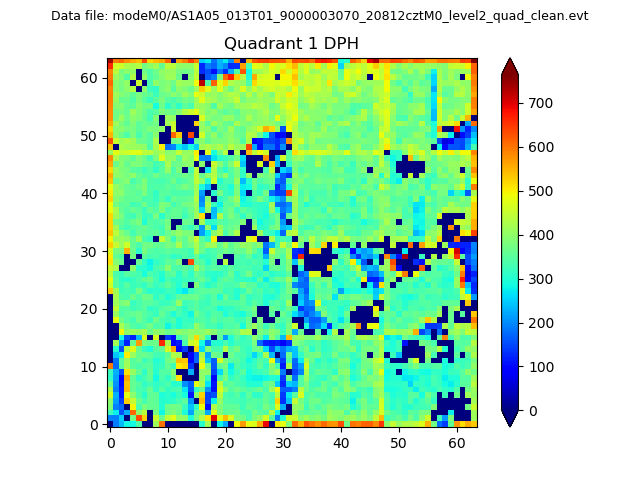
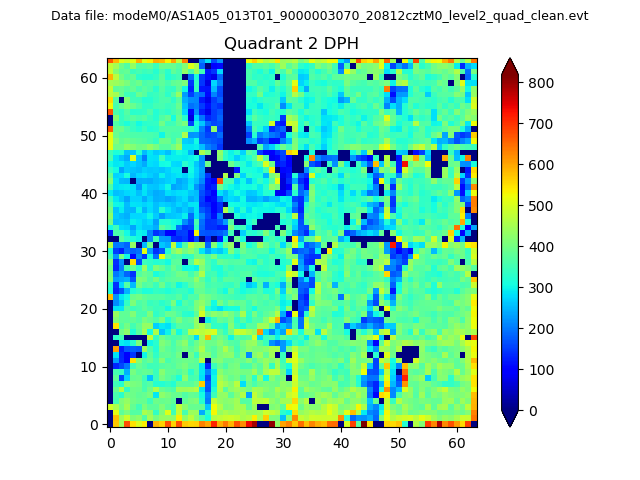
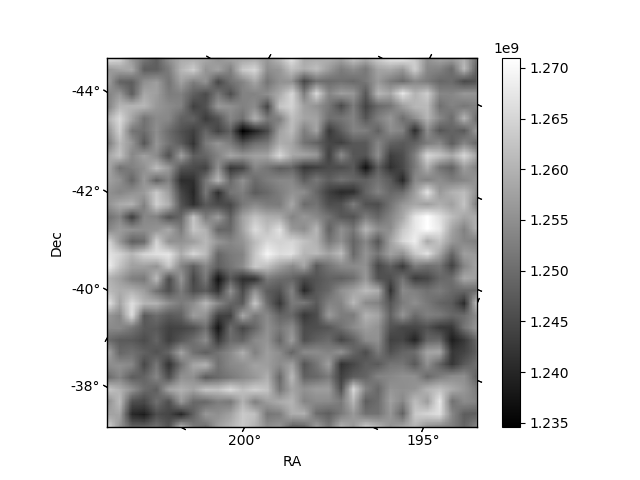
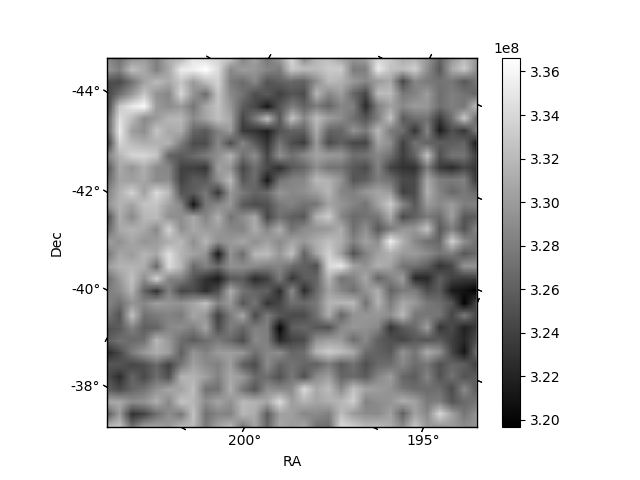
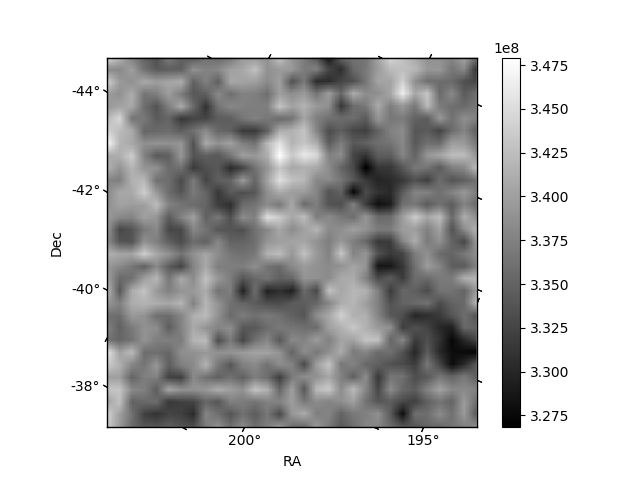
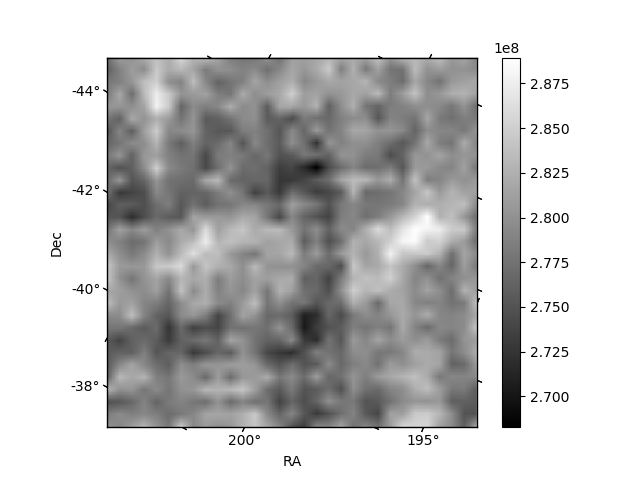
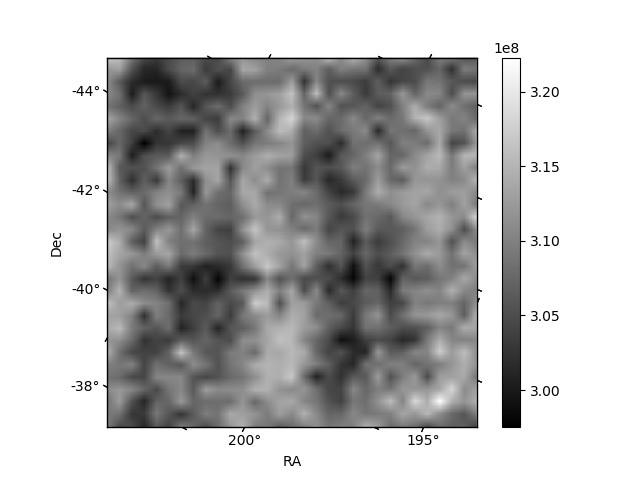
Histogram calculated using DETX and DETY for each event in the final _common_clean file
| Quadrant A | 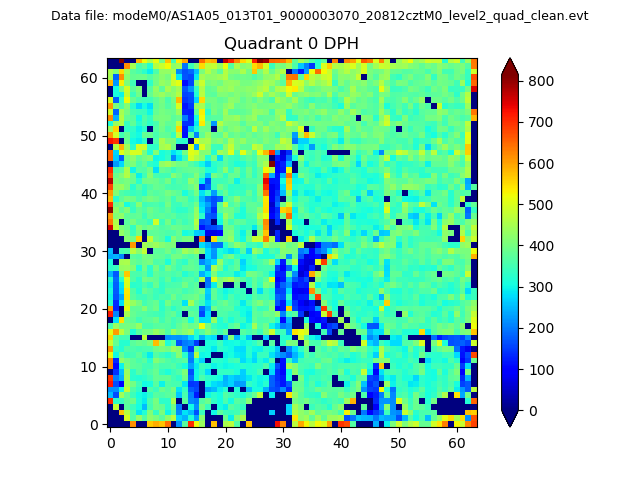 |
 |
Quadrant B |
|---|---|---|---|
| Quadrant D | 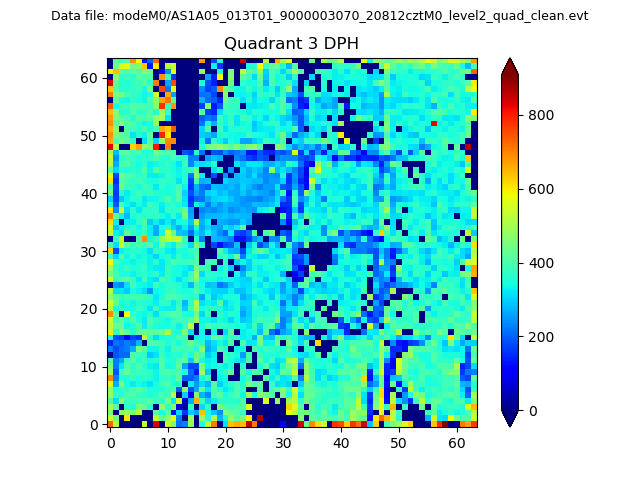 |
 |
Quadrant C |
| Plot type | Count rate plots | Images |
|---|---|---|
| Comparison with Poisson distribution Blue bars denote a histogram of data divided into 1 sec bins. Red curve is a Poisson curve with rate = median count rate of data. |
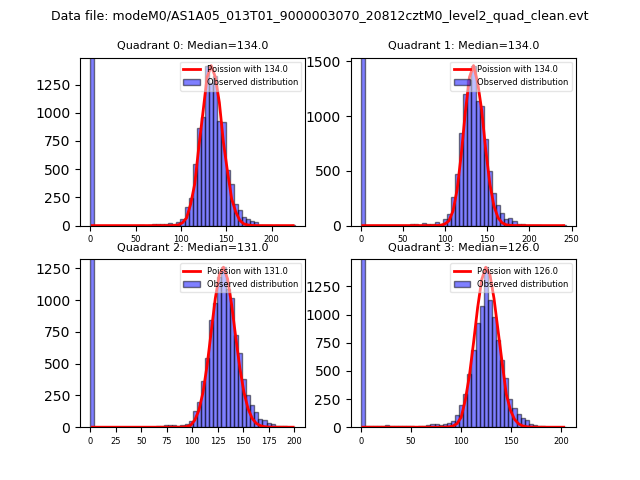 |
 |
| Quadrant-wise count rates Data is divided into 100 sec bins |
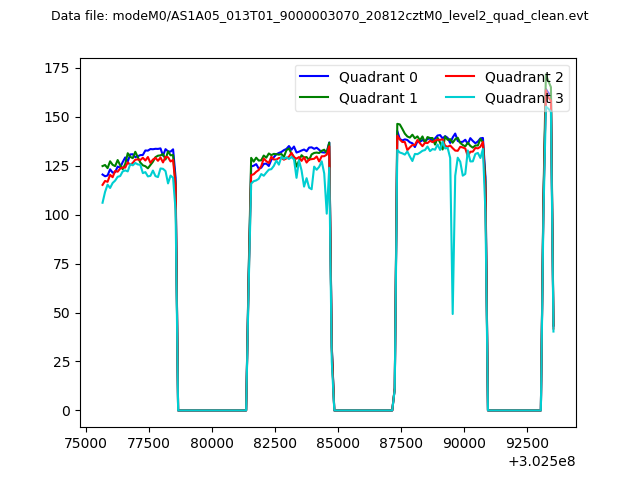 |
|
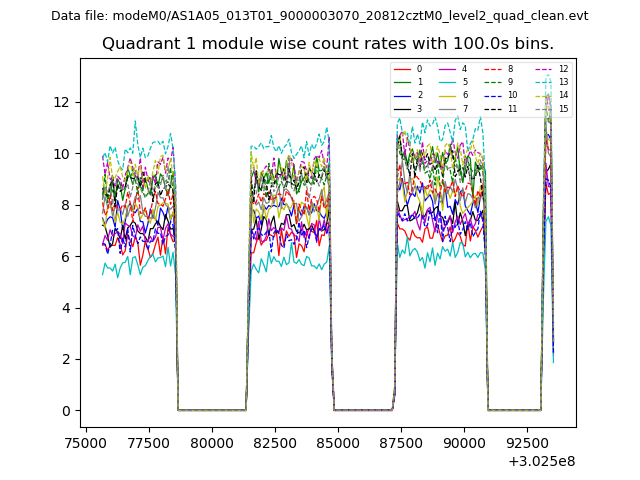
| Module-wise count rates for Quadrant A Data is divided into 100 sec bins |
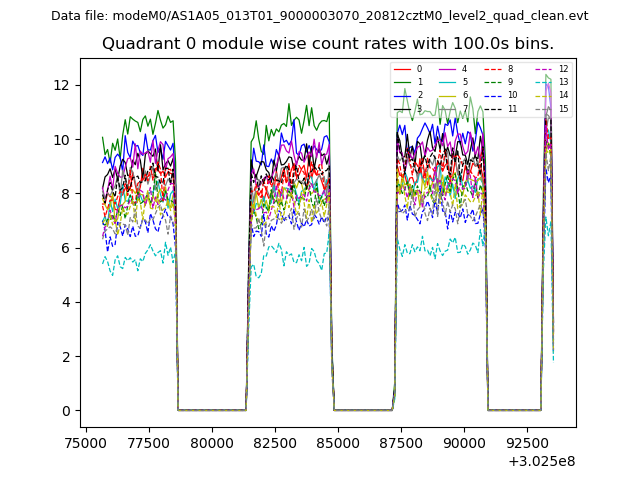 |
 |
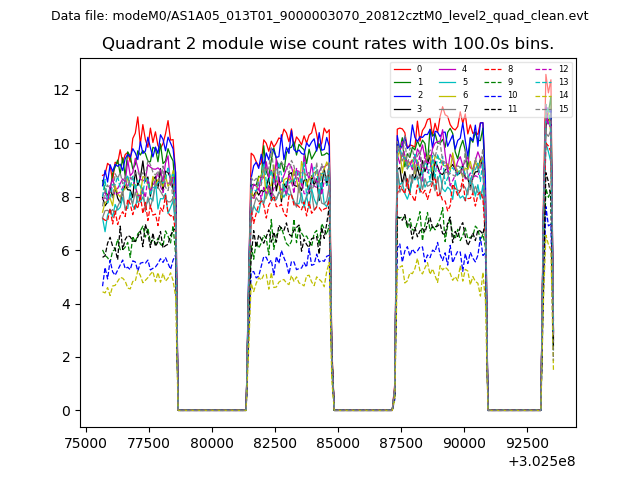
| Module-wise count rates for Quadrant B Data is divided into 100 sec bins |
 |
 |
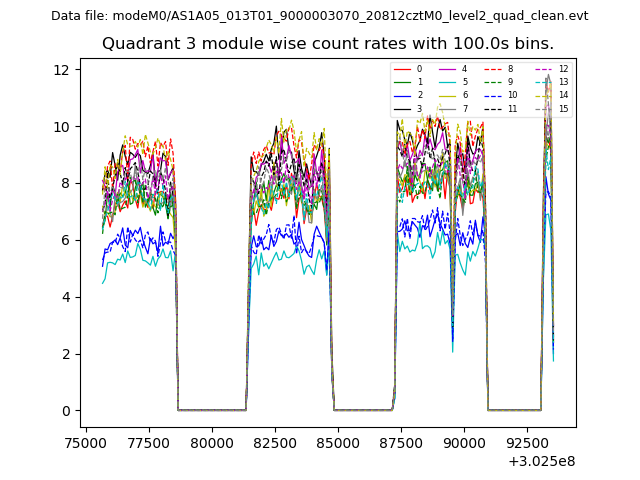
| Module-wise count rates for Quadrant C Data is divided into 100 sec bins |
 |
 |
| Module-wise count rates for Quadrant D Data is divided into 100 sec bins |
 |
 |
| Parameter | Plot |
|---|---|
| CZT HV Monitor | 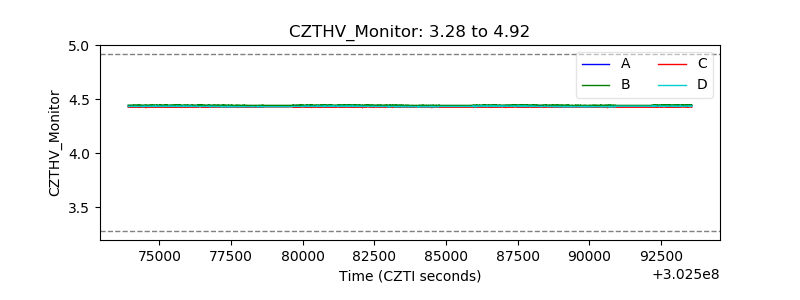 |
| D_VDD | 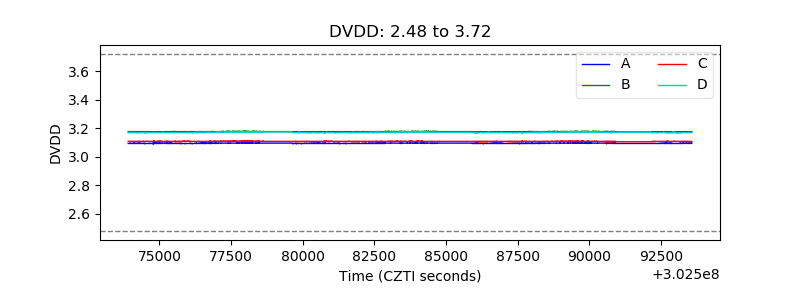 |
| Temperature 1 | 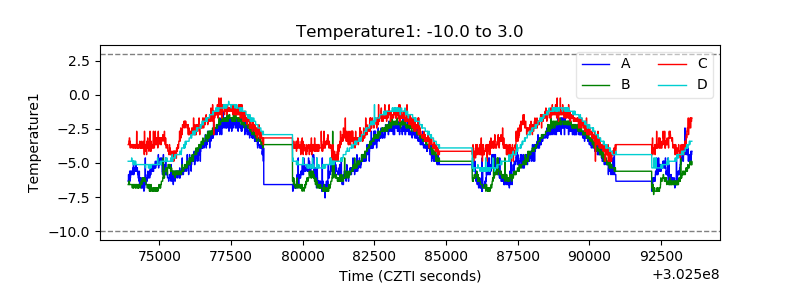 |
| Veto HV Monitor |  |
| Veto LLD | 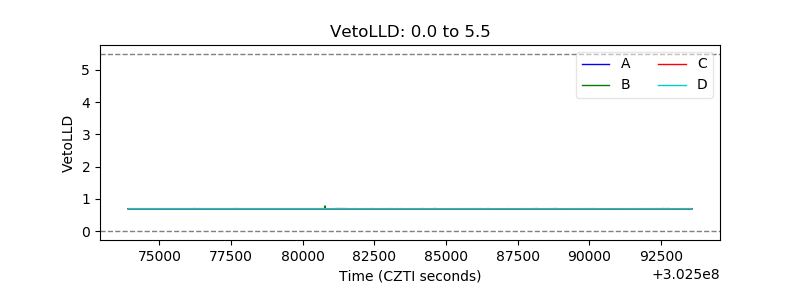 |
| Alpha Counter | 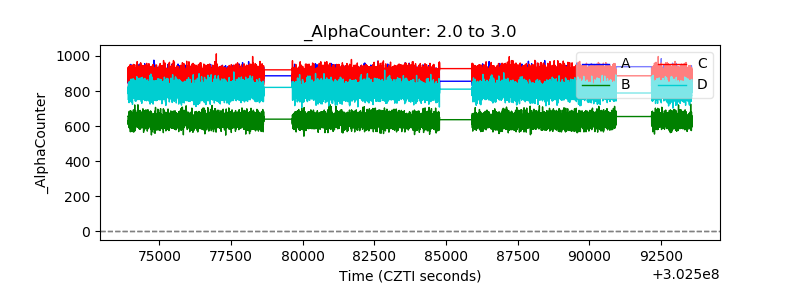 |
| _CPM_Rate | 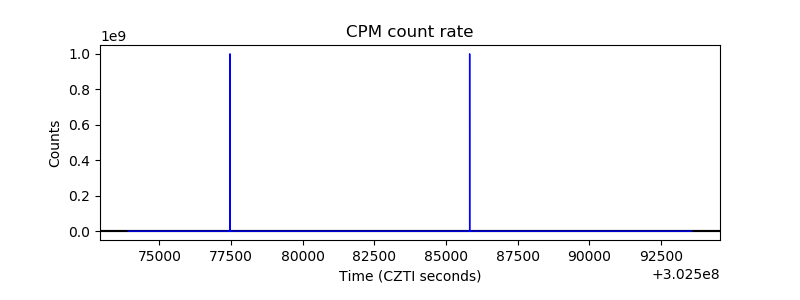 |
| CZT Counter | 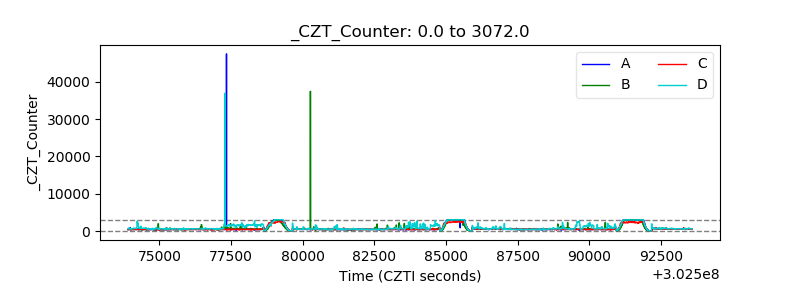 |
| +2.5 Volts monitor |  |
| +5 Volts monitor |  |
| _ROLL_ROT | 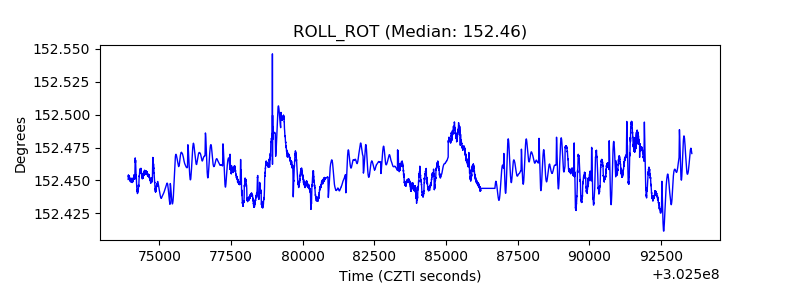 |
| _Roll_DEC | 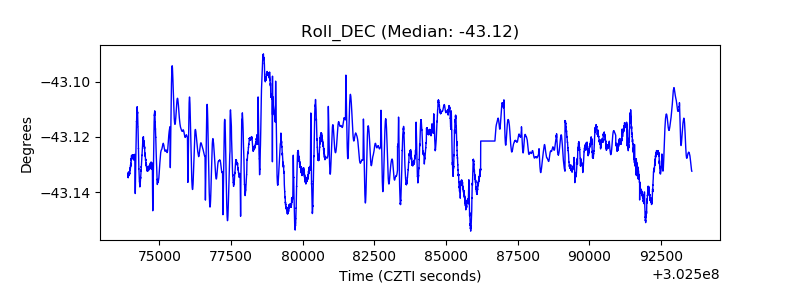 |
| _Roll_RA | 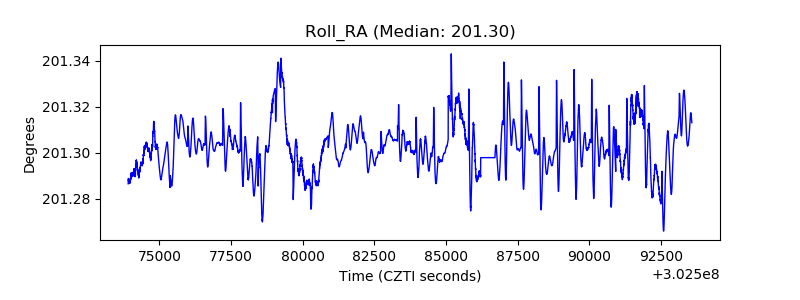 |
| Veto Counter | 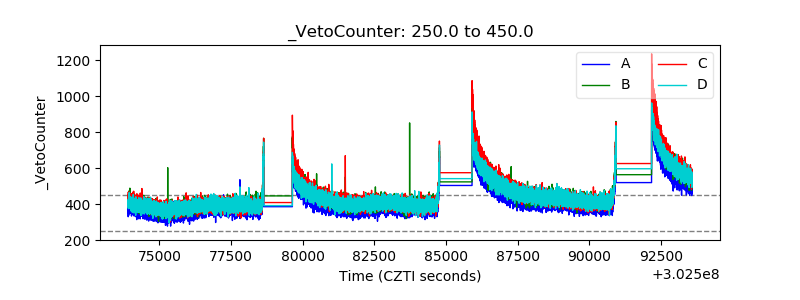 |