| Param | Original file | Final file |
|---|---|---|
| Filename | modeM0/AS1A05_013T01_9000003070_20813cztM0_level2.evt | modeM0/AS1A05_013T01_9000003070_20813cztM0_level2_quad_clean.evt |
| Size (bytes) | 353,842,560 | 71,150,400 |
| Size | 337.5 MB | 67.9 MB |
| Events in quadrant A | 2,326,120 | 504,508 |
| Events in quadrant B | 2,480,628 | 492,668 |
| Events in quadrant C | 2,297,423 | 476,182 |
| Events in quadrant D | 3,328,611 | 389,016 |
| Mode SS | |||
|---|---|---|---|
| Quadrant | BADHDUFLAG | Total packets | Discarded packets |
| A | 0 | 126 | 42 |
| B | 0 | 126 | 42 |
| C | 0 | 126 | 40 |
| D | 0 | 126 | 40 |
| Mode M0 | |||
|---|---|---|---|
| Quadrant | BADHDUFLAG | Total packets | Discarded packets |
| A | 0 | 14124 | 4536 |
| B | 0 | 15121 | 5044 |
| C | 0 | 14438 | 4924 |
| D | 0 | 21842 | 9206 |
| Mode M9 | |||
|---|---|---|---|
| Quadrant | BADHDUFLAG | Total packets | Discarded packets |
| A | 0 | 13 | 1 |
| B | 0 | 13 | 2 |
| C | 0 | 13 | 1 |
| D | 0 | 13 | 5 |
| Quadrant | Total seconds | Saturated seconds | Saturation percentage |
|---|---|---|---|
| A | 4292 | 46 | 1.071761% |
| B | 4201 | 76 | 1.809093% |
| C | 4173 | 94 | 2.252576% |
| D | 3807 | 369 | 9.692671% |
Noise dominated data is calculated using 1-second bins in cleaned event files. If a bin has >2000 counts, and if more than 50% of those come from <1% of pixels, then it is considered to be noise-dominated and hence unusable.
| Quadrant | # 1 sec bins | Bins with >0 counts | Bins with >2000 counts | High rate bins dominated by noise | Noise dominated (total time) | Noise dominated (detector-on time) | Marked lightcurve |
|---|---|---|---|---|---|---|---|
| A | 7504 | 5531 | 0 | 0 | 0.00% | 0.00% | 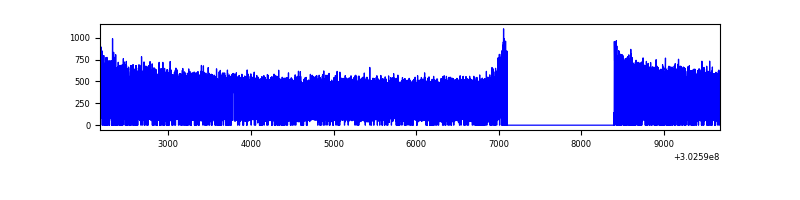 |
| B | 7505 | 5499 | 10 | 10 | 0.13% | 0.18% | 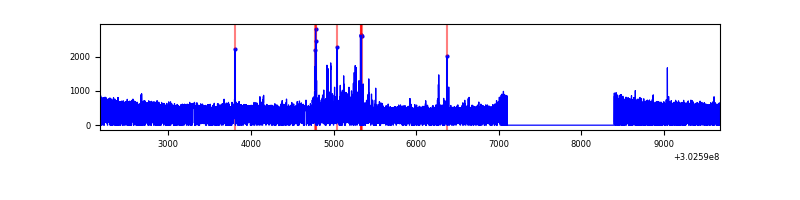 |
| C | 7506 | 5468 | 0 | 0 | 0.00% | 0.00% | 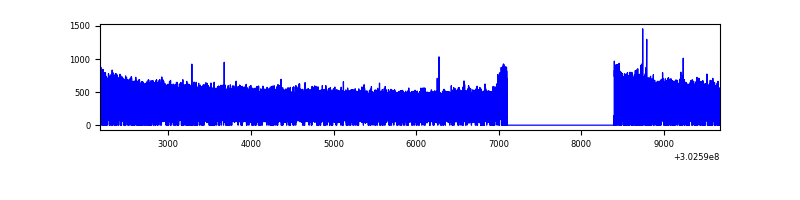 |
| D | 7502 | 5058 | 320 | 320 | 4.27% | 6.33% | 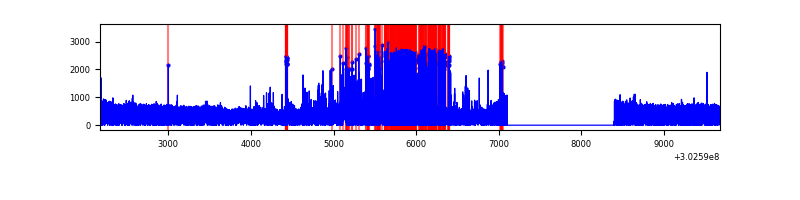 |
Top three noisy pixels from each quadrant. If the there are fewer than three noisy pixels in the level2.evt file, extra rows are filled as -1
| Pixel properties | Quadrant properties | ||||||
|---|---|---|---|---|---|---|---|
| Quadrant | DetID | PixID | Counts | Sigma | Mean | Median | Sigma |
| A | 0 | 226 | 5301 | 39.29 | 604 | 595 | 119.8 |
| A | 3 | 137 | 4326 | 31.15 | 604 | 595 | 119.8 |
| A | 12 | 194 | 4297 | 30.91 | 604 | 595 | 119.8 |
| B | 7 | 220 | 91471 | 852.03 | 580 | 569 | 106.7 |
| B | 0 | 189 | 50061 | 463.89 | 580 | 569 | 106.7 |
| B | 3 | 64 | 26611 | 244.09 | 580 | 569 | 106.7 |
| C | 14 | 238 | 90711 | 700.04 | 563 | 568 | 128.8 |
| C | 9 | 54 | 10194 | 74.75 | 563 | 568 | 128.8 |
| C | 13 | 61 | 3970 | 26.42 | 563 | 568 | 128.8 |
| D | 9 | 1 | 687248 | 5685.11 | 506 | 494 | 120.8 |
| D | 1 | 20 | 355752 | 2940.91 | 506 | 494 | 120.8 |
| D | 1 | 52 | 343197 | 2836.98 | 506 | 494 | 120.8 |
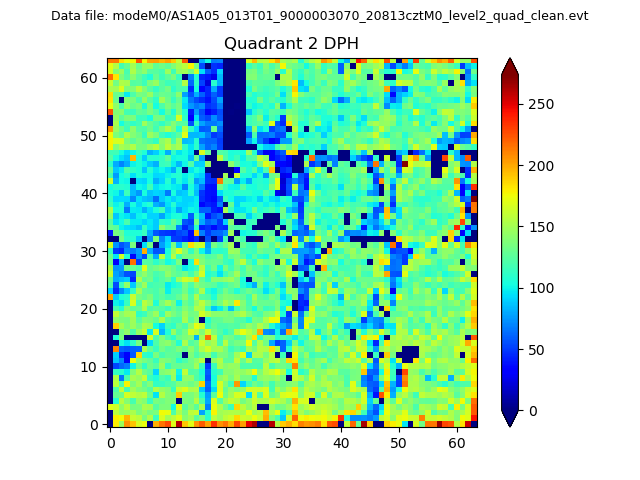
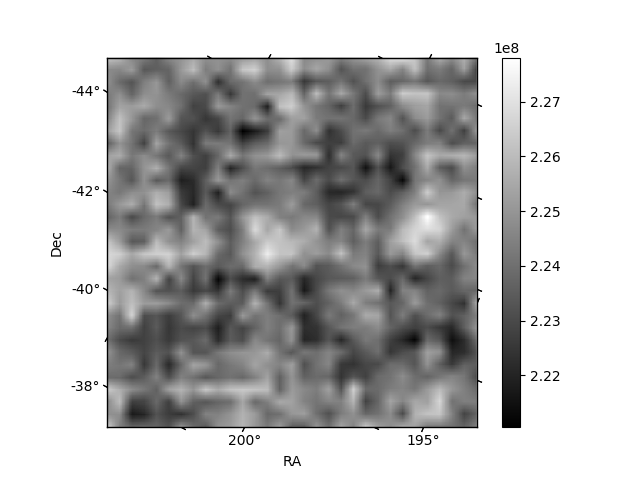
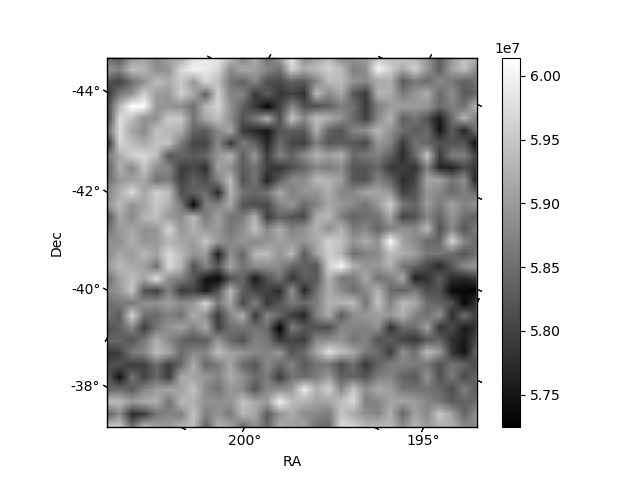
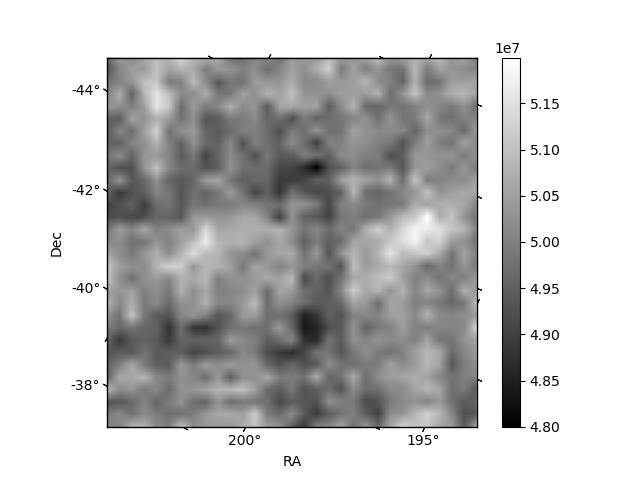
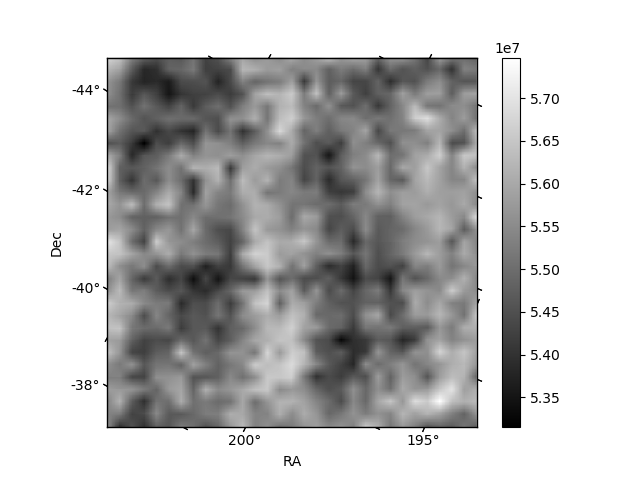
Histogram calculated using DETX and DETY for each event in the final _common_clean file
| Quadrant A | 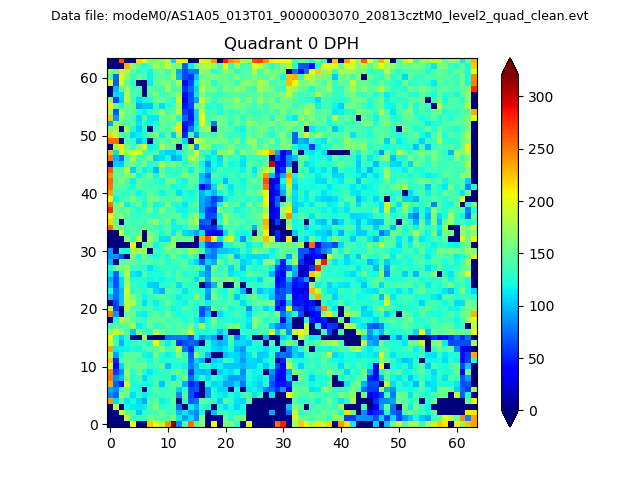 |
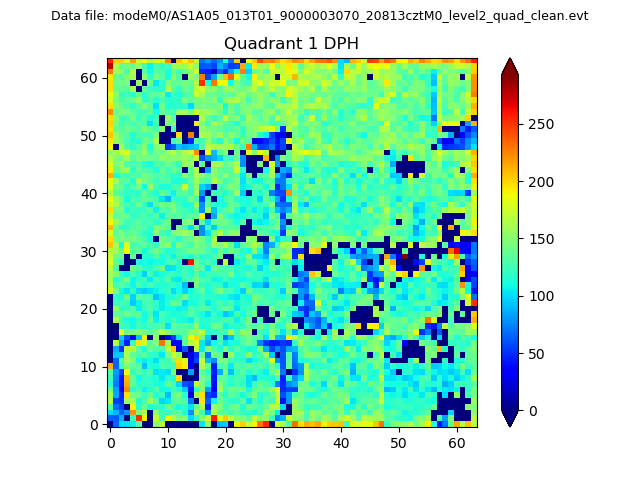 |
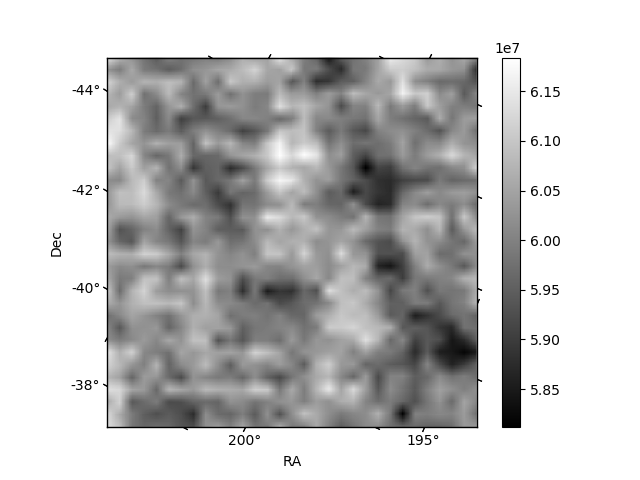
Quadrant B |
|---|---|---|---|
| Quadrant D | 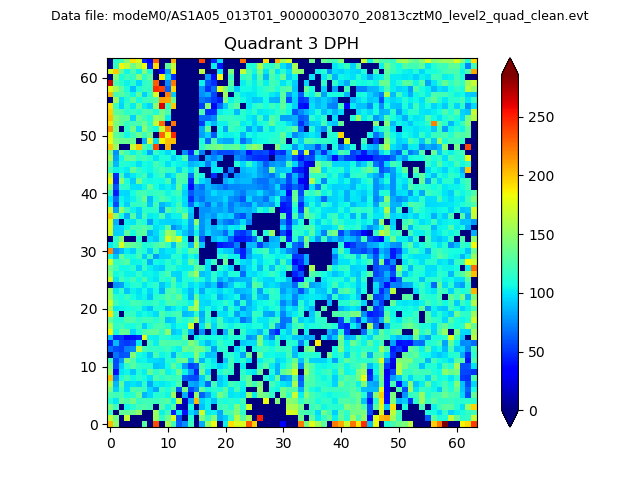 |
 |
Quadrant C |
| Plot type | Count rate plots | Images |
|---|---|---|
| Comparison with Poisson distribution Blue bars denote a histogram of data divided into 1 sec bins. Red curve is a Poisson curve with rate = median count rate of data. |
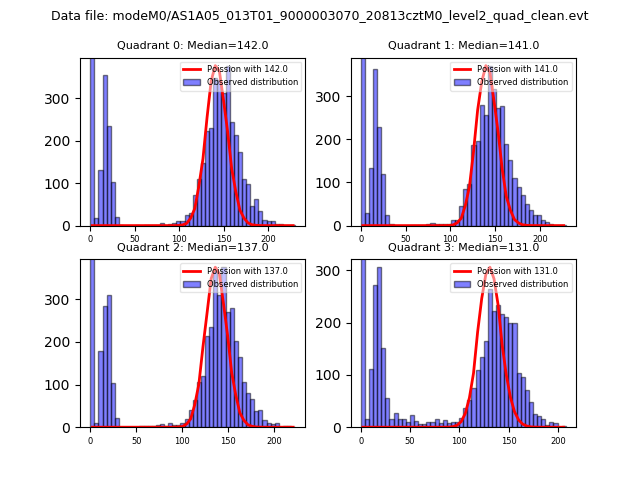 |
 |
| Quadrant-wise count rates Data is divided into 100 sec bins |
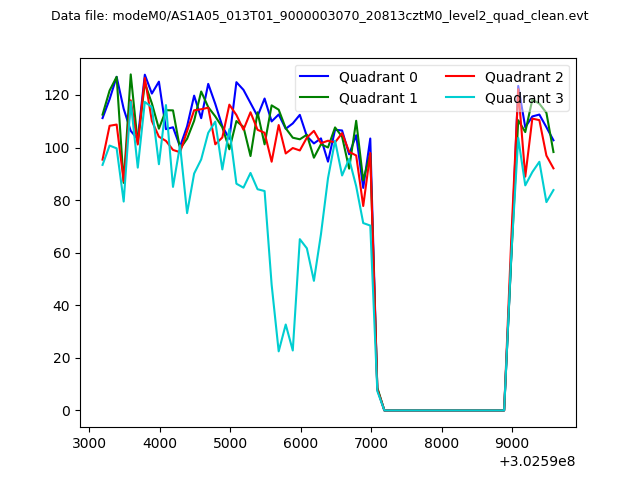 |
|
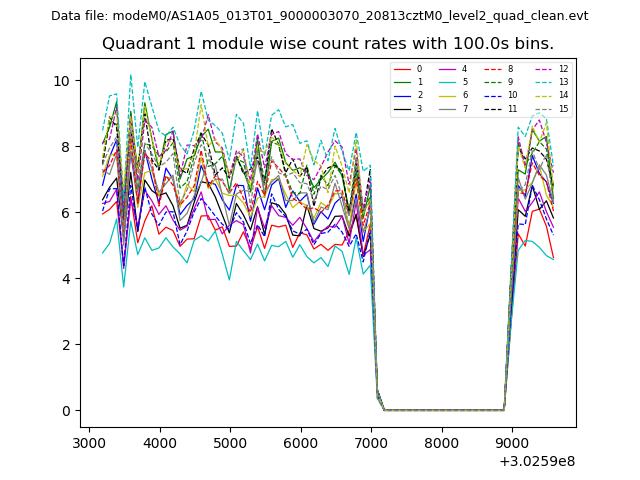
| Module-wise count rates for Quadrant A Data is divided into 100 sec bins |
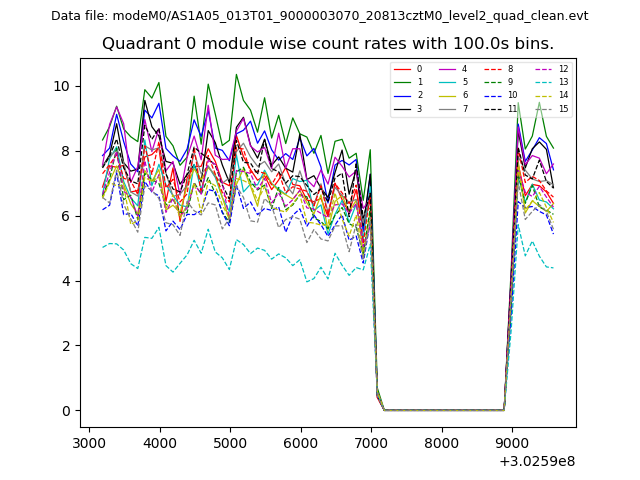 |
 |
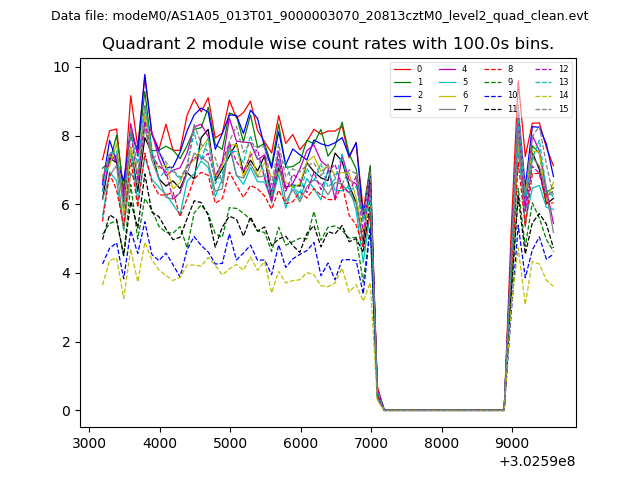
| Module-wise count rates for Quadrant B Data is divided into 100 sec bins |
 |
 |
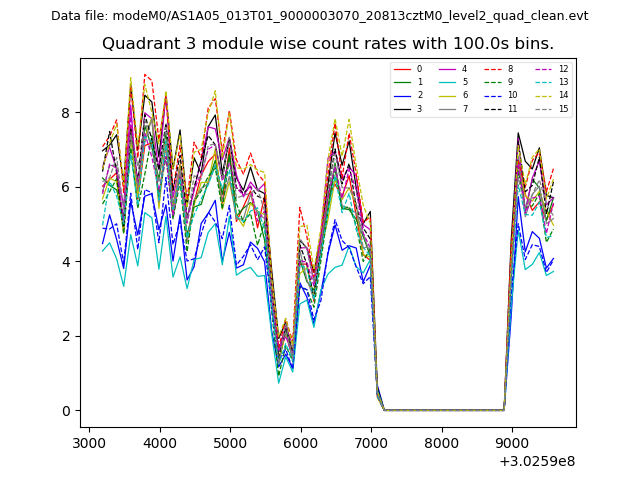
| Module-wise count rates for Quadrant C Data is divided into 100 sec bins |
 |
 |
| Module-wise count rates for Quadrant D Data is divided into 100 sec bins |
 |
 |
| Parameter | Plot |
|---|---|
| CZT HV Monitor | 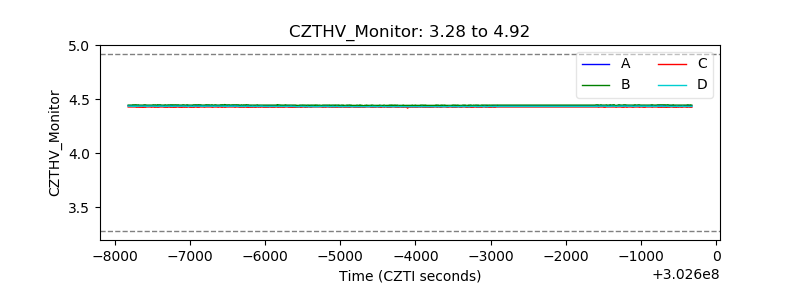 |
| D_VDD | 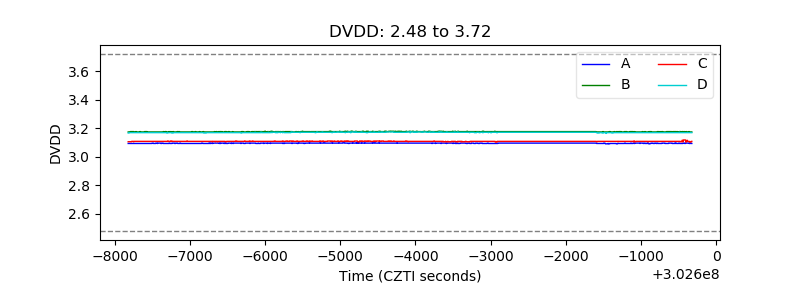 |
| Temperature 1 | 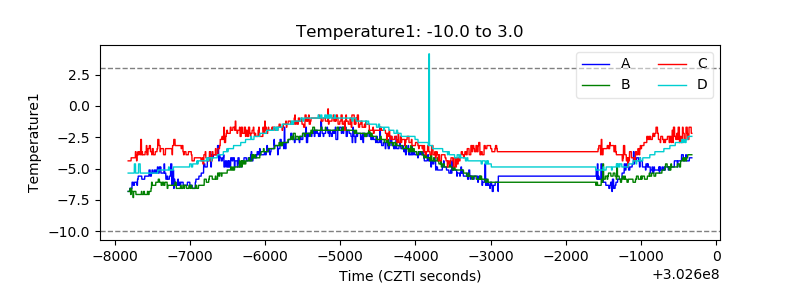 |
| Veto HV Monitor | 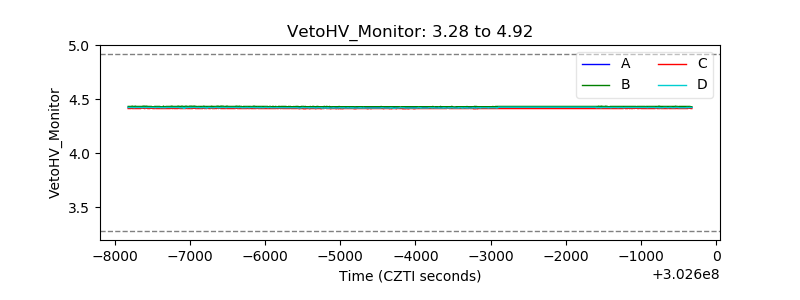 |
| Veto LLD | 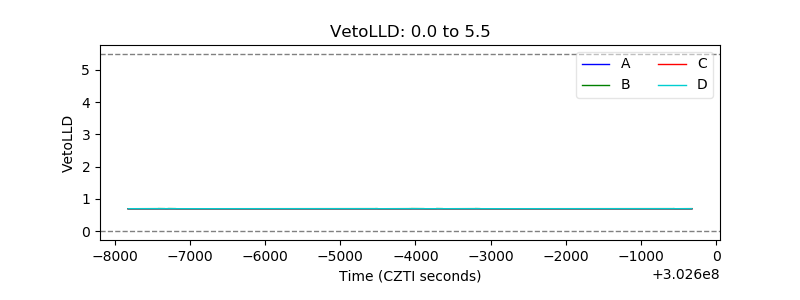 |
| Alpha Counter | 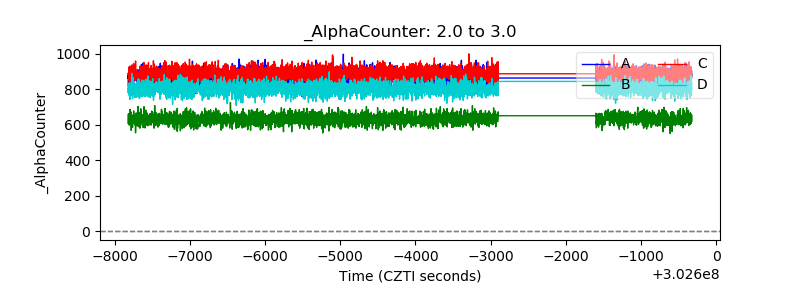 |
| _CPM_Rate | 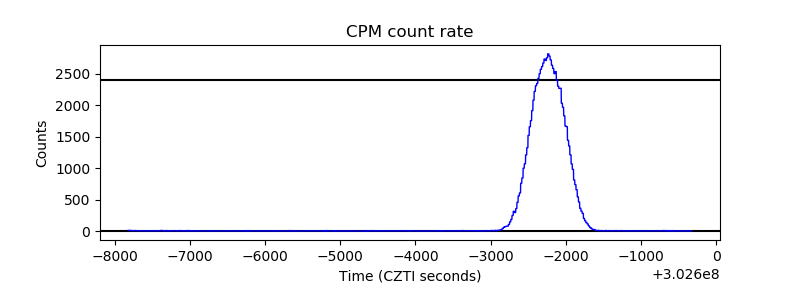 |
| CZT Counter | 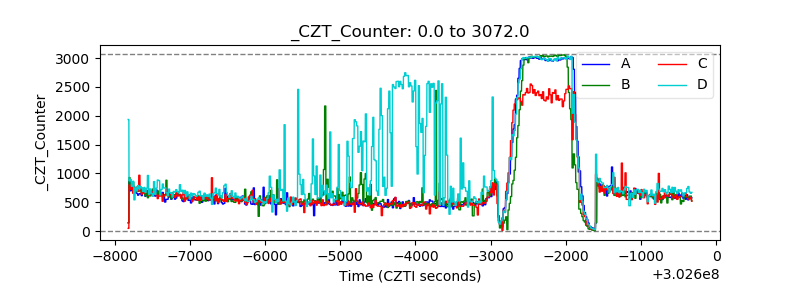 |
| +2.5 Volts monitor |  |
| +5 Volts monitor |  |
| _ROLL_ROT | 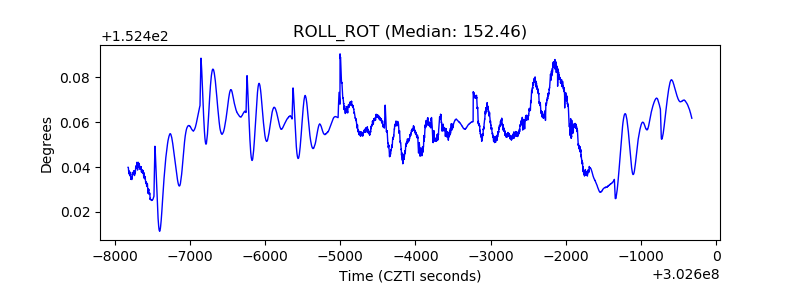 |
| _Roll_DEC | 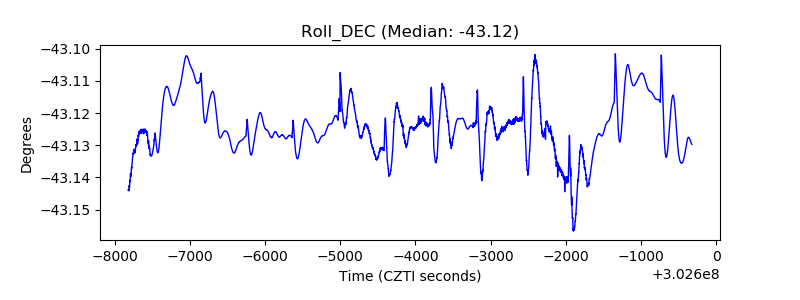 |
| _Roll_RA | 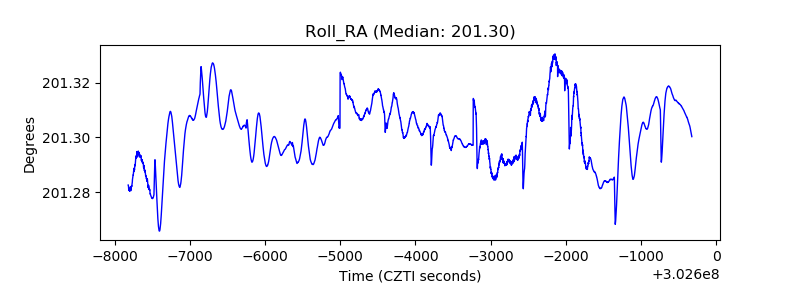 |
| Veto Counter | 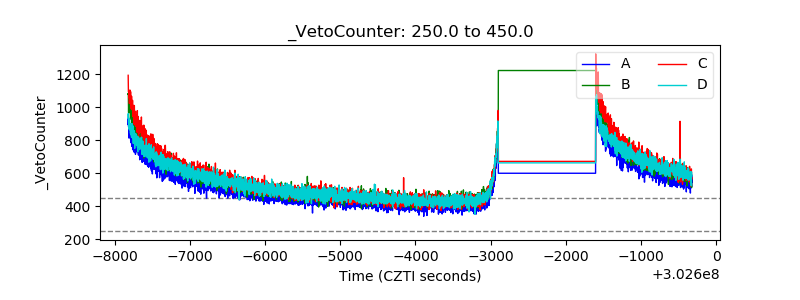 |