| Param | Original file | Final file |
|---|---|---|
| Filename | modeM0/AS1A05_013T01_9000003070_20815cztM0_level2.evt | modeM0/AS1A05_013T01_9000003070_20815cztM0_level2_quad_clean.evt |
| Size (bytes) | 487,031,040 | 115,349,760 |
| Size | 464.5 MB | 110.0 MB |
| Events in quadrant A | 3,042,103 | 800,823 |
| Events in quadrant B | 3,460,797 | 788,047 |
| Events in quadrant C | 3,210,657 | 756,336 |
| Events in quadrant D | 4,647,933 | 748,183 |
| Mode SS | |||
|---|---|---|---|
| Quadrant | BADHDUFLAG | Total packets | Discarded packets |
| A | 0 | 116 | 0 |
| B | 0 | 116 | 0 |
| C | 0 | 116 | 0 |
| D | 0 | 116 | 0 |
| Mode M0 | |||
|---|---|---|---|
| Quadrant | BADHDUFLAG | Total packets | Discarded packets |
| A | 0 | 12515 | 1 |
| B | 0 | 13981 | 1 |
| C | 0 | 13117 | 1 |
| D | 0 | 18293 | 1 |
| Mode M9 | |||
|---|---|---|---|
| Quadrant | BADHDUFLAG | Total packets | Discarded packets |
| A | 0 | 14 | 0 |
| B | 0 | 14 | 0 |
| C | 0 | 14 | 0 |
| D | 0 | 14 | 0 |
| Quadrant | Total seconds | Saturated seconds | Saturation percentage |
|---|---|---|---|
| A | 5728 | 106 | 1.850559% |
| B | 5729 | 150 | 2.618258% |
| C | 5728 | 237 | 4.137570% |
| D | 5728 | 200 | 3.491620% |
Noise dominated data is calculated using 1-second bins in cleaned event files. If a bin has >2000 counts, and if more than 50% of those come from <1% of pixels, then it is considered to be noise-dominated and hence unusable.
| Quadrant | # 1 sec bins | Bins with >0 counts | Bins with >2000 counts | High rate bins dominated by noise | Noise dominated (total time) | Noise dominated (detector-on time) | Marked lightcurve |
|---|---|---|---|---|---|---|---|
| A | 7063 | 5728 | 0 | 0 | 0.00% | 0.00% | 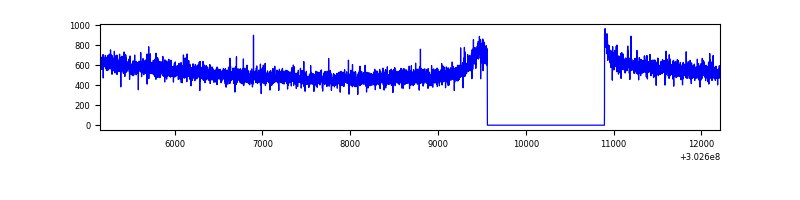 |
| B | 7064 | 5729 | 35 | 35 | 0.50% | 0.61% | 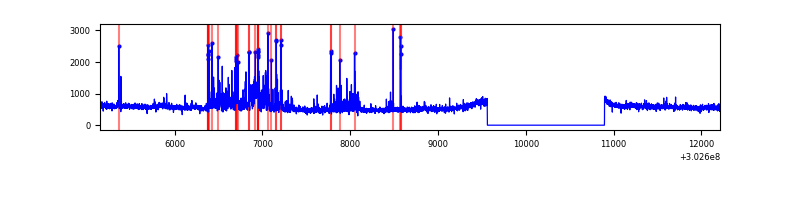 |
| C | 7063 | 5728 | 79 | 79 | 1.12% | 1.38% | 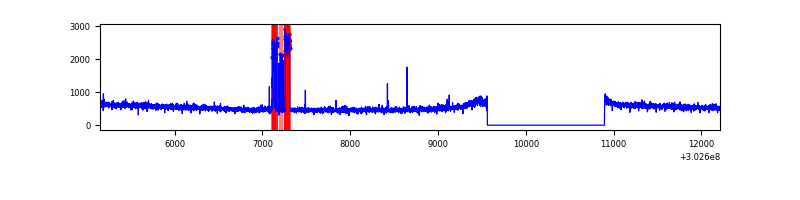 |
| D | 7063 | 5728 | 123 | 123 | 1.74% | 2.15% | 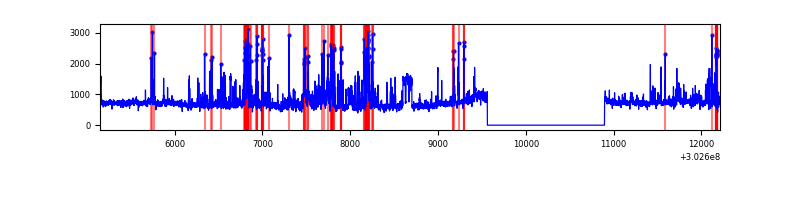 |
Top three noisy pixels from each quadrant. If the there are fewer than three noisy pixels in the level2.evt file, extra rows are filled as -1
| Pixel properties | Quadrant properties | ||||||
|---|---|---|---|---|---|---|---|
| Quadrant | DetID | PixID | Counts | Sigma | Mean | Median | Sigma |
| A | 13 | 252 | 7395 | 42.26 | 789 | 775 | 156.6 |
| A | 0 | 226 | 7022 | 39.88 | 789 | 775 | 156.6 |
| A | 3 | 137 | 5799 | 32.07 | 789 | 775 | 156.6 |
| B | 7 | 220 | 225465 | 1583.05 | 767 | 750 | 142.0 |
| B | 0 | 189 | 76789 | 535.67 | 767 | 750 | 142.0 |
| B | 4 | 216 | 38891 | 268.69 | 767 | 750 | 142.0 |
| C | 9 | 54 | 206482 | 1217.24 | 739 | 746 | 169.0 |
| C | 14 | 238 | 120137 | 706.38 | 739 | 746 | 169.0 |
| C | 13 | 61 | 5222 | 26.48 | 739 | 746 | 169.0 |
| D | 1 | 20 | 822127 | 4586.2 | 763 | 745 | 179.1 |
| D | 1 | 52 | 659781 | 3679.74 | 763 | 745 | 179.1 |
| D | 9 | 1 | 248773 | 1384.87 | 763 | 745 | 179.1 |
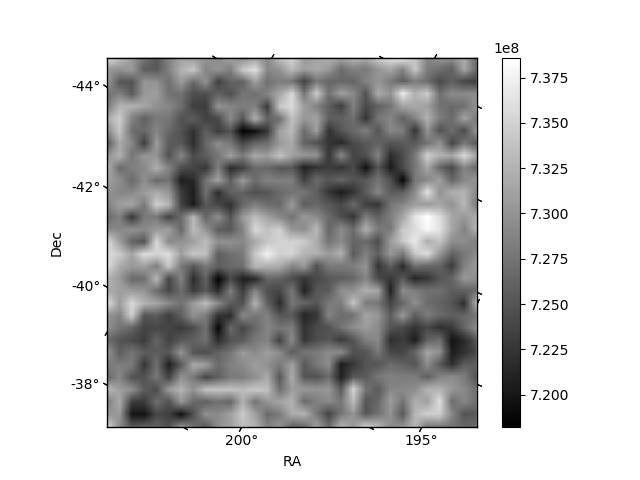
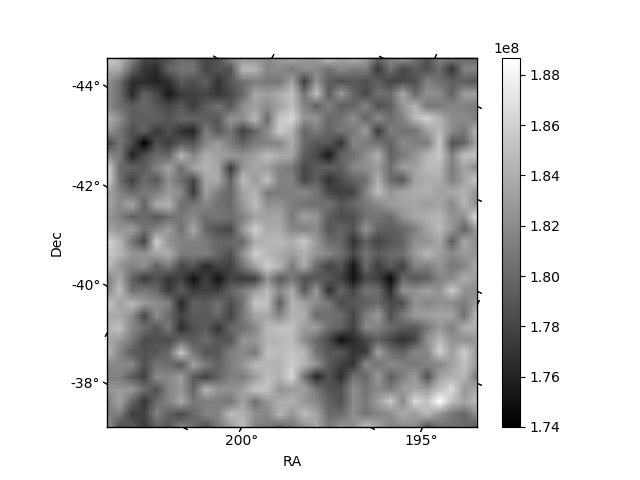
Histogram calculated using DETX and DETY for each event in the final _common_clean file
| Quadrant A | 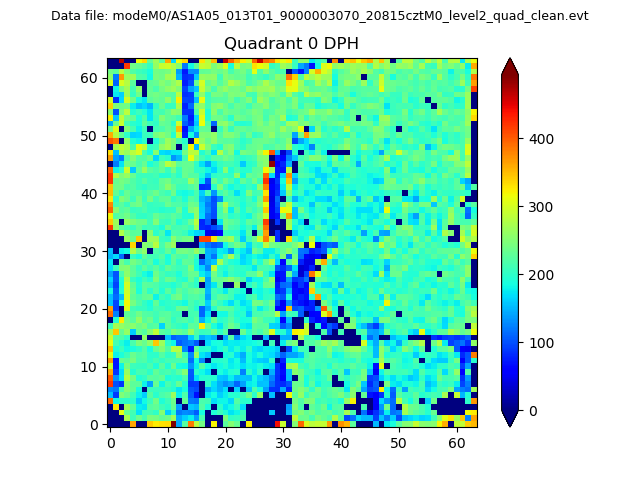 |
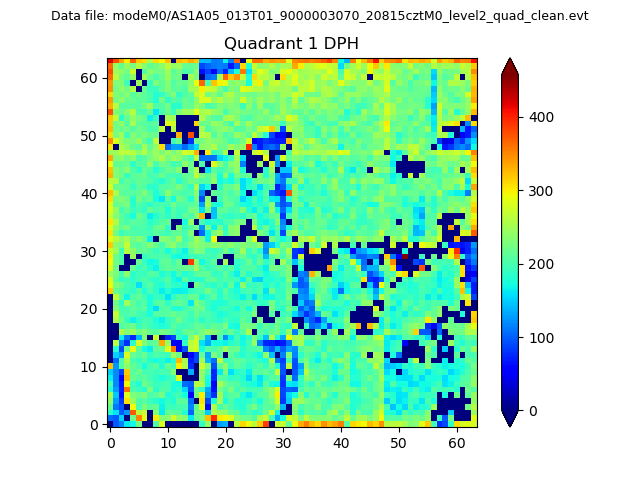 |
Quadrant B |
|---|---|---|---|
| Quadrant D | 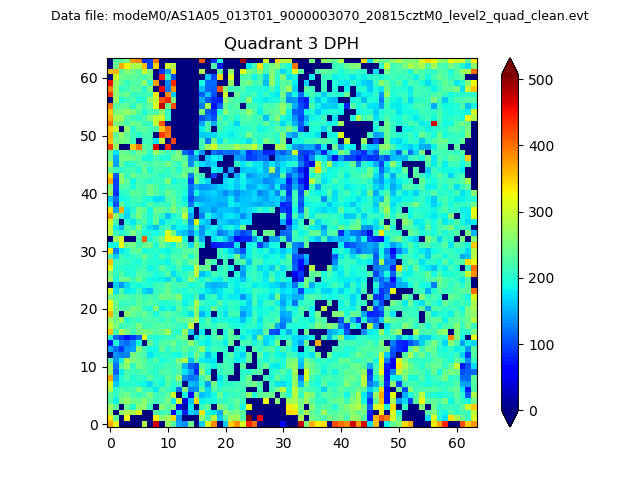 |
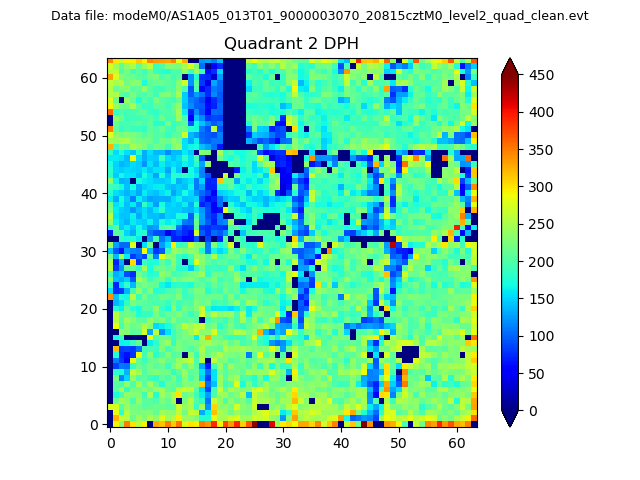 |
Quadrant C |
| Plot type | Count rate plots | Images |
|---|---|---|
| Comparison with Poisson distribution Blue bars denote a histogram of data divided into 1 sec bins. Red curve is a Poisson curve with rate = median count rate of data. |
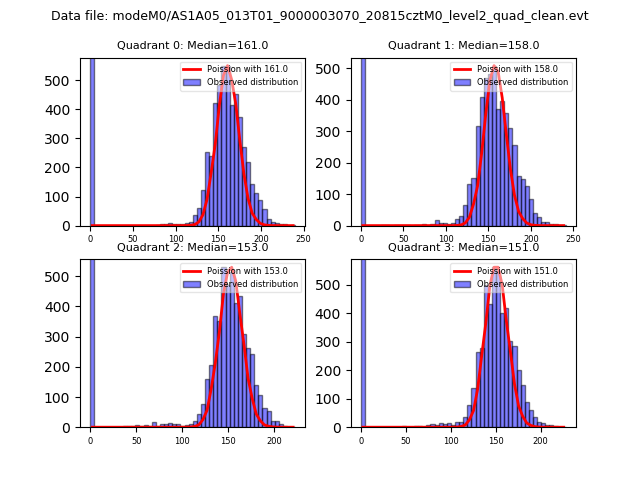 |
 |
| Quadrant-wise count rates Data is divided into 100 sec bins |
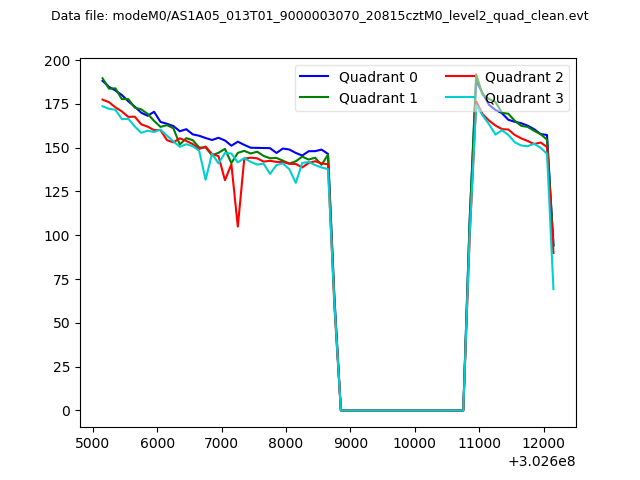 |
|
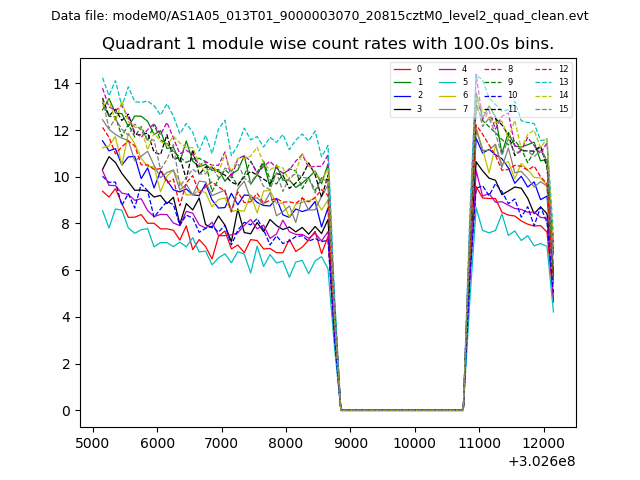
| Module-wise count rates for Quadrant A Data is divided into 100 sec bins |
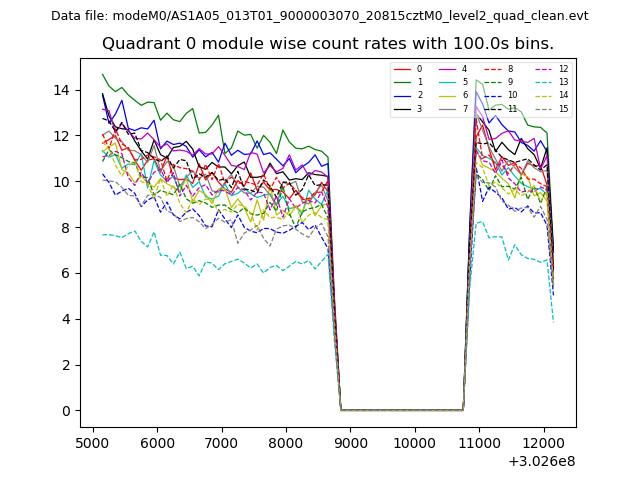 |
 |
| Module-wise count rates for Quadrant B Data is divided into 100 sec bins |
 |
 |
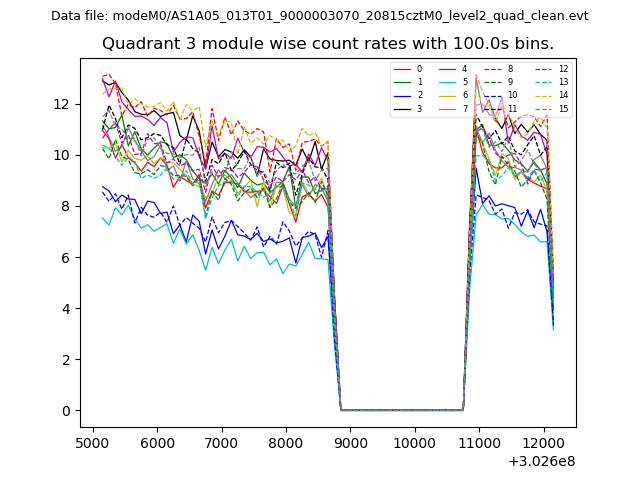
| Module-wise count rates for Quadrant C Data is divided into 100 sec bins |
 |
 |
| Module-wise count rates for Quadrant D Data is divided into 100 sec bins |
 |
 |
| Parameter | Plot |
|---|---|
| CZT HV Monitor | 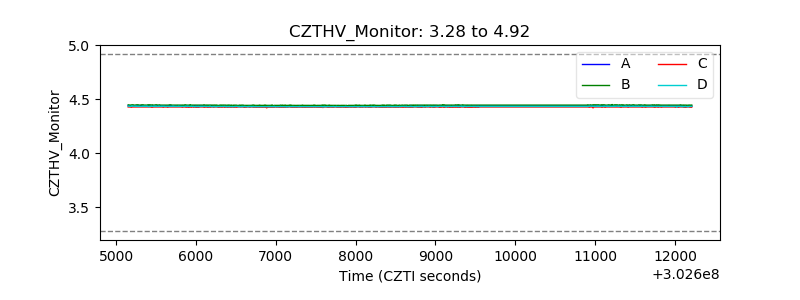 |
| D_VDD | 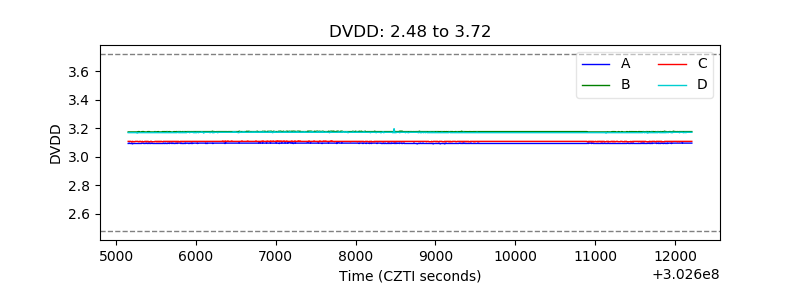 |
| Temperature 1 | 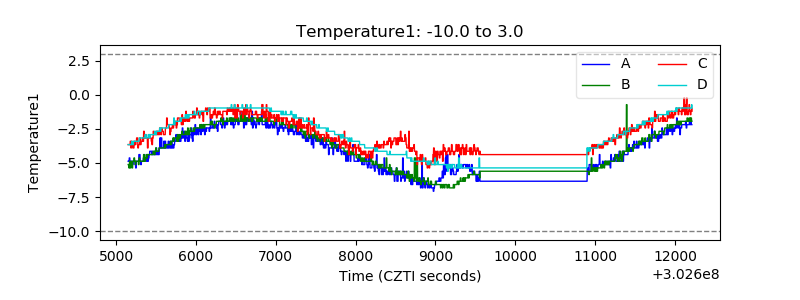 |
| Veto HV Monitor | 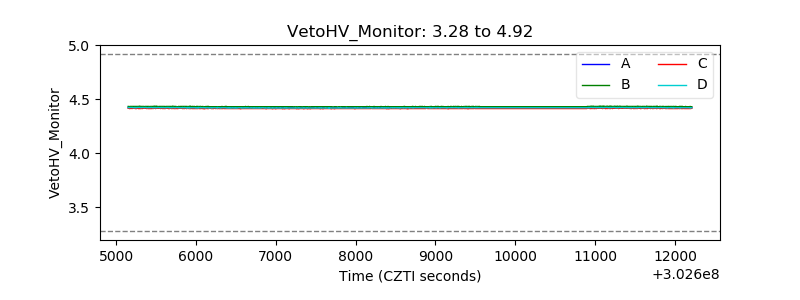 |
| Veto LLD | 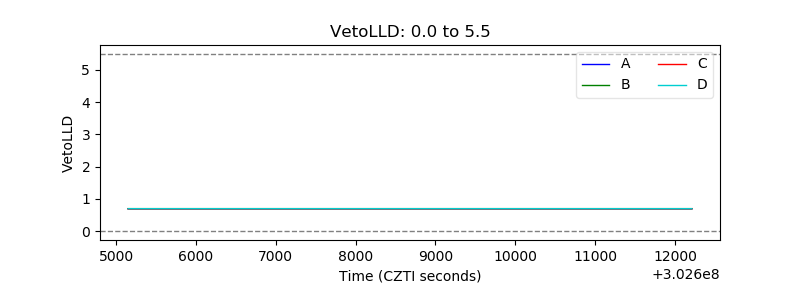 |
| Alpha Counter | 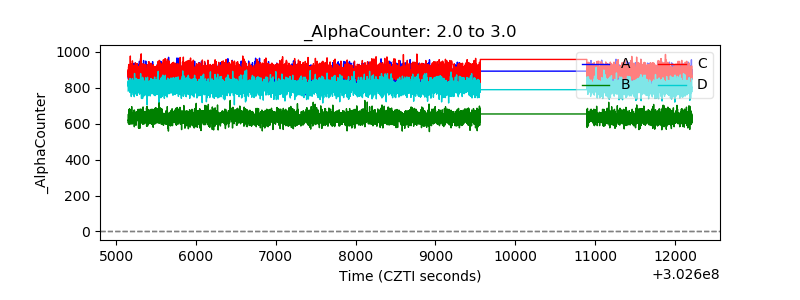 |
| _CPM_Rate | 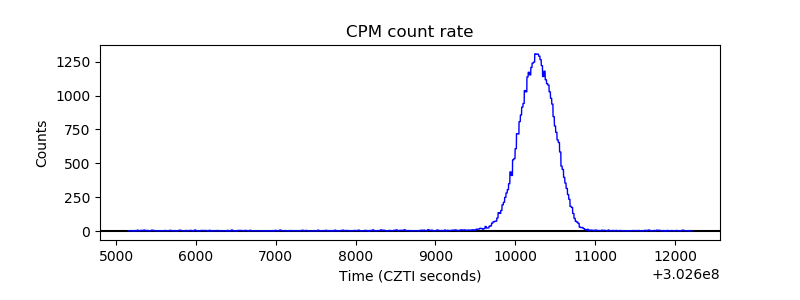 |
| CZT Counter | 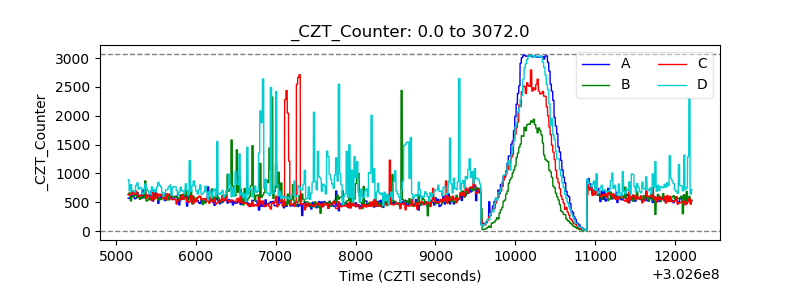 |
| +2.5 Volts monitor |  |
| +5 Volts monitor |  |
| _ROLL_ROT | 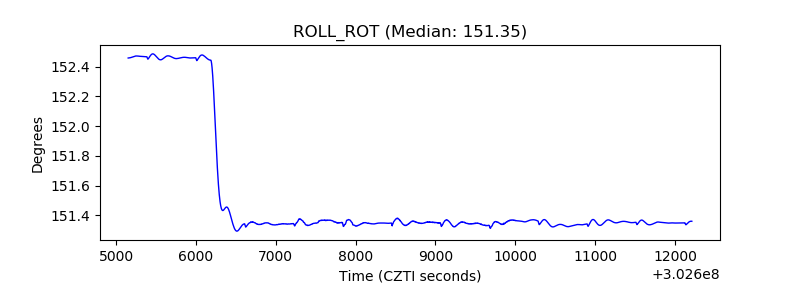 |
| _Roll_DEC | 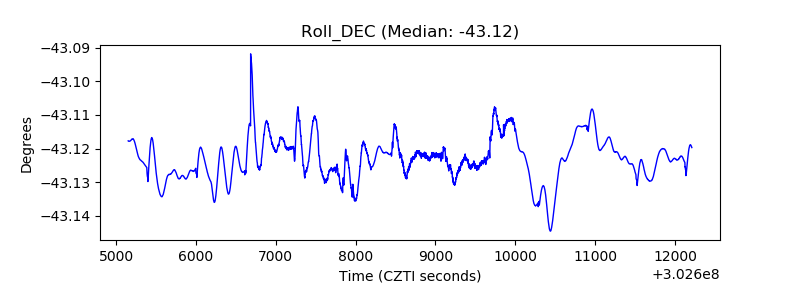 |
| _Roll_RA | 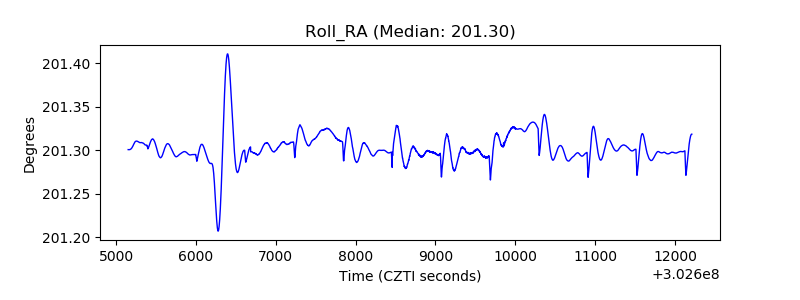 |
| Veto Counter | 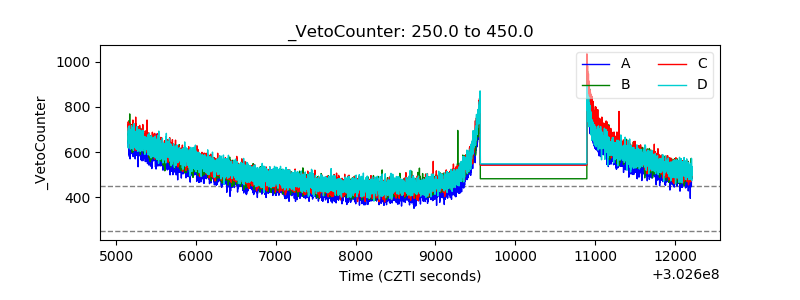 |