| Param | Original file | Final file |
|---|---|---|
| Filename | modeM0/AS1A05_013T01_9000003070_20818cztM0_level2.evt | modeM0/AS1A05_013T01_9000003070_20818cztM0_level2_quad_clean.evt |
| Size (bytes) | 520,873,920 | 99,293,760 |
| Size | 496.7 MB | 94.7 MB |
| Events in quadrant A | 3,199,157 | 654,075 |
| Events in quadrant B | 3,927,200 | 638,148 |
| Events in quadrant C | 3,701,629 | 624,608 |
| Events in quadrant D | 4,484,631 | 615,608 |
| Mode SS | |||
|---|---|---|---|
| Quadrant | BADHDUFLAG | Total packets | Discarded packets |
| A | 0 | 138 | 0 |
| B | 0 | 138 | 0 |
| C | 0 | 138 | 0 |
| D | 0 | 138 | 0 |
| Mode M0 | |||
|---|---|---|---|
| Quadrant | BADHDUFLAG | Total packets | Discarded packets |
| A | 0 | 13967 | 1 |
| B | 0 | 16057 | 1 |
| C | 0 | 15396 | 1 |
| D | 0 | 17738 | 4 |
| Mode M9 | |||
|---|---|---|---|
| Quadrant | BADHDUFLAG | Total packets | Discarded packets |
| A | 0 | 4 | 0 |
| B | 0 | 4 | 0 |
| C | 0 | 4 | 0 |
| D | 0 | 4 | 0 |
| Quadrant | Total seconds | Saturated seconds | Saturation percentage |
|---|---|---|---|
| A | 6809 | 44 | 0.646204% |
| B | 6810 | 165 | 2.422907% |
| C | 6810 | 146 | 2.143906% |
| D | 6809 | 165 | 2.423263% |
Noise dominated data is calculated using 1-second bins in cleaned event files. If a bin has >2000 counts, and if more than 50% of those come from <1% of pixels, then it is considered to be noise-dominated and hence unusable.
| Quadrant | # 1 sec bins | Bins with >0 counts | Bins with >2000 counts | High rate bins dominated by noise | Noise dominated (total time) | Noise dominated (detector-on time) | Marked lightcurve |
|---|---|---|---|---|---|---|---|
| A | 7214 | 6809 | 0 | 0 | 0.00% | 0.00% | 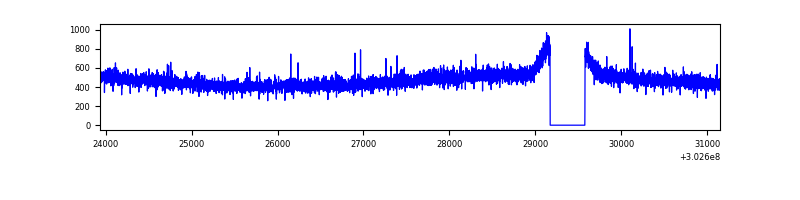 |
| B | 7215 | 6810 | 75 | 75 | 1.04% | 1.10% | 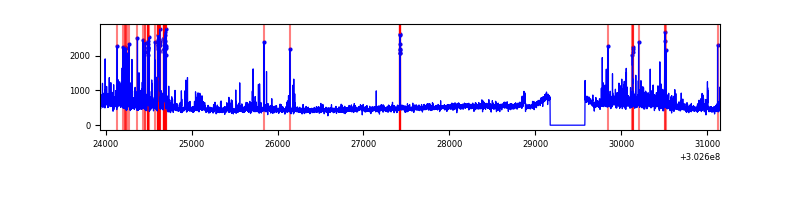 |
| C | 7215 | 6811 | 66 | 66 | 0.91% | 0.97% | 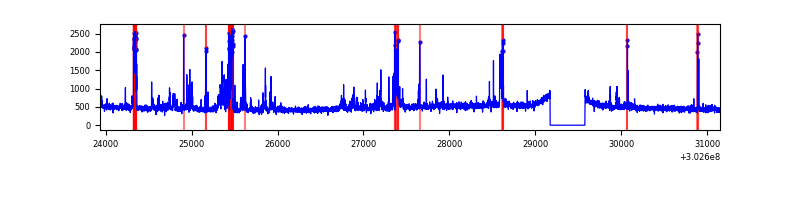 |
| D | 7213 | 6809 | 116 | 116 | 1.61% | 1.70% | 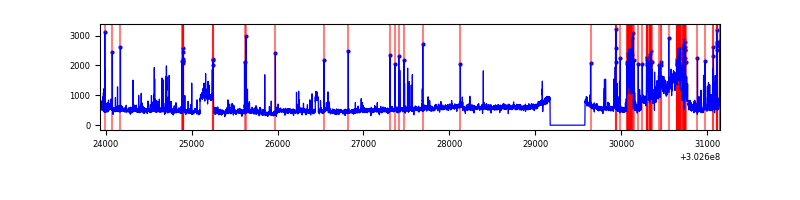 |
Top three noisy pixels from each quadrant. If the there are fewer than three noisy pixels in the level2.evt file, extra rows are filled as -1
| Pixel properties | Quadrant properties | ||||||
|---|---|---|---|---|---|---|---|
| Quadrant | DetID | PixID | Counts | Sigma | Mean | Median | Sigma |
| A | 0 | 226 | 7133 | 37.43 | 832 | 815 | 168.8 |
| A | 3 | 137 | 6713 | 34.94 | 832 | 815 | 168.8 |
| A | 12 | 194 | 5957 | 30.46 | 832 | 815 | 168.8 |
| B | 7 | 220 | 441864 | 2876.25 | 816 | 797 | 153.3 |
| B | 0 | 189 | 67942 | 437.86 | 816 | 797 | 153.3 |
| B | 4 | 171 | 61817 | 397.92 | 816 | 797 | 153.3 |
| C | 9 | 54 | 521490 | 2852.29 | 783 | 789 | 182.6 |
| C | 14 | 238 | 122758 | 668.12 | 783 | 789 | 182.6 |
| C | 13 | 61 | 5421 | 25.37 | 783 | 789 | 182.6 |
| D | 1 | 20 | 648006 | 3348.02 | 798 | 776 | 193.3 |
| D | 1 | 52 | 467780 | 2415.74 | 798 | 776 | 193.3 |
| D | 9 | 1 | 236813 | 1220.98 | 798 | 776 | 193.3 |
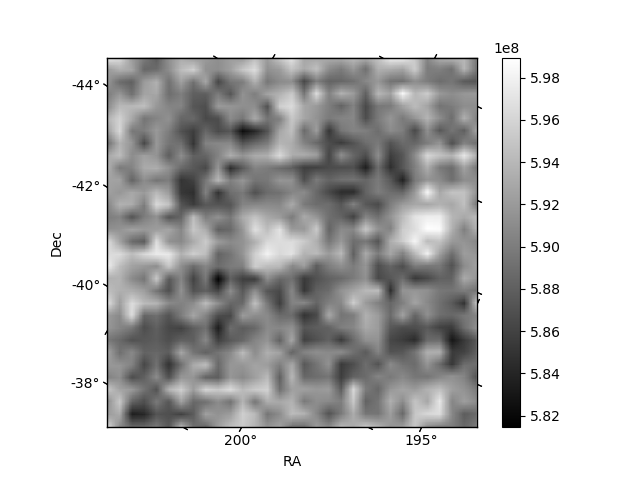
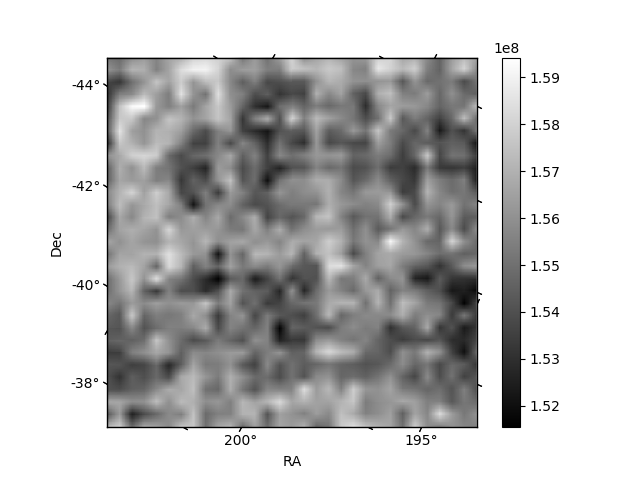
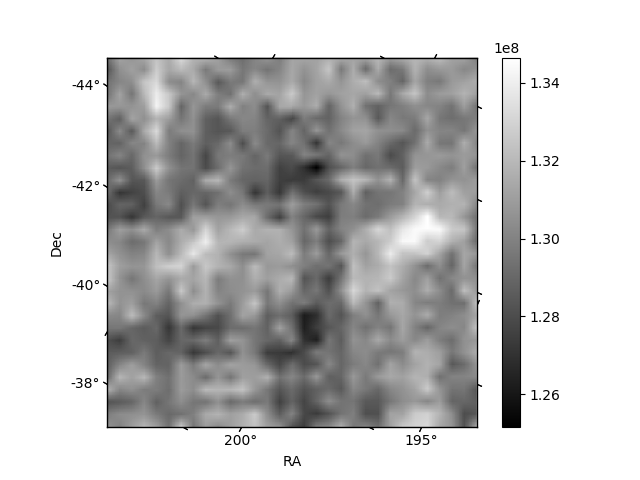
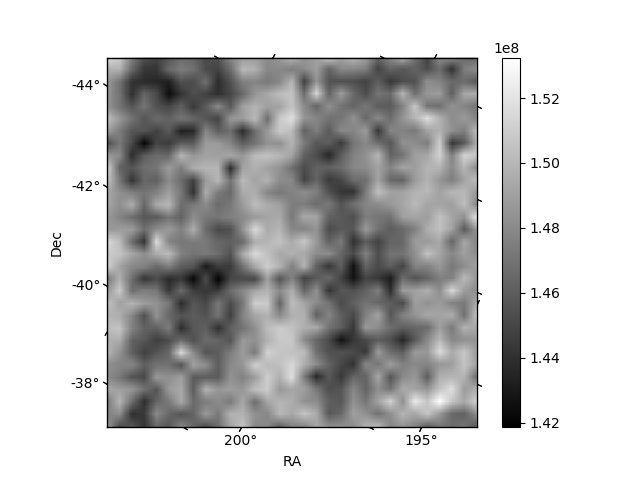
Histogram calculated using DETX and DETY for each event in the final _common_clean file
| Quadrant A | 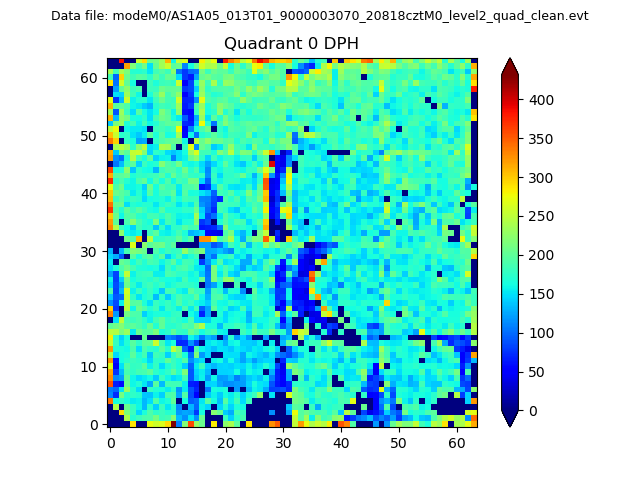 |
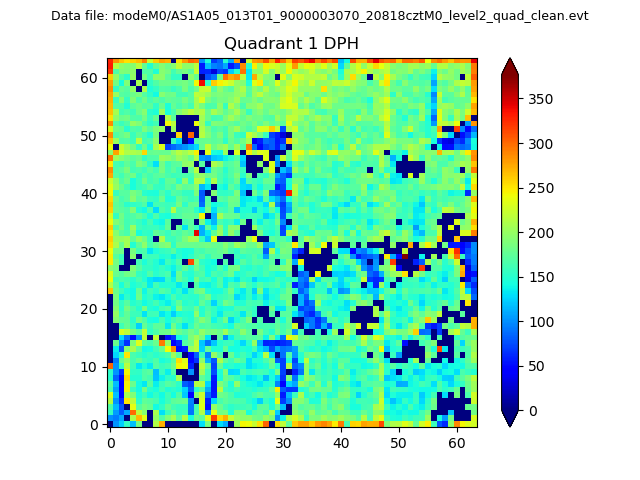 |
Quadrant B |
|---|---|---|---|
| Quadrant D | 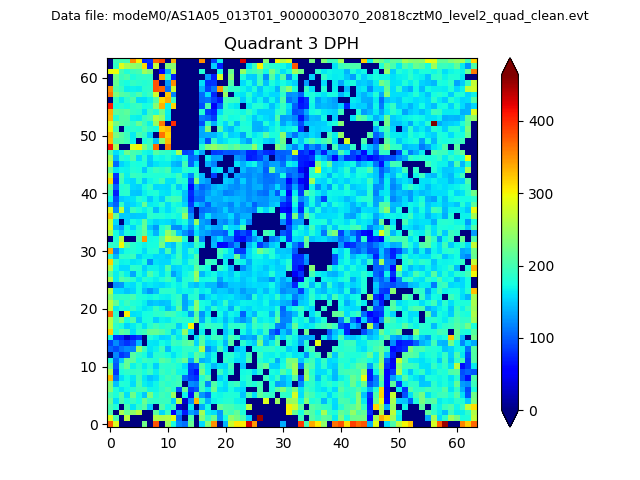 |
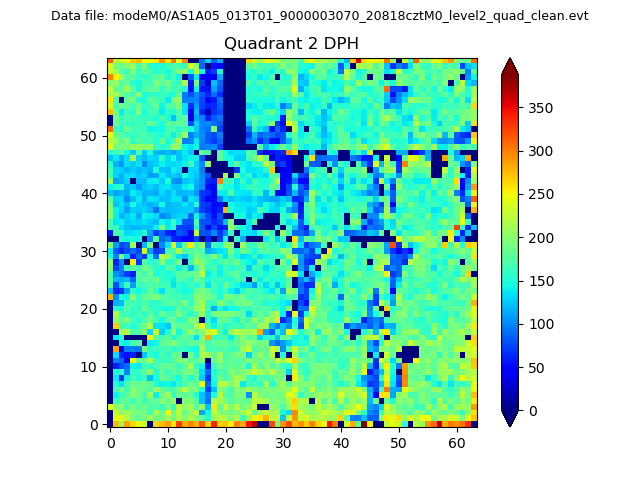 |
Quadrant C |
| Plot type | Count rate plots | Images |
|---|---|---|
| Comparison with Poisson distribution Blue bars denote a histogram of data divided into 1 sec bins. Red curve is a Poisson curve with rate = median count rate of data. |
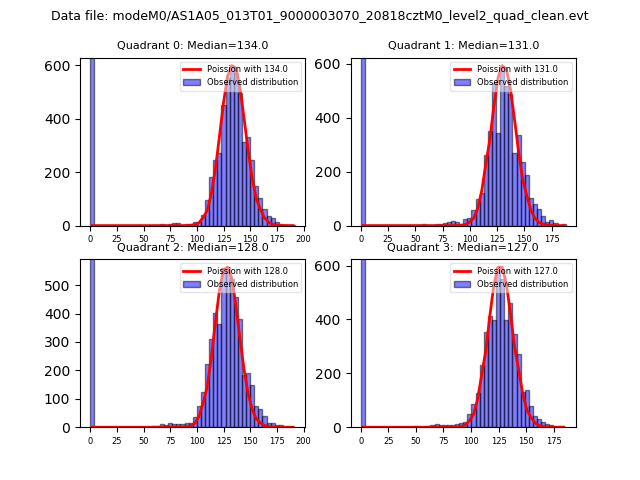 |
 |
| Quadrant-wise count rates Data is divided into 100 sec bins |
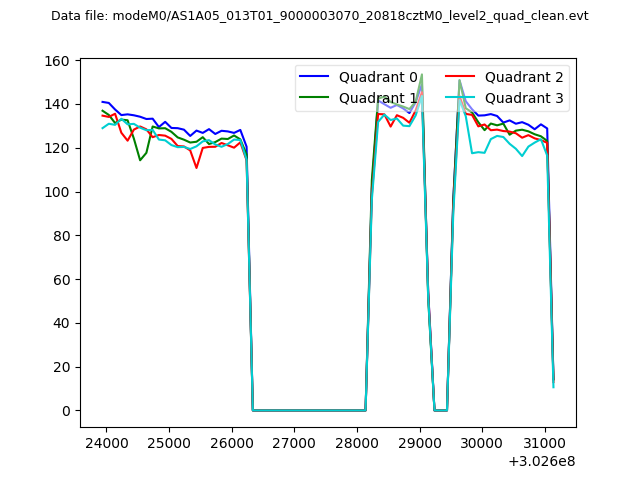 |
|
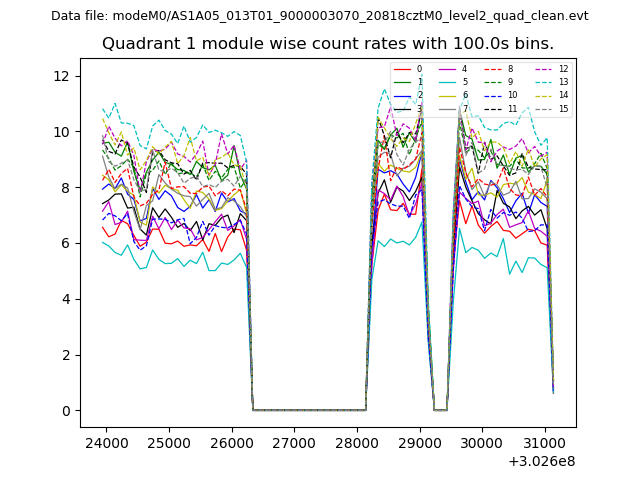
| Module-wise count rates for Quadrant A Data is divided into 100 sec bins |
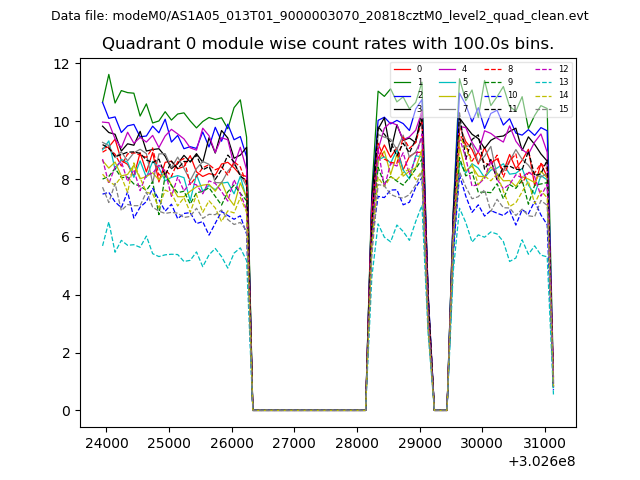 |
 |
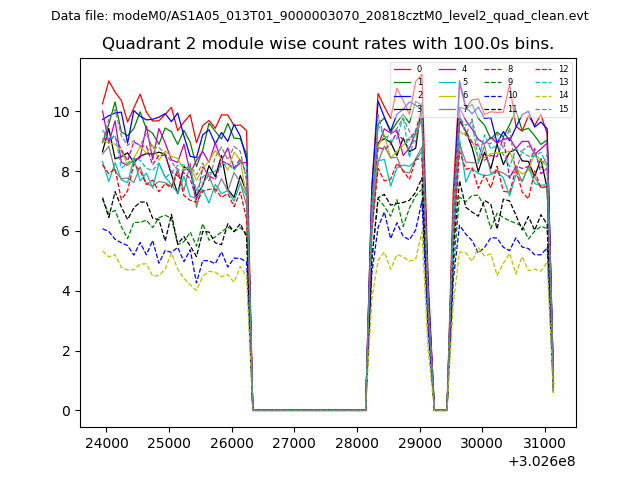
| Module-wise count rates for Quadrant B Data is divided into 100 sec bins |
 |
 |
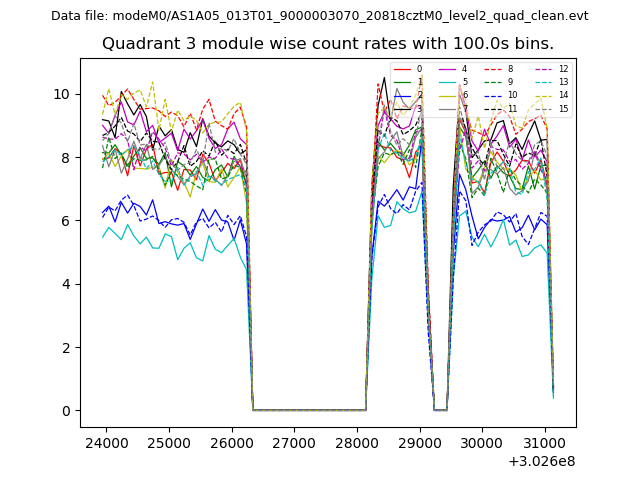
| Module-wise count rates for Quadrant C Data is divided into 100 sec bins |
 |
 |
| Module-wise count rates for Quadrant D Data is divided into 100 sec bins |
 |
 |
| Parameter | Plot |
|---|---|
| CZT HV Monitor | 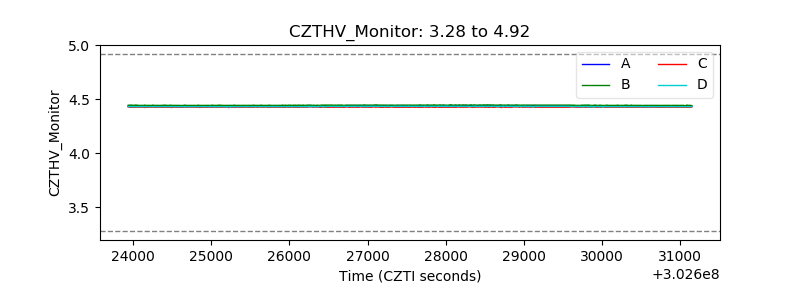 |
| D_VDD | 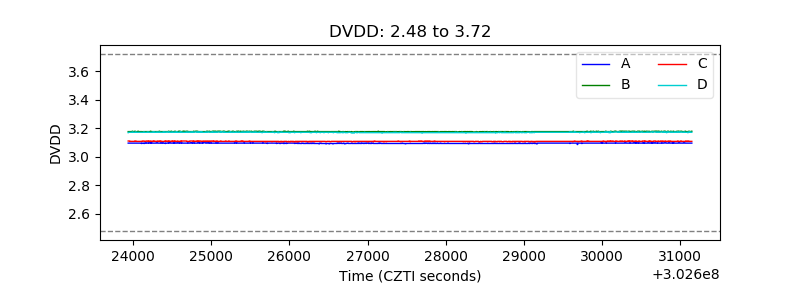 |
| Temperature 1 | 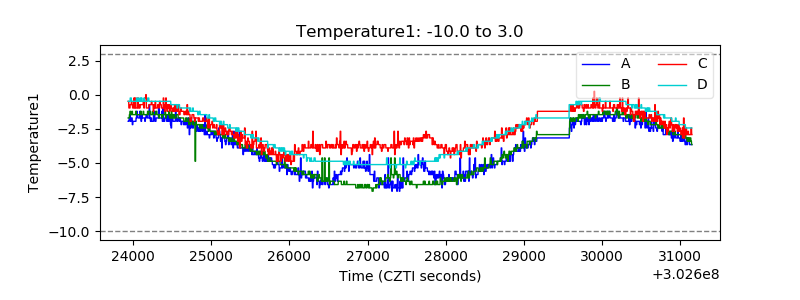 |
| Veto HV Monitor | 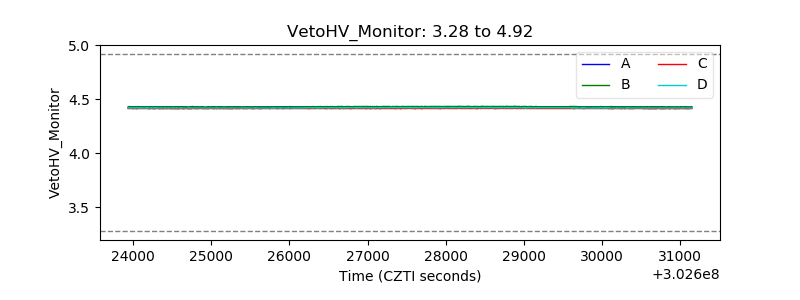 |
| Veto LLD | 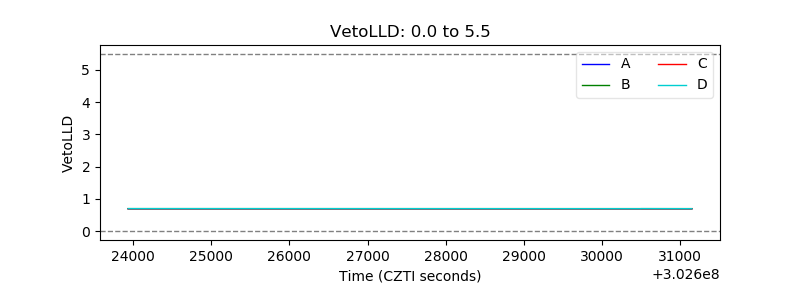 |
| Alpha Counter | 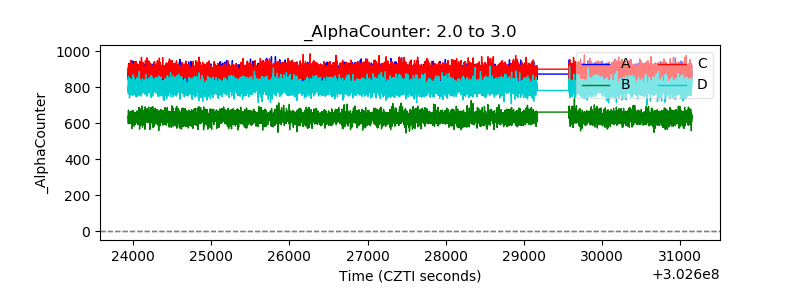 |
| _CPM_Rate | 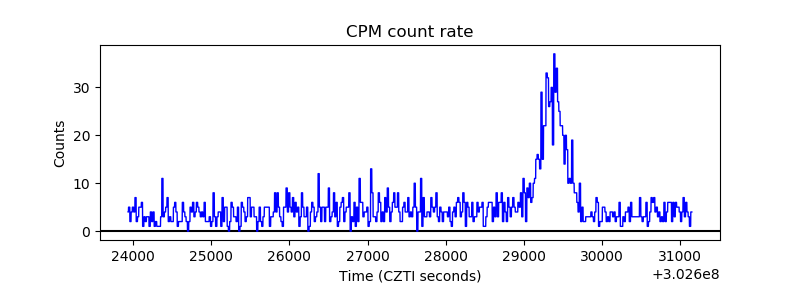 |
| CZT Counter | 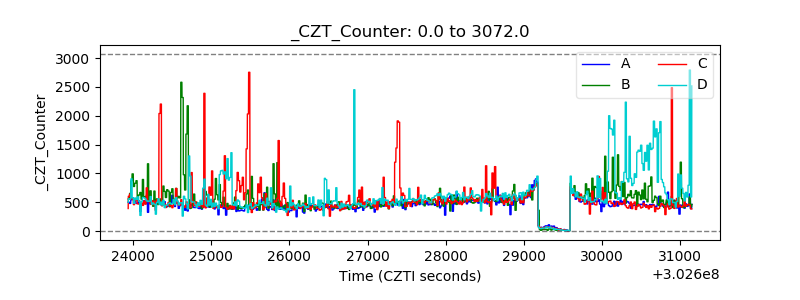 |
| +2.5 Volts monitor |  |
| +5 Volts monitor |  |
| _ROLL_ROT |  |
| _Roll_DEC | 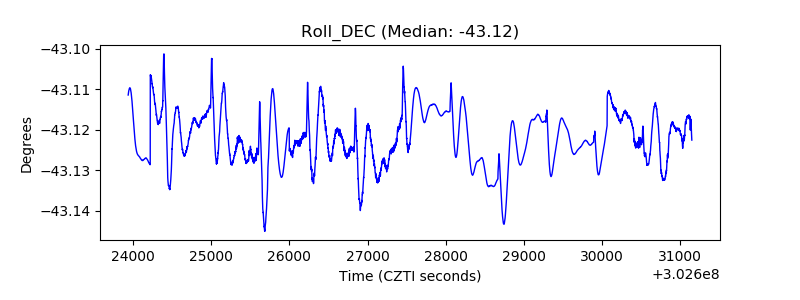 |
| _Roll_RA | 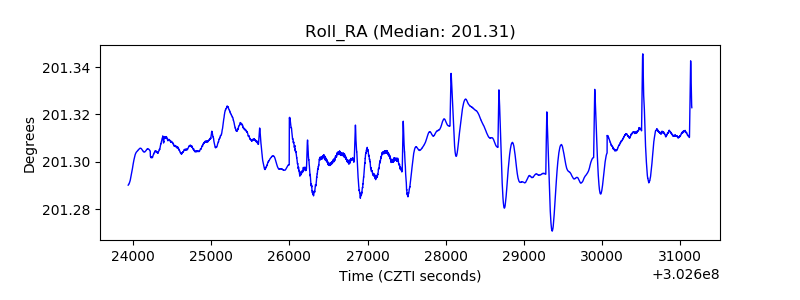 |
| Veto Counter | 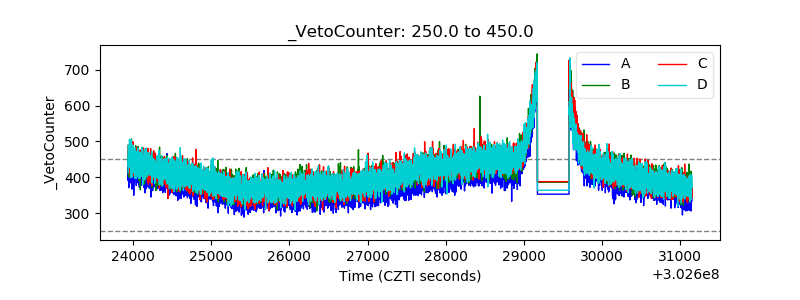 |