| Param | Original file | Final file |
|---|---|---|
| Filename | modeM0/AS1A05_013T01_9000003070_20820cztM0_level2.evt | modeM0/AS1A05_013T01_9000003070_20820cztM0_level2_quad_clean.evt |
| Size (bytes) | 503,271,360 | 87,252,480 |
| Size | 480.0 MB | 83.2 MB |
| Events in quadrant A | 2,933,474 | 579,643 |
| Events in quadrant B | 3,318,329 | 571,126 |
| Events in quadrant C | 2,971,014 | 557,559 |
| Events in quadrant D | 5,589,076 | 491,943 |
| Mode SS | |||
|---|---|---|---|
| Quadrant | BADHDUFLAG | Total packets | Discarded packets |
| A | 0 | 140 | 12 |
| B | 0 | 140 | 12 |
| C | 0 | 140 | 10 |
| D | 0 | 140 | 12 |
| Mode M0 | |||
|---|---|---|---|
| Quadrant | BADHDUFLAG | Total packets | Discarded packets |
| A | 0 | 13931 | 983 |
| B | 0 | 14979 | 1041 |
| C | 0 | 13998 | 988 |
| D | 0 | 23028 | 2050 |
| Mode M9 | |||
|---|---|---|---|
| Quadrant | BADHDUFLAG | Total packets | Discarded packets |
| A | 0 | 3 | 0 |
| B | 0 | 3 | 1 |
| C | 0 | 3 | 0 |
| D | 0 | 3 | 0 |
| Quadrant | Total seconds | Saturated seconds | Saturation percentage |
|---|---|---|---|
| A | 6351 | 32 | 0.503858% |
| B | 6342 | 101 | 1.592558% |
| C | 6354 | 47 | 0.739692% |
| D | 6263 | 660 | 10.538081% |
Noise dominated data is calculated using 1-second bins in cleaned event files. If a bin has >2000 counts, and if more than 50% of those come from <1% of pixels, then it is considered to be noise-dominated and hence unusable.
| Quadrant | # 1 sec bins | Bins with >0 counts | Bins with >2000 counts | High rate bins dominated by noise | Noise dominated (total time) | Noise dominated (detector-on time) | Marked lightcurve |
|---|---|---|---|---|---|---|---|
| A | 7055 | 6439 | 0 | 0 | 0.00% | 0.00% | 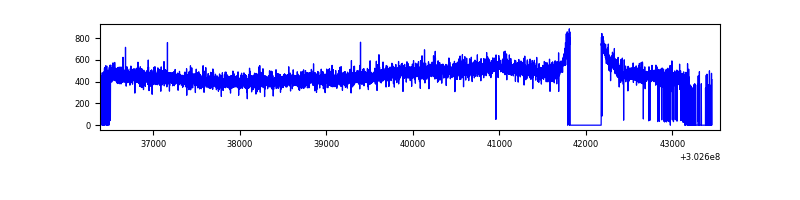 |
| B | 7162 | 6450 | 31 | 31 | 0.43% | 0.48% | 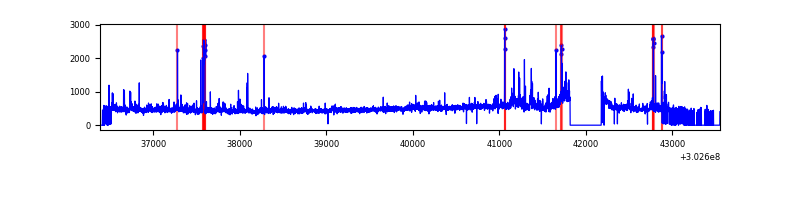 |
| C | 7073 | 6453 | 0 | 0 | 0.00% | 0.00% | 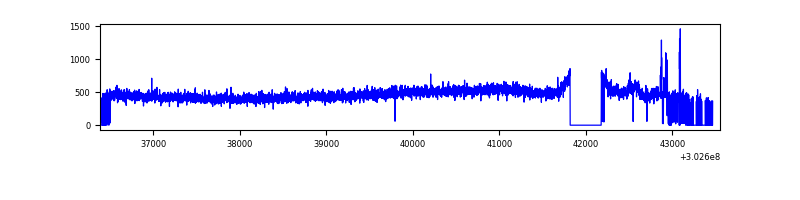 |
| D | 7059 | 6342 | 596 | 596 | 8.44% | 9.40% | 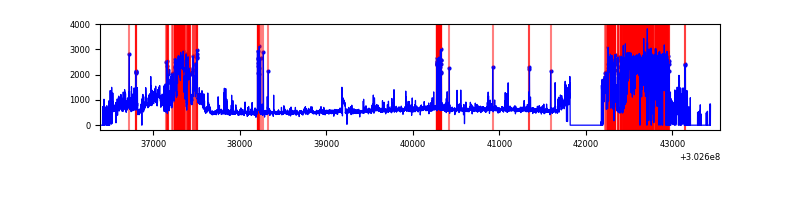 |
Top three noisy pixels from each quadrant. If the there are fewer than three noisy pixels in the level2.evt file, extra rows are filled as -1
| Pixel properties | Quadrant properties | ||||||
|---|---|---|---|---|---|---|---|
| Quadrant | DetID | PixID | Counts | Sigma | Mean | Median | Sigma |
| A | 5 | 203 | 7032 | 40.48 | 761 | 745 | 155.3 |
| A | 0 | 226 | 6707 | 38.38 | 761 | 745 | 155.3 |
| A | 3 | 137 | 6034 | 34.05 | 761 | 745 | 155.3 |
| B | 7 | 220 | 80913 | 562.29 | 750 | 731 | 142.6 |
| B | 4 | 171 | 64087 | 444.29 | 750 | 731 | 142.6 |
| B | 0 | 219 | 48986 | 338.39 | 750 | 731 | 142.6 |
| C | 14 | 238 | 113918 | 665.69 | 720 | 727 | 170.0 |
| C | 9 | 54 | 23213 | 132.24 | 720 | 727 | 170.0 |
| C | 10 | 91 | 21657 | 123.09 | 720 | 727 | 170.0 |
| D | 1 | 52 | 1489529 | 8932.54 | 687 | 667 | 166.7 |
| D | 1 | 20 | 578080 | 3464.23 | 687 | 667 | 166.7 |
| D | 7 | 38 | 329544 | 1973.12 | 687 | 667 | 166.7 |
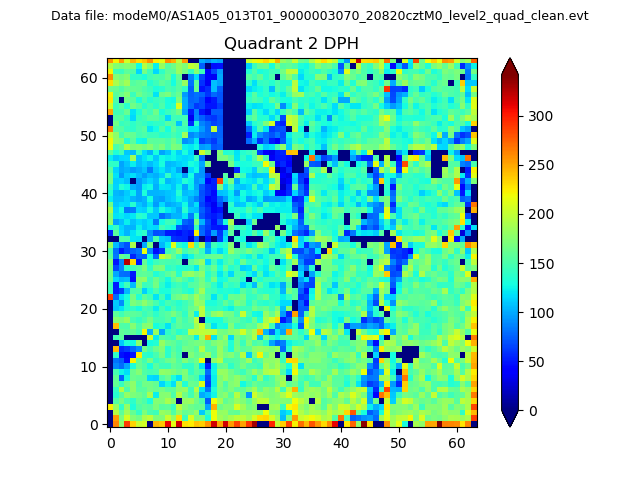
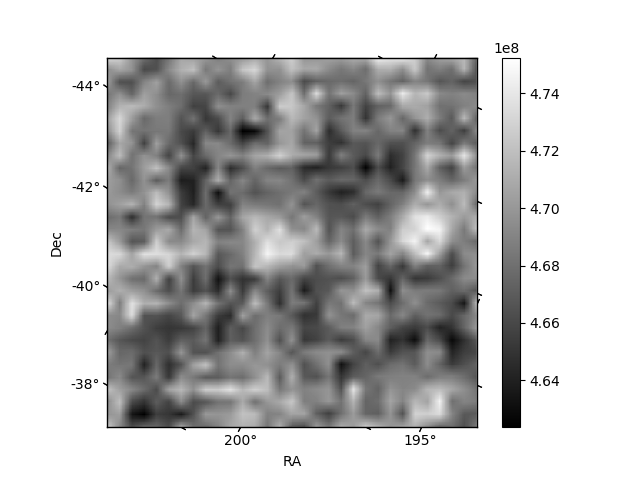
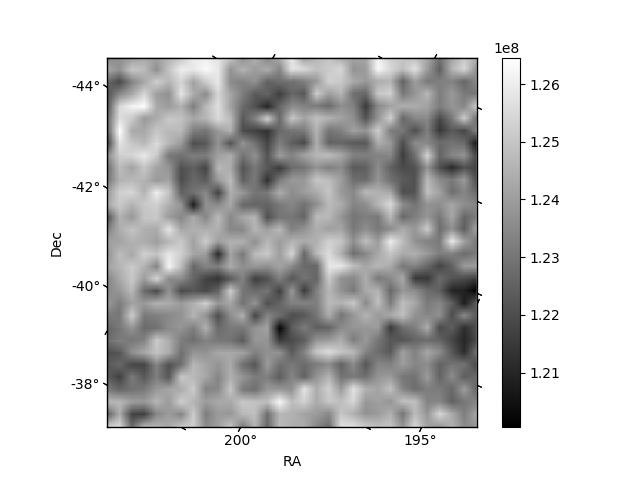
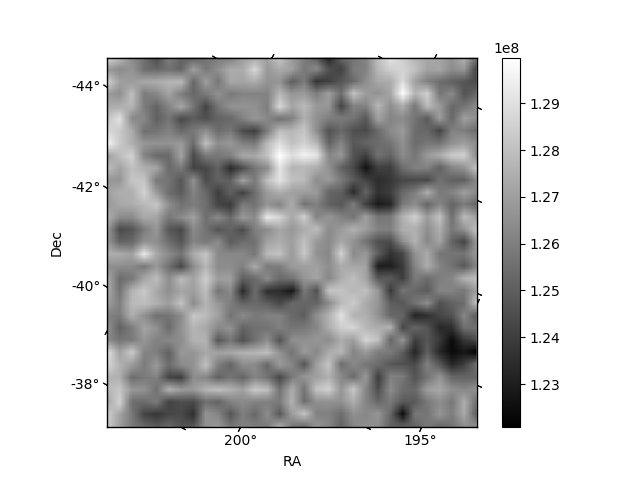
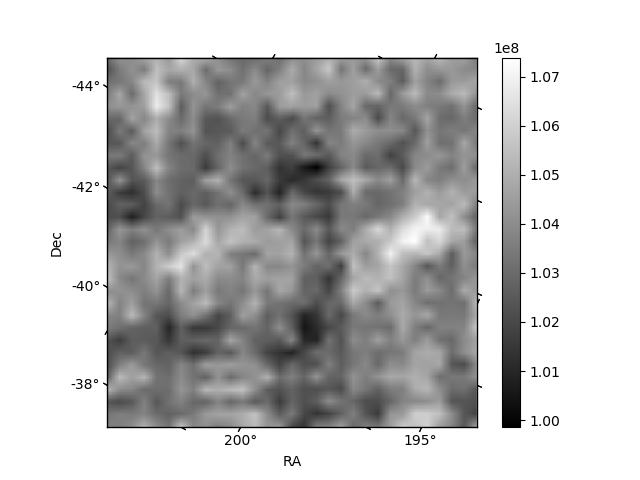
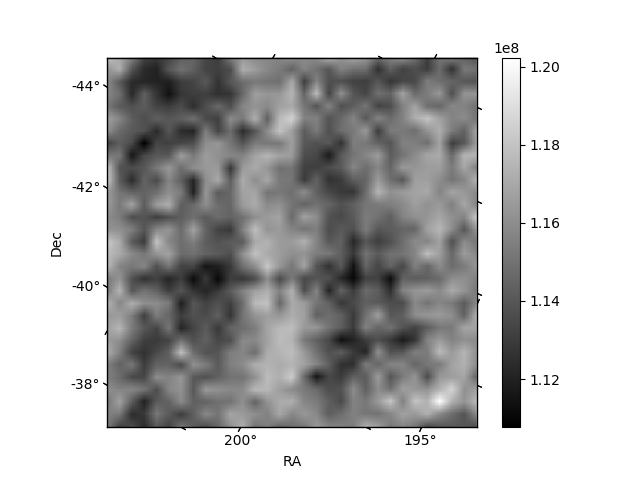
Histogram calculated using DETX and DETY for each event in the final _common_clean file
| Quadrant A | 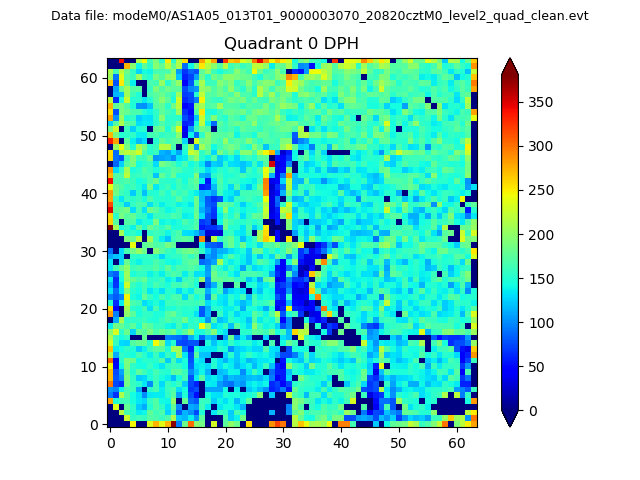 |
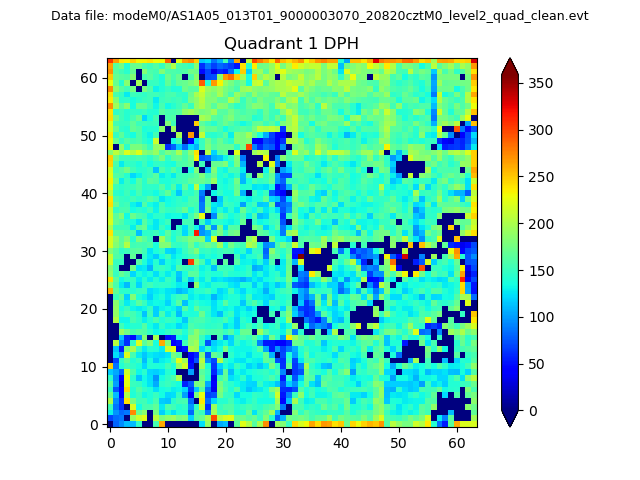 |
Quadrant B |
|---|---|---|---|
| Quadrant D | 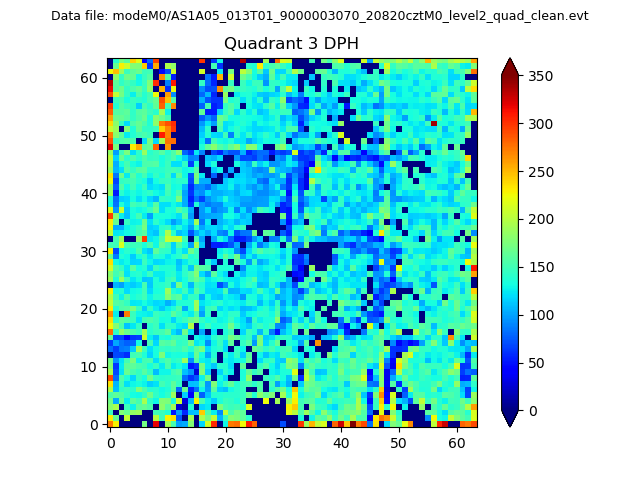 |
 |
Quadrant C |
| Plot type | Count rate plots | Images |
|---|---|---|
| Comparison with Poisson distribution Blue bars denote a histogram of data divided into 1 sec bins. Red curve is a Poisson curve with rate = median count rate of data. |
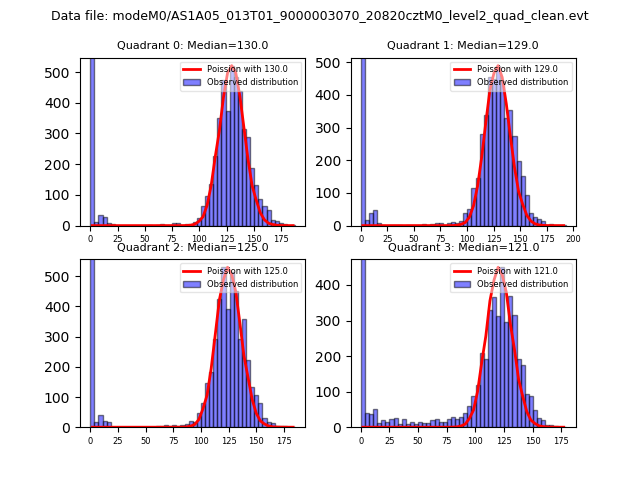 |
 |
| Quadrant-wise count rates Data is divided into 100 sec bins |
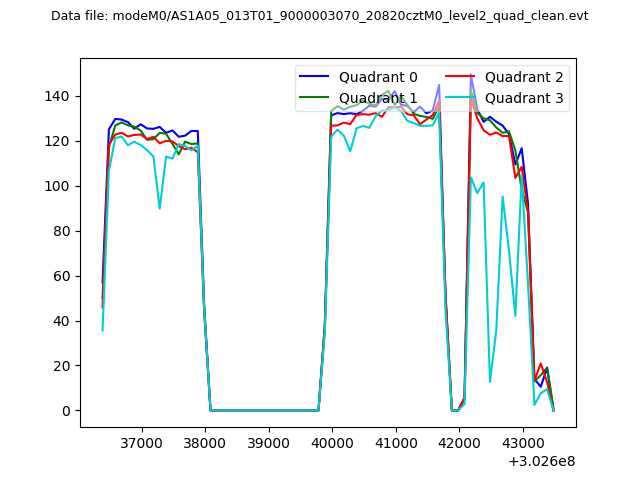 |
|
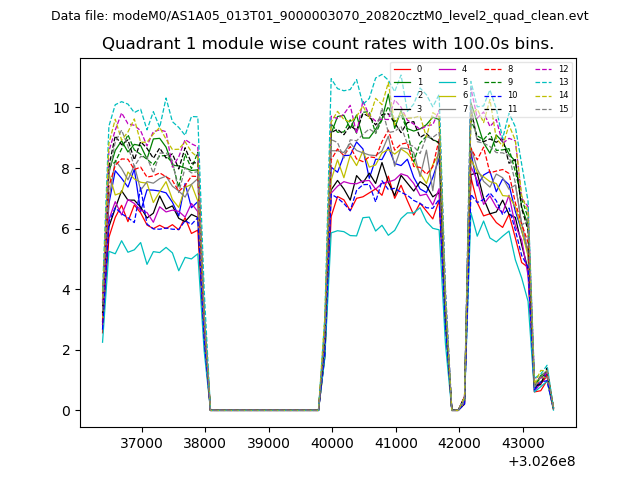
| Module-wise count rates for Quadrant A Data is divided into 100 sec bins |
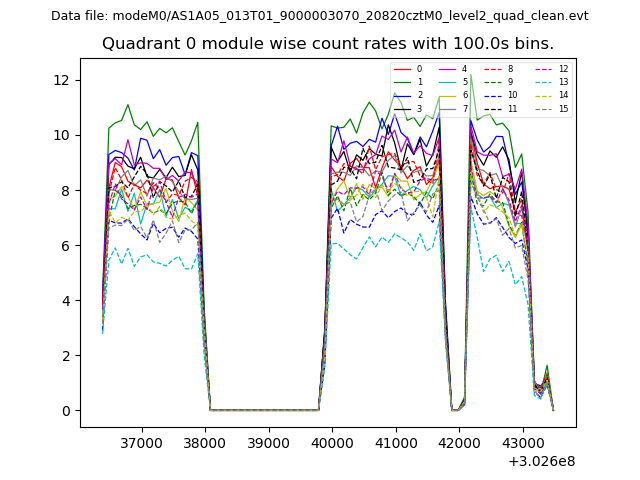 |
 |
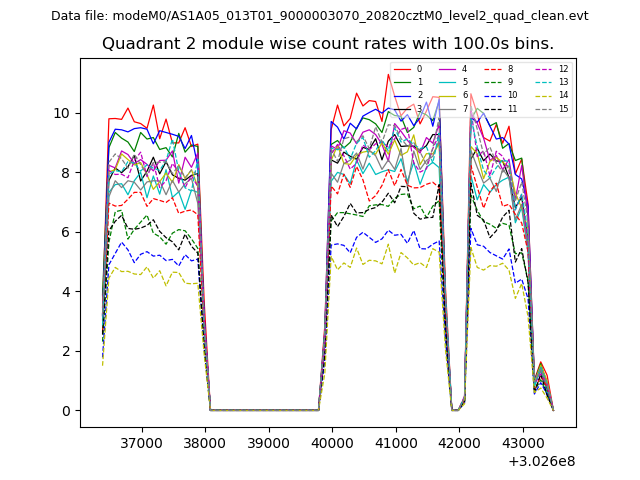
| Module-wise count rates for Quadrant B Data is divided into 100 sec bins |
 |
 |
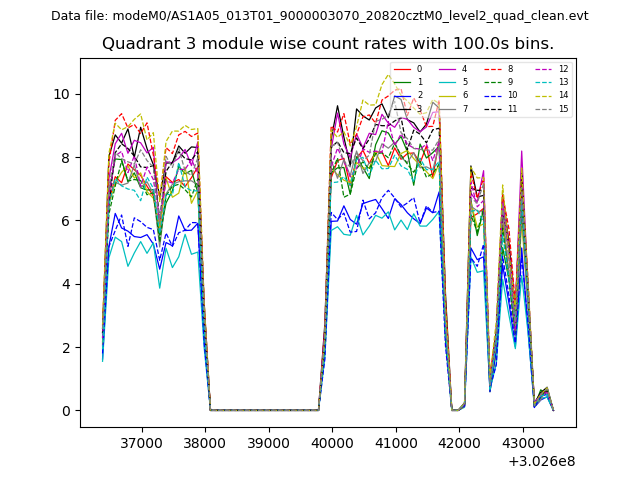
| Module-wise count rates for Quadrant C Data is divided into 100 sec bins |
 |
 |
| Module-wise count rates for Quadrant D Data is divided into 100 sec bins |
 |
 |
| Parameter | Plot |
|---|---|
| CZT HV Monitor |  |
| D_VDD | 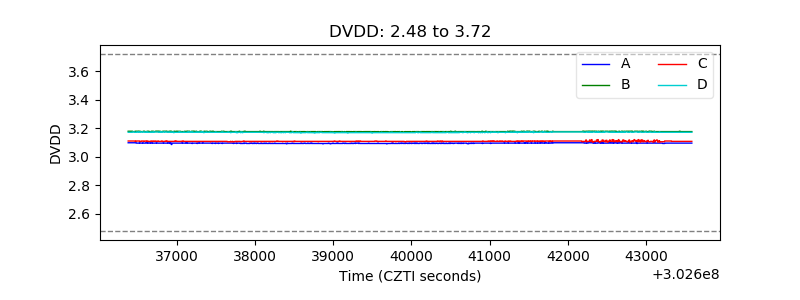 |
| Temperature 1 | 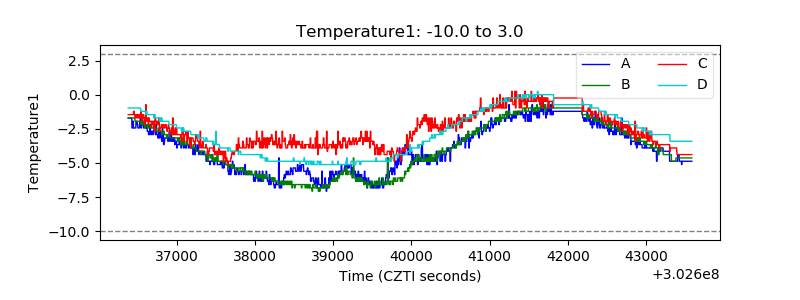 |
| Veto HV Monitor | 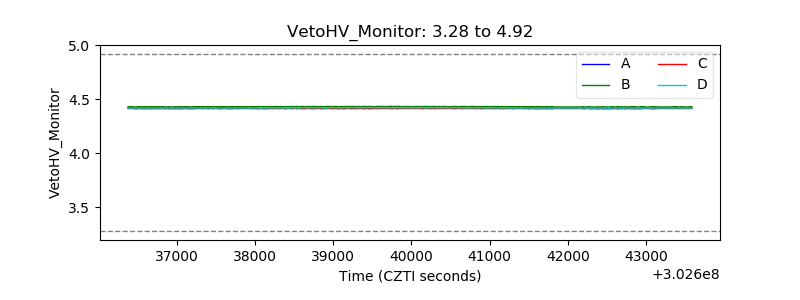 |
| Veto LLD | 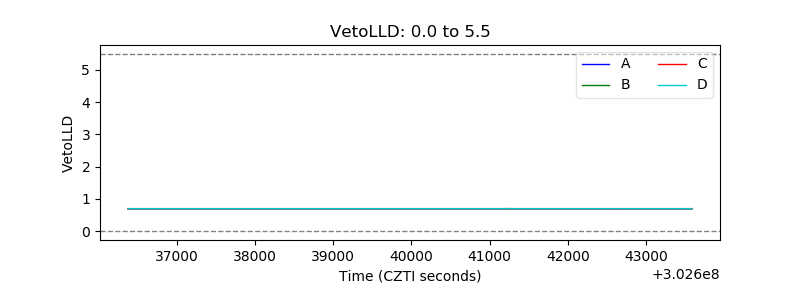 |
| Alpha Counter | 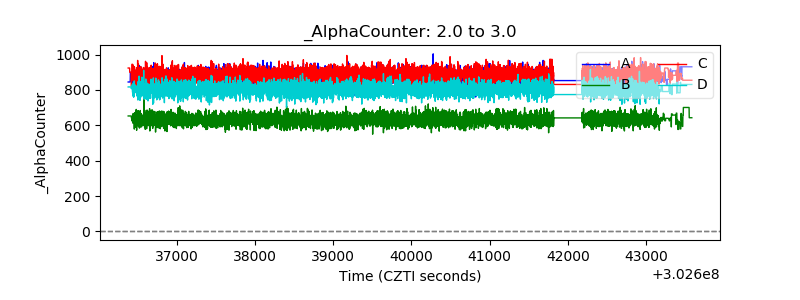 |
| _CPM_Rate | 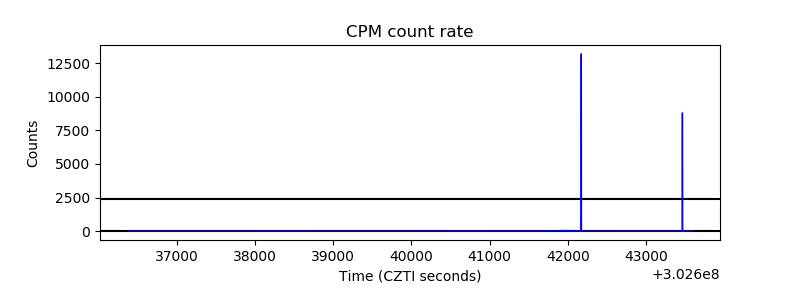 |
| CZT Counter | 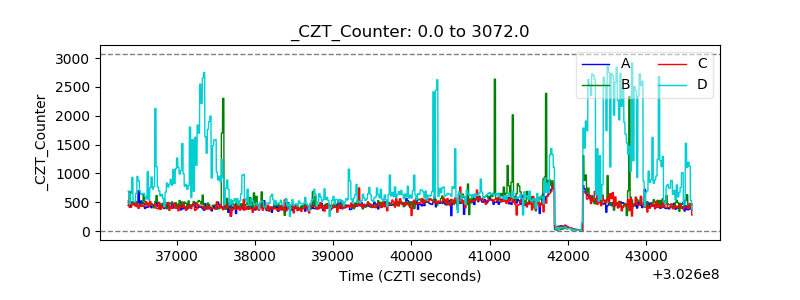 |
| +2.5 Volts monitor | 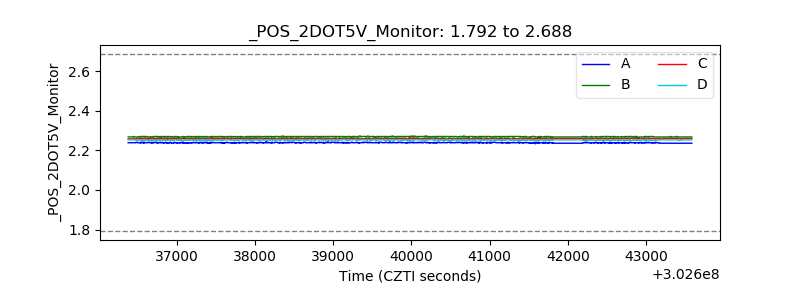 |
| +5 Volts monitor |  |
| _ROLL_ROT | 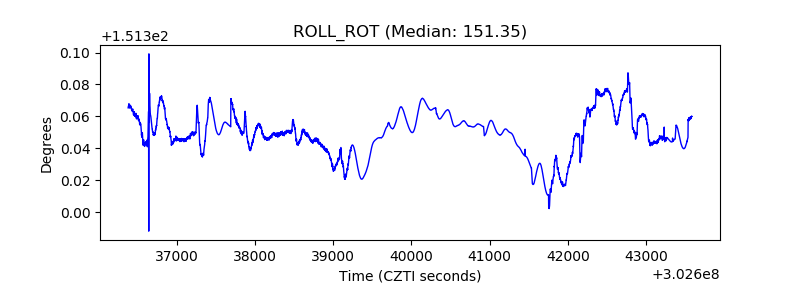 |
| _Roll_DEC | 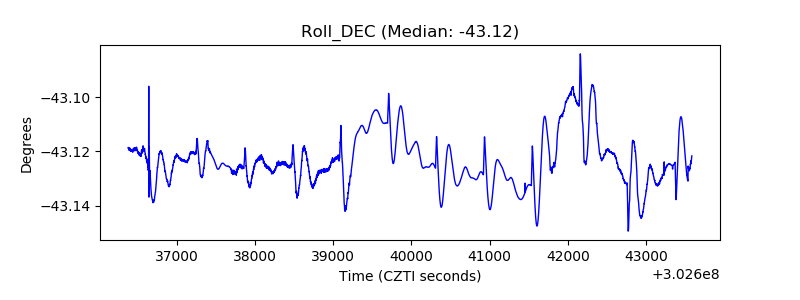 |
| _Roll_RA | 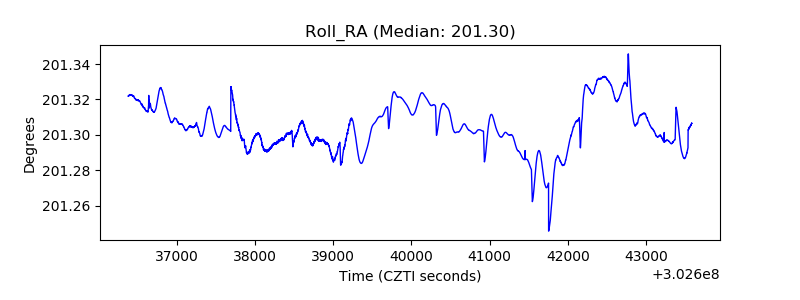 |
| Veto Counter |  |