| Param | Original file | Final file |
|---|---|---|
| Filename | modeM0/AS1A05_013T01_9000003070_20822cztM0_level2.evt | modeM0/AS1A05_013T01_9000003070_20822cztM0_level2_quad_clean.evt |
| Size (bytes) | 154,998,720 | 27,878,400 |
| Size | 147.8 MB | 26.6 MB |
| Events in quadrant A | 839,313 | 185,122 |
| Events in quadrant B | 896,206 | 184,422 |
| Events in quadrant C | 840,040 | 179,665 |
| Events in quadrant D | 1,997,582 | 166,729 |
| Mode SS | |||
|---|---|---|---|
| Quadrant | BADHDUFLAG | Total packets | Discarded packets |
| A | 0 | 39 | 5 |
| B | 0 | 38 | 2 |
| C | 0 | 43 | 9 |
| D | 0 | 39 | 5 |
| Mode M0 | |||
|---|---|---|---|
| Quadrant | BADHDUFLAG | Total packets | Discarded packets |
| A | 0 | 3952 | 410 |
| B | 0 | 4199 | 504 |
| C | 0 | 3951 | 433 |
| D | 0 | 8786 | 1849 |
| Mode M9 | |||
|---|---|---|---|
| Quadrant | BADHDUFLAG | Total packets | Discarded packets |
| A | 0 | 1 | 1 |
| B | 1 | 1 | 1 |
| C | 1 | -1 | -1 |
| D | 1 | -1 | -1 |
| Quadrant | Total seconds | Saturated seconds | Saturation percentage |
|---|---|---|---|
| A | 1756 | 2 | 0.113895% |
| B | 1751 | 3 | 0.171331% |
| C | 1745 | 11 | 0.630372% |
| D | 1725 | 474 | 27.478261% |
Noise dominated data is calculated using 1-second bins in cleaned event files. If a bin has >2000 counts, and if more than 50% of those come from <1% of pixels, then it is considered to be noise-dominated and hence unusable.
| Quadrant | # 1 sec bins | Bins with >0 counts | Bins with >2000 counts | High rate bins dominated by noise | Noise dominated (total time) | Noise dominated (detector-on time) | Marked lightcurve |
|---|---|---|---|---|---|---|---|
| A | 4293 | 1769 | 0 | 0 | 0.00% | 0.00% | 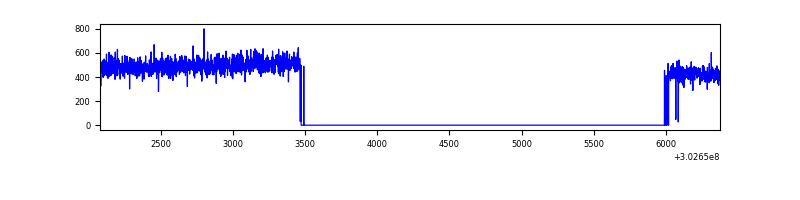 |
| B | 4291 | 1768 | 0 | 0 | 0.00% | 0.00% | 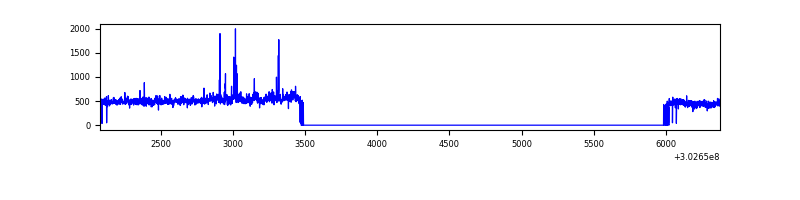 |
| C | 4292 | 1760 | 0 | 0 | 0.00% | 0.00% | 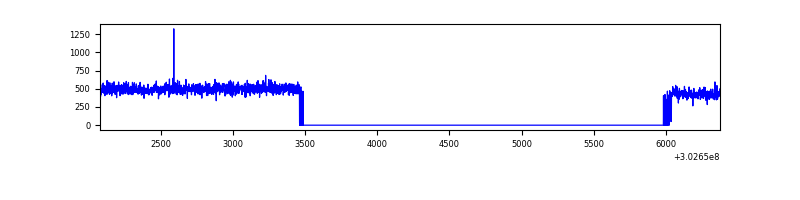 |
| D | 4290 | 1725 | 462 | 462 | 10.77% | 26.78% | 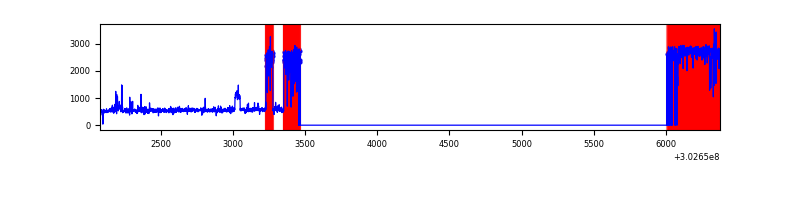 |
Top three noisy pixels from each quadrant. If the there are fewer than three noisy pixels in the level2.evt file, extra rows are filled as -1
| Pixel properties | Quadrant properties | ||||||
|---|---|---|---|---|---|---|---|
| Quadrant | DetID | PixID | Counts | Sigma | Mean | Median | Sigma |
| A | 0 | 226 | 1900 | 36.31 | 218 | 213 | 46.5 |
| A | 3 | 137 | 1742 | 32.91 | 218 | 213 | 46.5 |
| A | 12 | 194 | 1542 | 28.6 | 218 | 213 | 46.5 |
| B | 0 | 189 | 20412 | 469.1 | 213 | 208 | 43.1 |
| B | 7 | 220 | 10434 | 237.43 | 213 | 208 | 43.1 |
| B | 0 | 219 | 9738 | 221.27 | 213 | 208 | 43.1 |
| C | 14 | 238 | 33052 | 664.34 | 206 | 207 | 49.4 |
| C | 13 | 61 | 1539 | 26.94 | 206 | 207 | 49.4 |
| C | 7 | 247 | 607 | 8.09 | 206 | 207 | 49.4 |
| D | 1 | 52 | 1170712 | 25442.8 | 182 | 176 | 46.0 |
| D | 1 | 20 | 112626 | 2444.22 | 182 | 176 | 46.0 |
| D | 9 | 1 | 19111 | 411.57 | 182 | 176 | 46.0 |
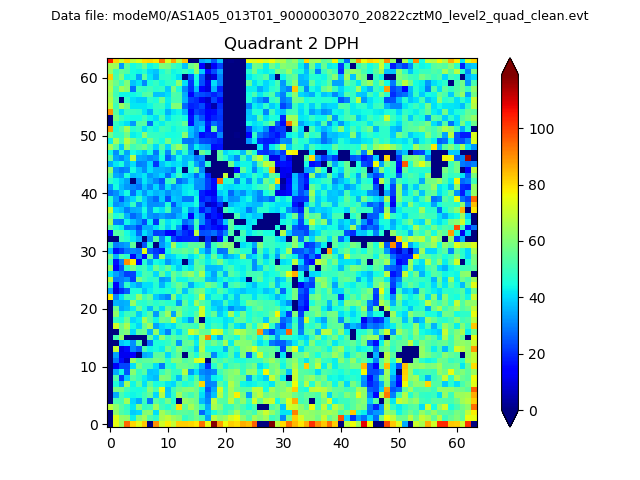
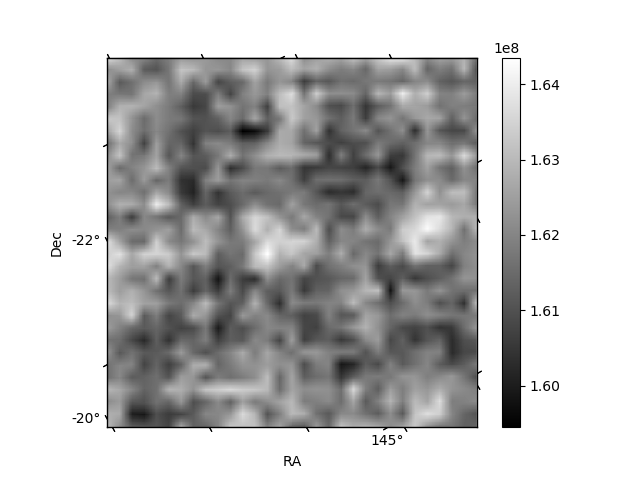
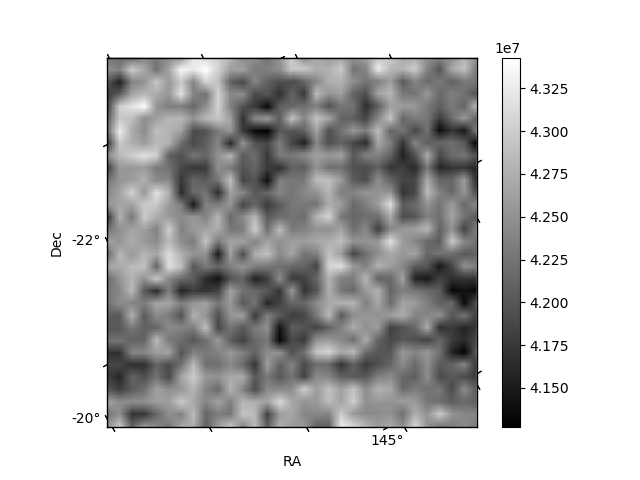
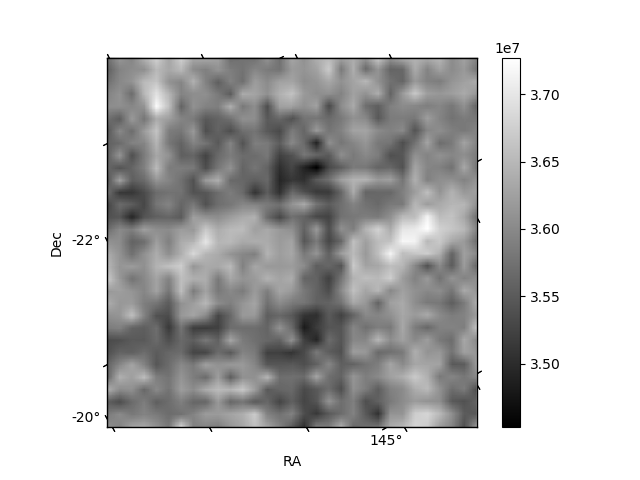
Histogram calculated using DETX and DETY for each event in the final _common_clean file
| Quadrant A | 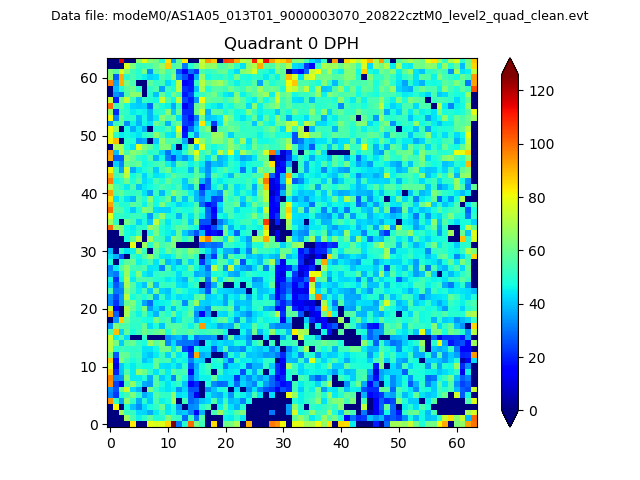 |
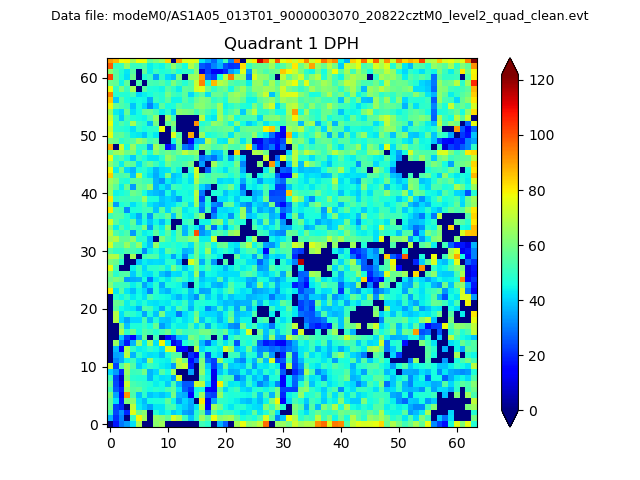 |
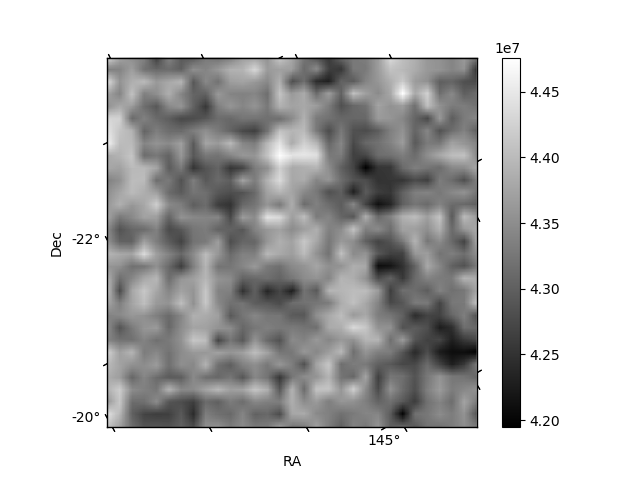
Quadrant B |
|---|---|---|---|
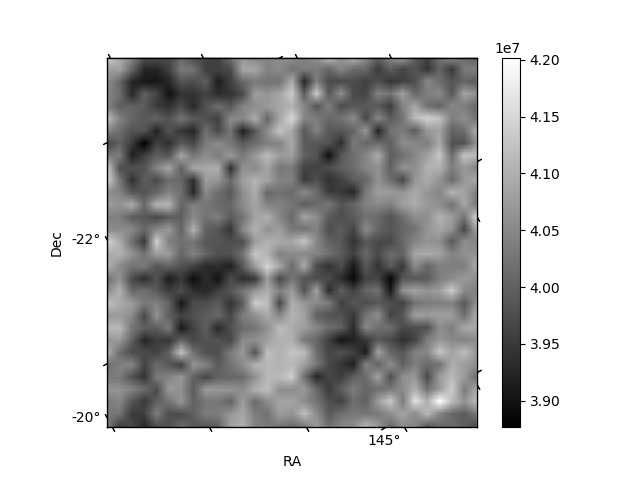
| Quadrant D | 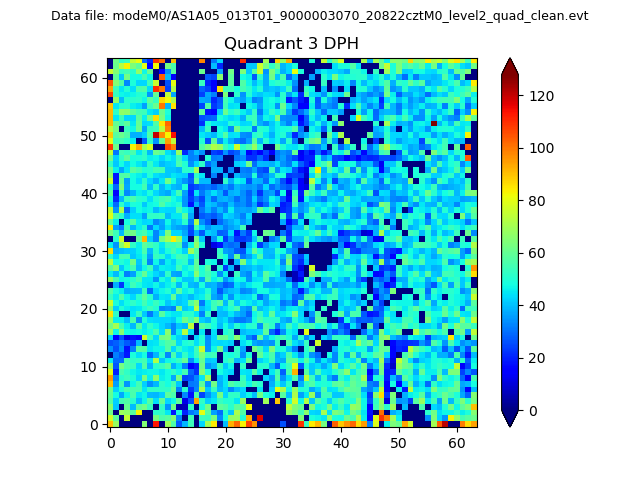 |
 |
Quadrant C |
| Plot type | Count rate plots | Images |
|---|---|---|
| Comparison with Poisson distribution Blue bars denote a histogram of data divided into 1 sec bins. Red curve is a Poisson curve with rate = median count rate of data. |
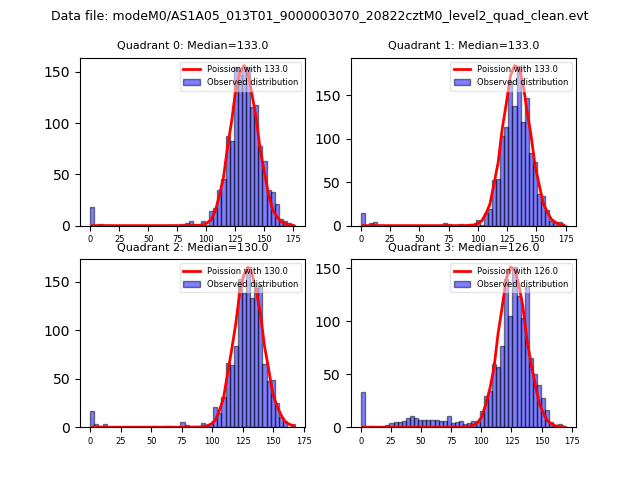 |
 |
| Quadrant-wise count rates Data is divided into 100 sec bins |
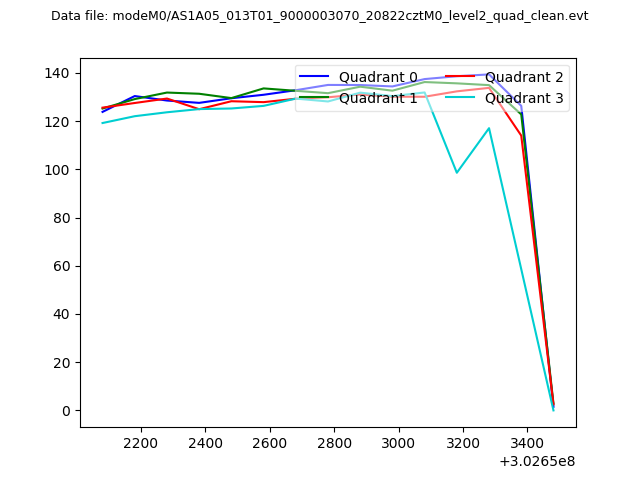 |
|
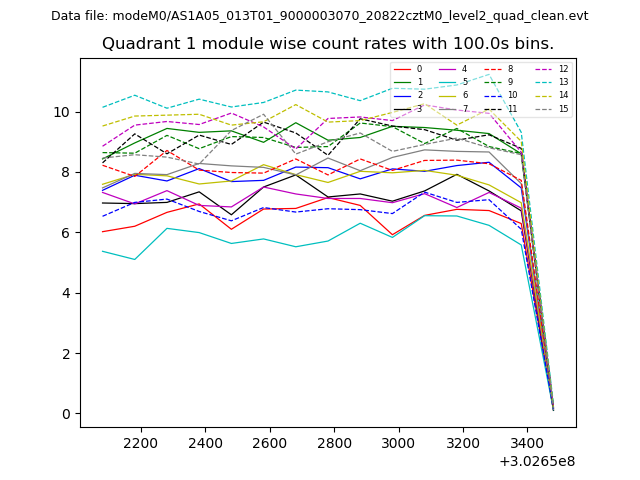
| Module-wise count rates for Quadrant A Data is divided into 100 sec bins |
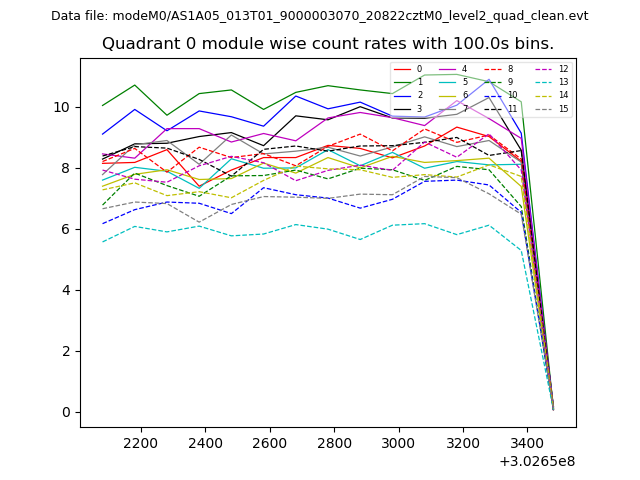 |
 |
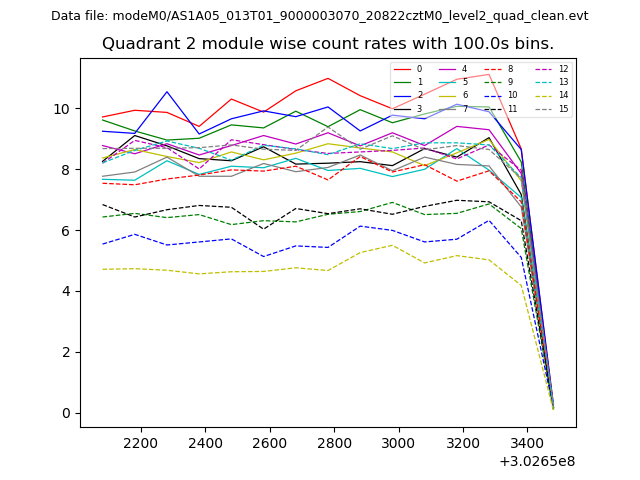
| Module-wise count rates for Quadrant B Data is divided into 100 sec bins |
 |
 |
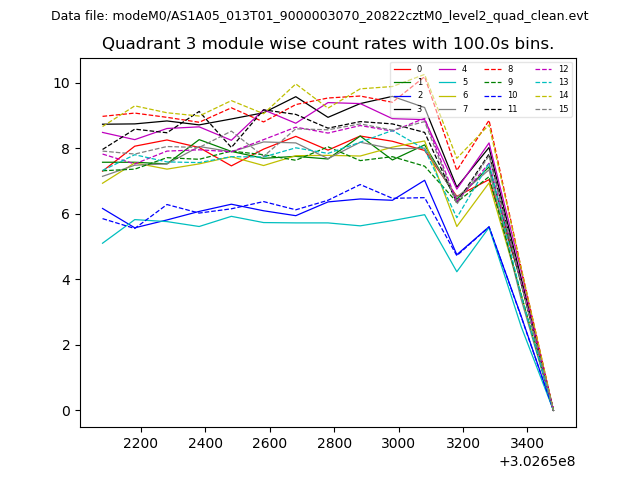
| Module-wise count rates for Quadrant C Data is divided into 100 sec bins |
 |
 |
| Module-wise count rates for Quadrant D Data is divided into 100 sec bins |
 |
 |
| Parameter | Plot |
|---|---|
| CZT HV Monitor | 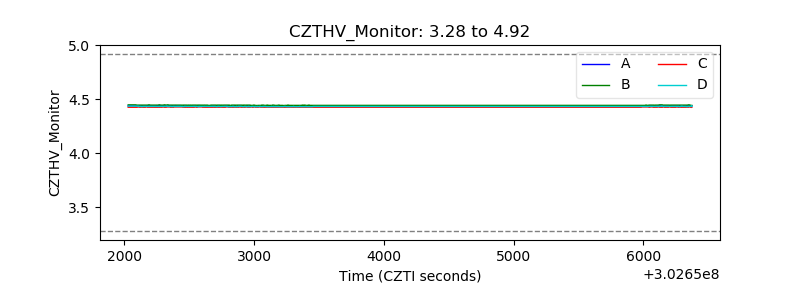 |
| D_VDD | 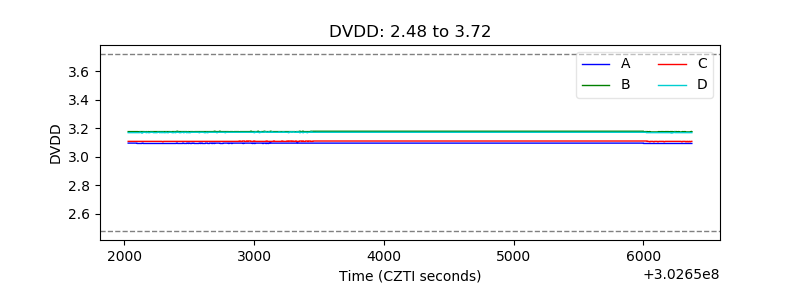 |
| Temperature 1 | 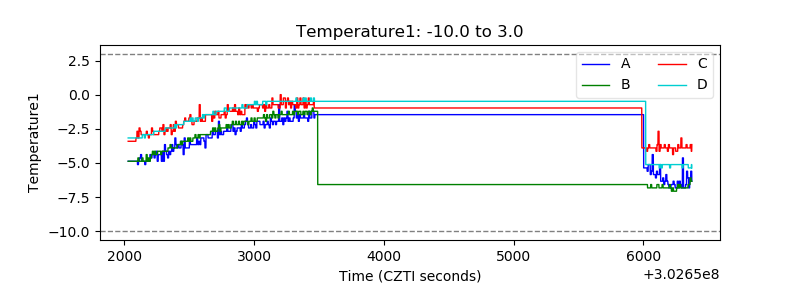 |
| Veto HV Monitor | 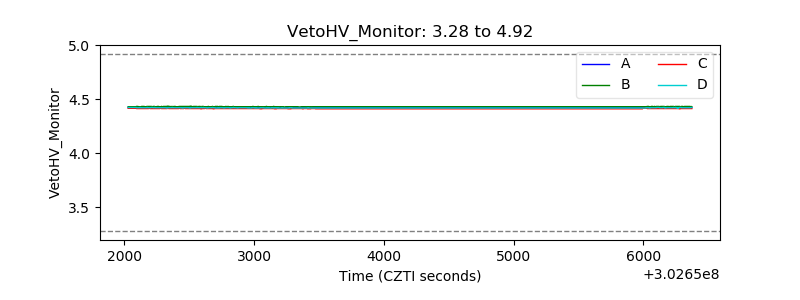 |
| Veto LLD | 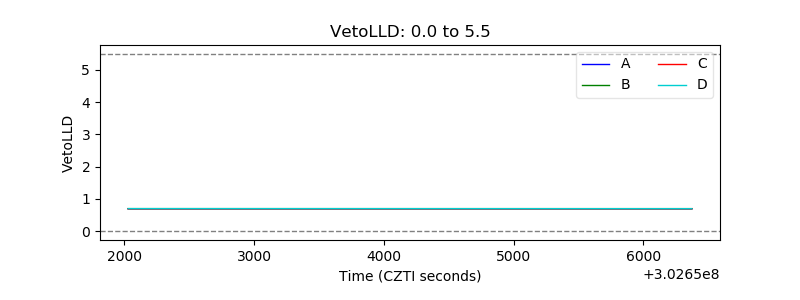 |
| Alpha Counter | 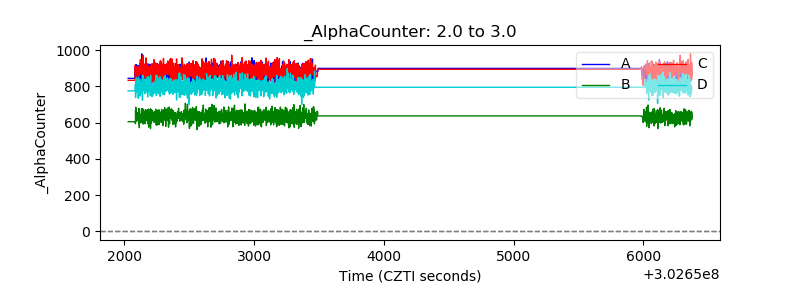 |
| _CPM_Rate | 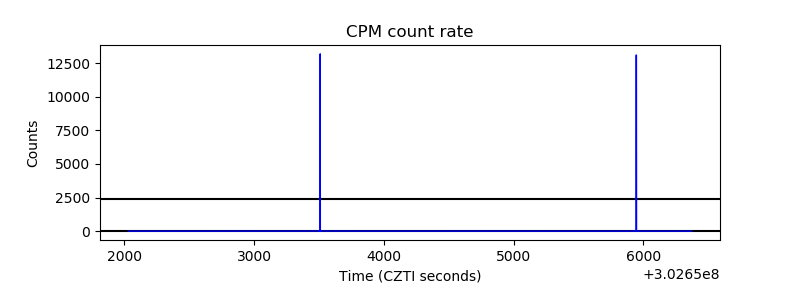 |
| CZT Counter | 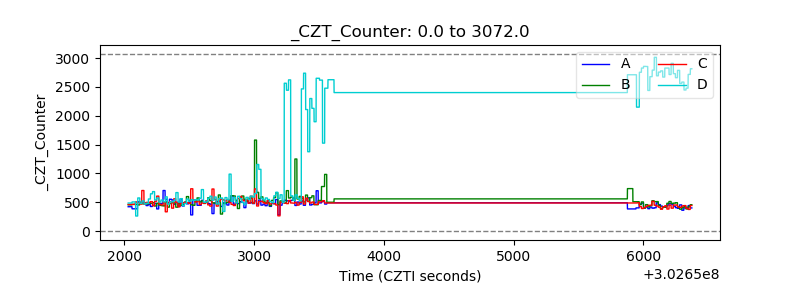 |
| +2.5 Volts monitor |  |
| +5 Volts monitor | 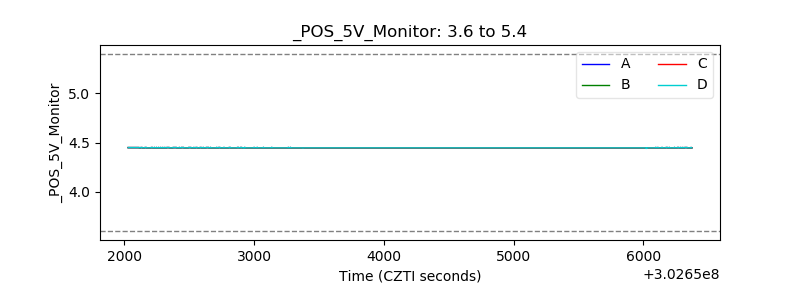 |
| _ROLL_ROT | 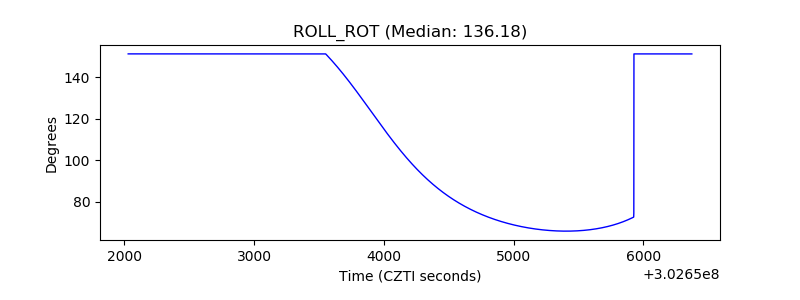 |
| _Roll_DEC | 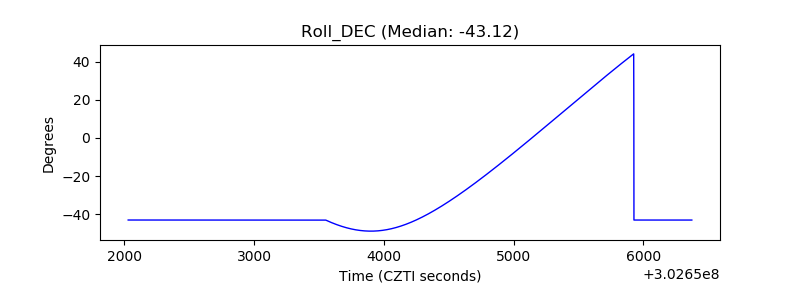 |
| _Roll_RA | 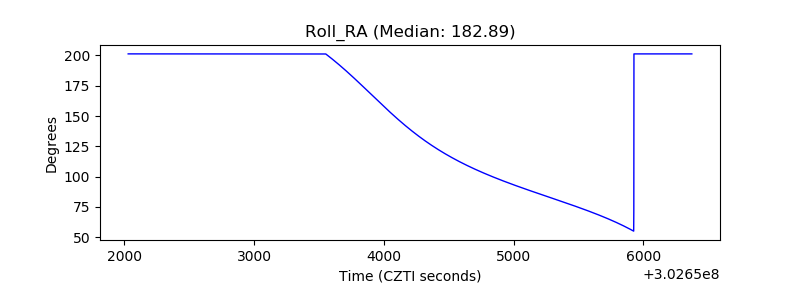 |
| Veto Counter | 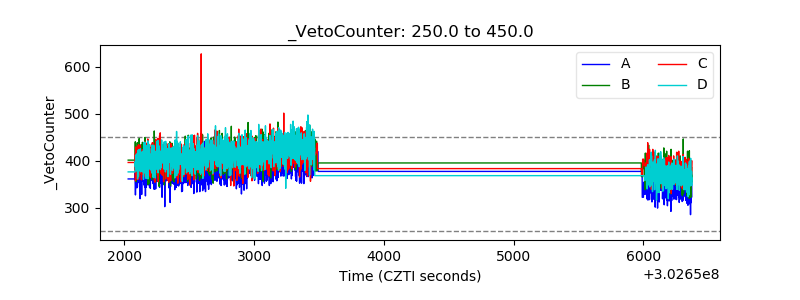 |