| Param | Original file | Final file |
|---|---|---|
| Filename | modeM0/AS1A05_013T01_9000003070_20823cztM0_level2.evt | modeM0/AS1A05_013T01_9000003070_20823cztM0_level2_quad_clean.evt |
| Size (bytes) | 2,131,381,440 | 276,212,160 |
| Size | 2.0 GB | 263.4 MB |
| Events in quadrant A | 10,544,903 | 1,838,003 |
| Events in quadrant B | 12,031,678 | 1,819,732 |
| Events in quadrant C | 10,673,466 | 1,775,373 |
| Events in quadrant D | 29,754,729 | 1,353,824 |
| Mode SS | |||
|---|---|---|---|
| Quadrant | BADHDUFLAG | Total packets | Discarded packets |
| A | 0 | 466 | 0 |
| B | 0 | 466 | 0 |
| C | 0 | 466 | 0 |
| D | 0 | 466 | 0 |
| Mode M0 | |||
|---|---|---|---|
| Quadrant | BADHDUFLAG | Total packets | Discarded packets |
| A | 0 | 46539 | 4 |
| B | 0 | 50568 | 4 |
| C | 0 | 46605 | 4 |
| D | 0 | 103795 | 8 |
| Mode M9 | |||
|---|---|---|---|
| Quadrant | BADHDUFLAG | Total packets | Discarded packets |
| A | 0 | 25 | 0 |
| B | 0 | 25 | 0 |
| C | 0 | 25 | 0 |
| D | 0 | 25 | 0 |
| Quadrant | Total seconds | Saturated seconds | Saturation percentage |
|---|---|---|---|
| A | 22905 | 108 | 0.471513% |
| B | 22906 | 314 | 1.370820% |
| C | 22906 | 166 | 0.724701% |
| D | 22905 | 7234 | 31.582624% |
Noise dominated data is calculated using 1-second bins in cleaned event files. If a bin has >2000 counts, and if more than 50% of those come from <1% of pixels, then it is considered to be noise-dominated and hence unusable.
| Quadrant | # 1 sec bins | Bins with >0 counts | Bins with >2000 counts | High rate bins dominated by noise | Noise dominated (total time) | Noise dominated (detector-on time) | Marked lightcurve |
|---|---|---|---|---|---|---|---|
| A | 25450 | 22906 | 0 | 0 | 0.00% | 0.00% | 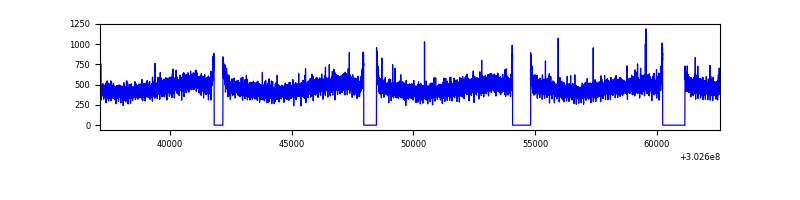 |
| B | 25451 | 22906 | 111 | 111 | 0.44% | 0.48% | 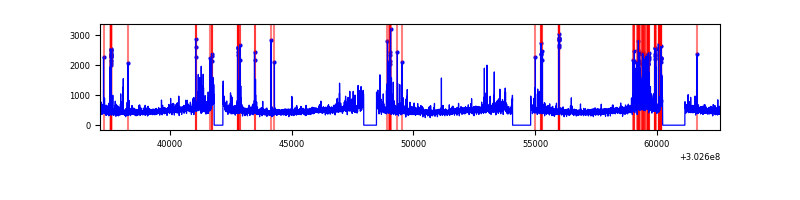 |
| C | 25451 | 22908 | 0 | 0 | 0.00% | 0.00% | 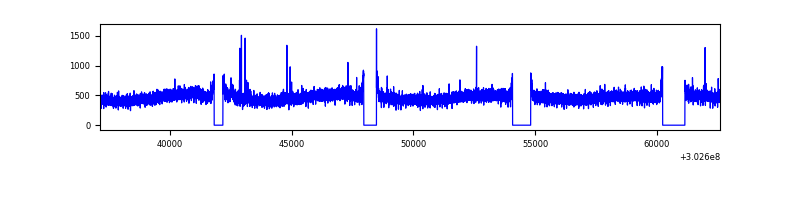 |
| D | 25449 | 22905 | 7096 | 7096 | 27.88% | 30.98% | 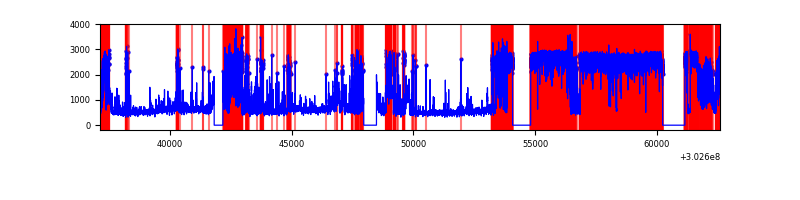 |
Top three noisy pixels from each quadrant. If the there are fewer than three noisy pixels in the level2.evt file, extra rows are filled as -1
| Pixel properties | Quadrant properties | ||||||
|---|---|---|---|---|---|---|---|
| Quadrant | DetID | PixID | Counts | Sigma | Mean | Median | Sigma |
| A | 0 | 226 | 23912 | 38.56 | 2741 | 2678 | 550.6 |
| A | 3 | 137 | 22120 | 35.31 | 2741 | 2678 | 550.6 |
| A | 12 | 194 | 19657 | 30.84 | 2741 | 2678 | 550.6 |
| B | 7 | 220 | 360072 | 706.45 | 2710 | 2644 | 506.0 |
| B | 0 | 189 | 246100 | 481.18 | 2710 | 2644 | 506.0 |
| B | 0 | 219 | 168985 | 328.77 | 2710 | 2644 | 506.0 |
| C | 14 | 238 | 408929 | 667.55 | 2610 | 2629 | 608.6 |
| C | 9 | 54 | 48080 | 74.68 | 2610 | 2629 | 608.6 |
| C | 10 | 91 | 26335 | 38.95 | 2610 | 2629 | 608.6 |
| D | 1 | 52 | 18001684 | 33844.39 | 2215 | 2152 | 531.8 |
| D | 1 | 20 | 2153098 | 4044.41 | 2215 | 2152 | 531.8 |
| D | 7 | 38 | 458539 | 858.14 | 2215 | 2152 | 531.8 |
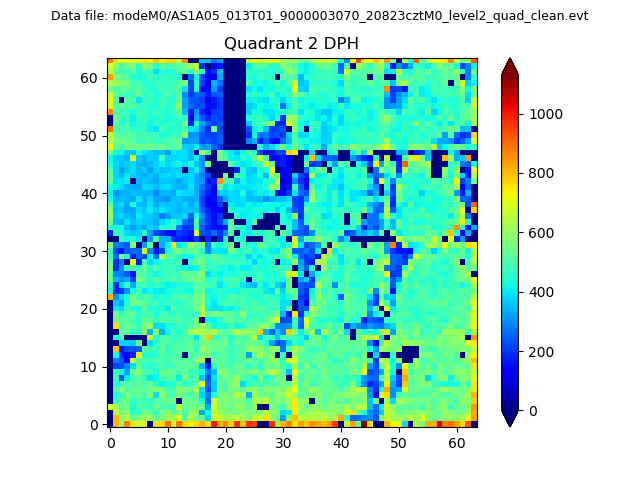
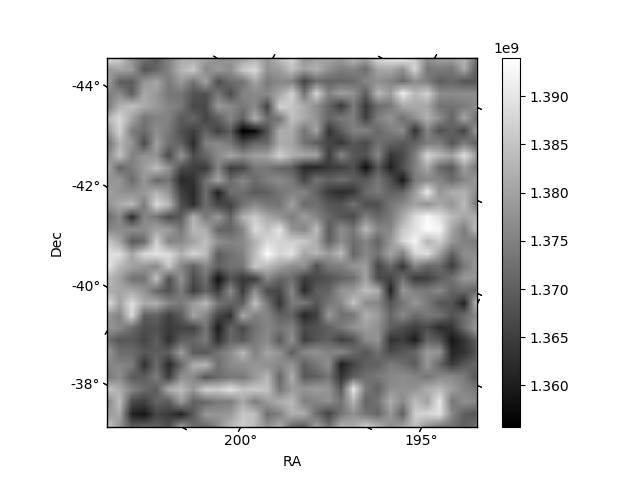
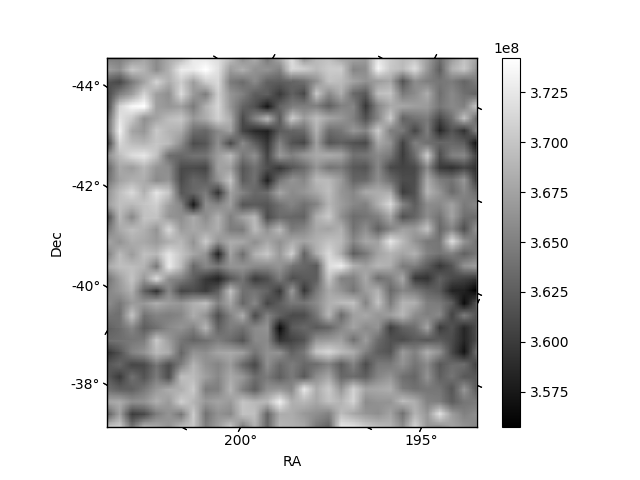
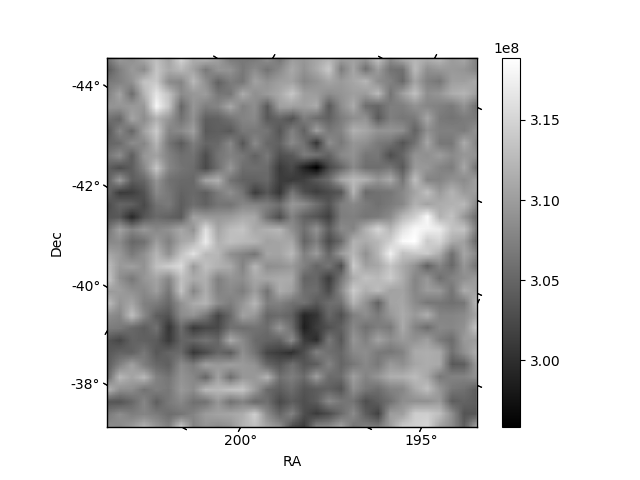
Histogram calculated using DETX and DETY for each event in the final _common_clean file
| Quadrant A | 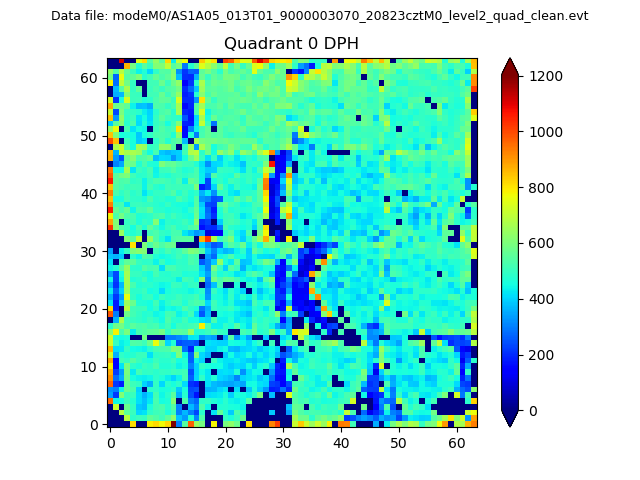 |
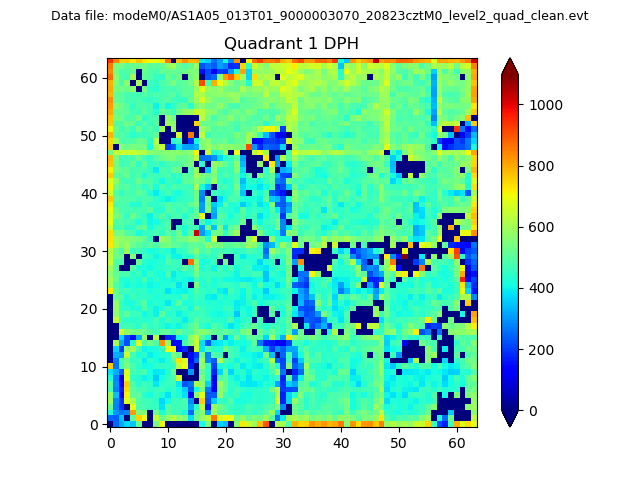 |
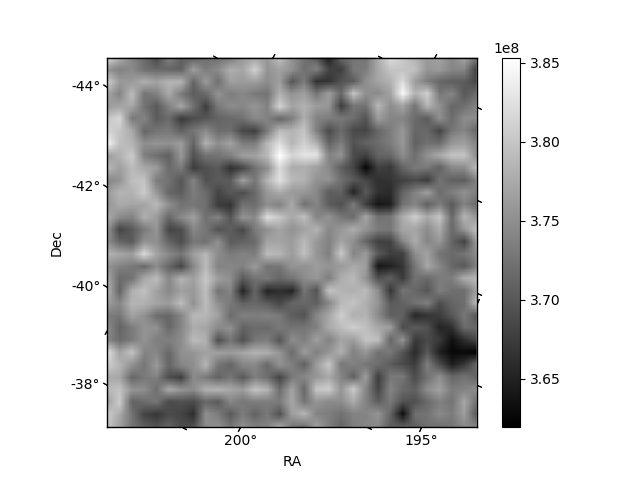
Quadrant B |
|---|---|---|---|
| Quadrant D | 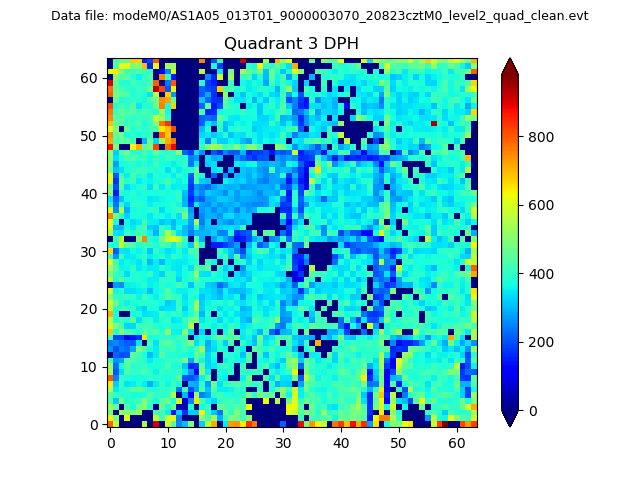 |
 |
Quadrant C |
| Plot type | Count rate plots | Images |
|---|---|---|
| Comparison with Poisson distribution Blue bars denote a histogram of data divided into 1 sec bins. Red curve is a Poisson curve with rate = median count rate of data. |
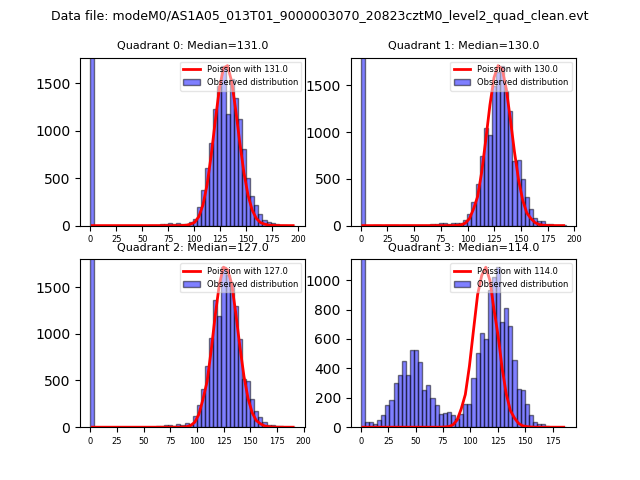 |
 |
| Quadrant-wise count rates Data is divided into 100 sec bins |
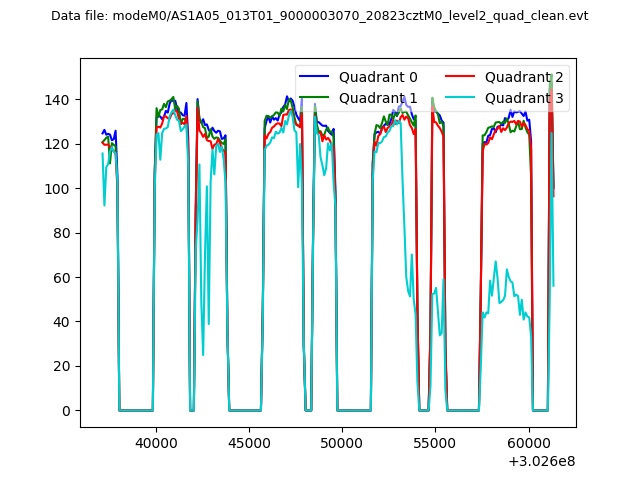 |
|
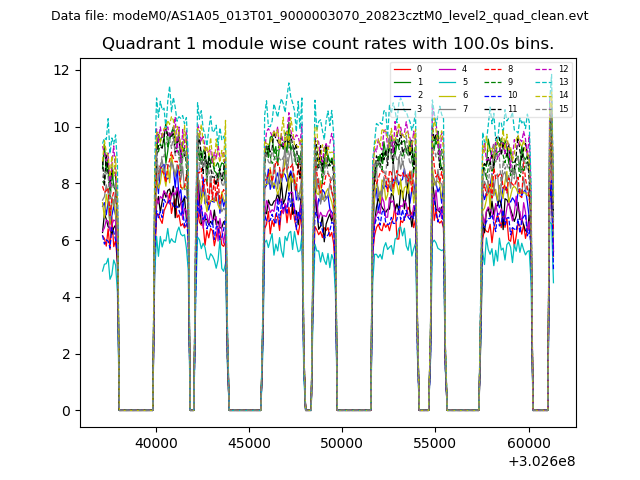
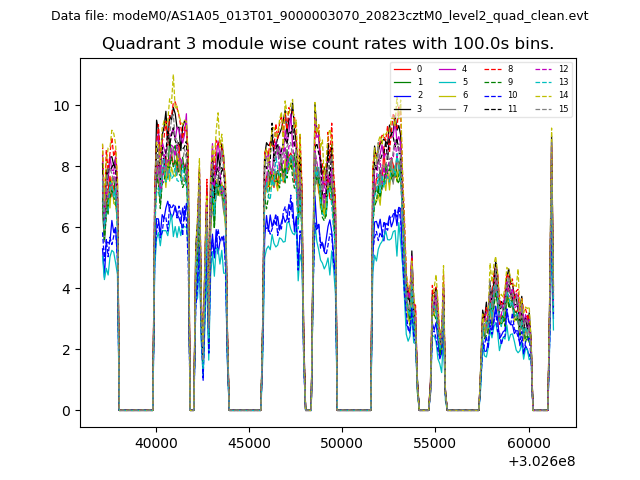
| Module-wise count rates for Quadrant A Data is divided into 100 sec bins |
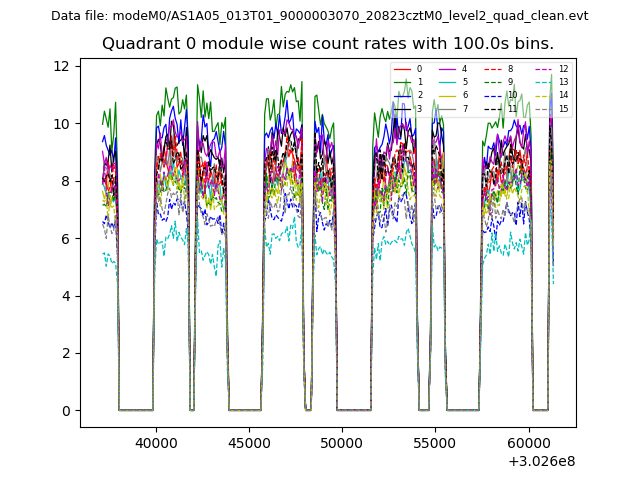 |
 |
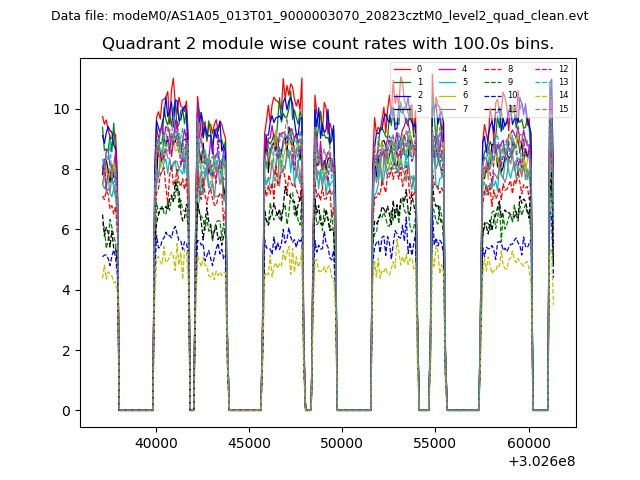
| Module-wise count rates for Quadrant B Data is divided into 100 sec bins |
 |
 |
| Module-wise count rates for Quadrant C Data is divided into 100 sec bins |
 |
 |
| Module-wise count rates for Quadrant D Data is divided into 100 sec bins |
 |
 |
| Parameter | Plot |
|---|---|
| CZT HV Monitor | 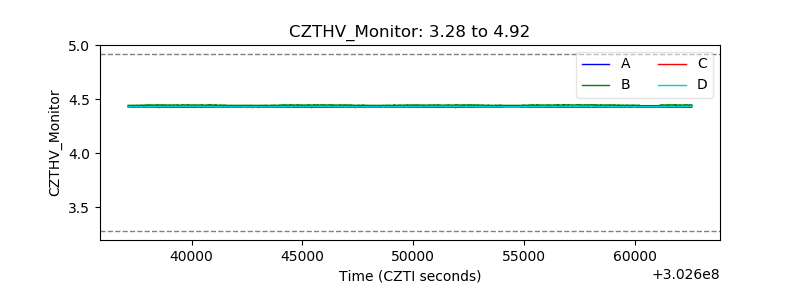 |
| D_VDD | 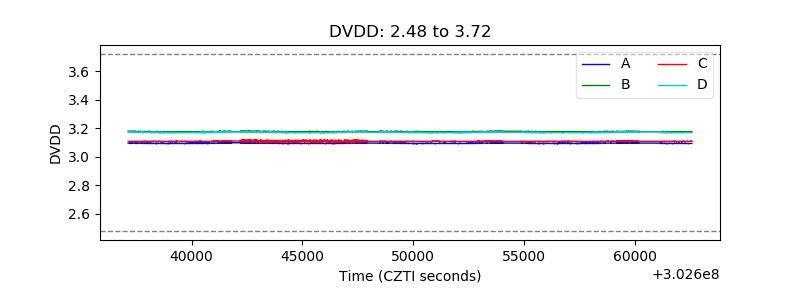 |
| Temperature 1 | 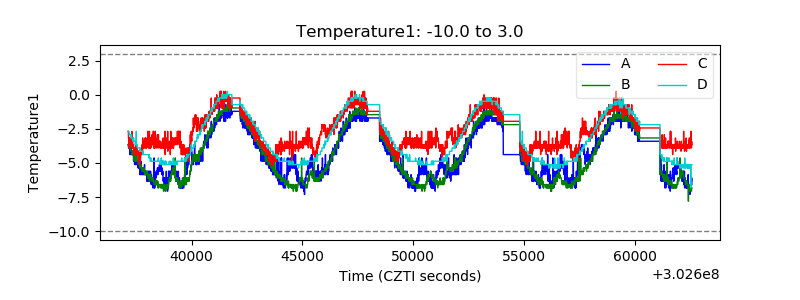 |
| Veto HV Monitor |  |
| Veto LLD | 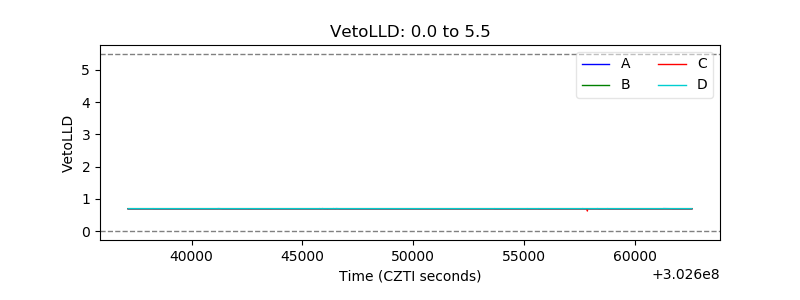 |
| Alpha Counter | 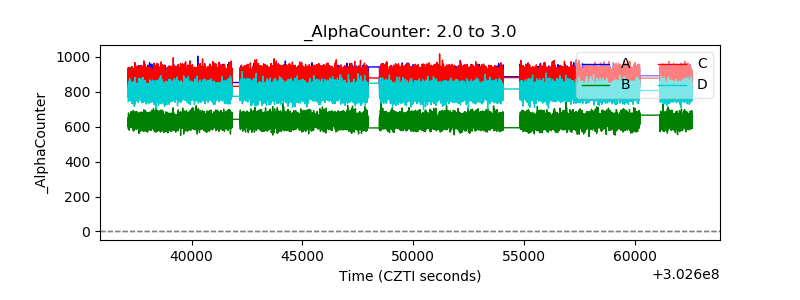 |
| _CPM_Rate | 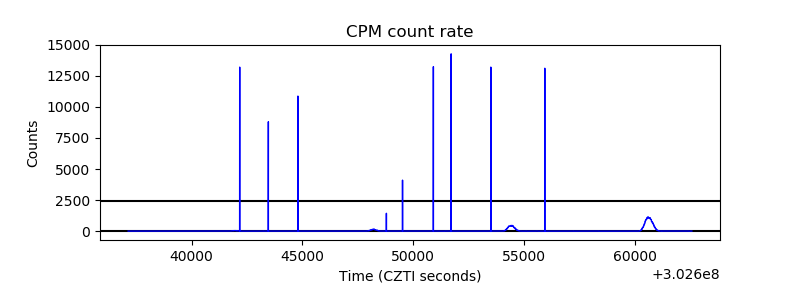 |
| CZT Counter | 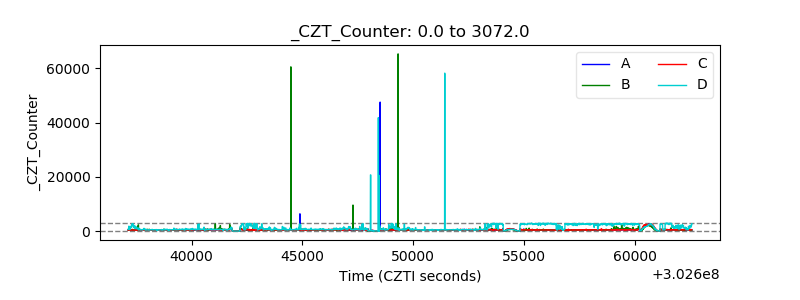 |
| +2.5 Volts monitor |  |
| +5 Volts monitor |  |
| _ROLL_ROT | 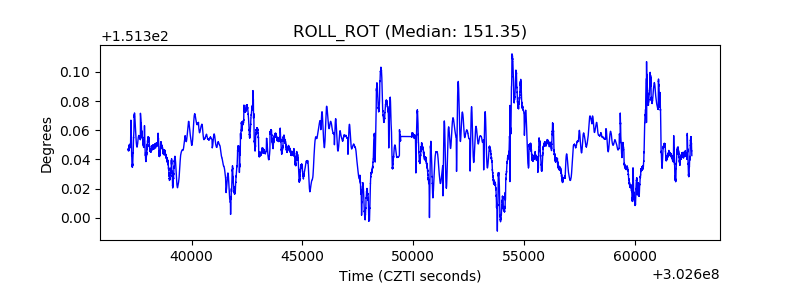 |
| _Roll_DEC |  |
| _Roll_RA | 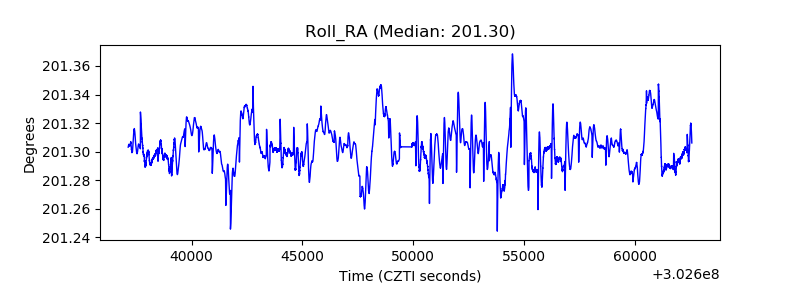 |
| Veto Counter | 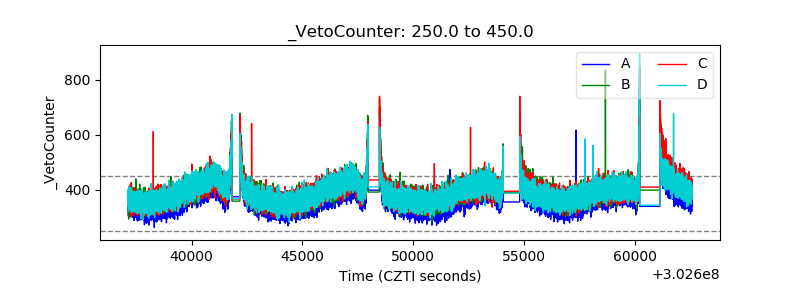 |