| Param | Original file | Final file |
|---|---|---|
| Filename | modeM0/AS1A05_013T01_9000003070_20824cztM0_level2.evt | modeM0/AS1A05_013T01_9000003070_20824cztM0_level2_quad_clean.evt |
| Size (bytes) | 788,443,200 | 57,876,480 |
| Size | 751.9 MB | 55.2 MB |
| Events in quadrant A | 2,946,046 | 392,788 |
| Events in quadrant B | 3,182,087 | 391,449 |
| Events in quadrant C | 3,030,674 | 379,792 |
| Events in quadrant D | 14,299,209 | 153,612 |
| Mode SS | |||
|---|---|---|---|
| Quadrant | BADHDUFLAG | Total packets | Discarded packets |
| A | 0 | 124 | 0 |
| B | 0 | 124 | 0 |
| C | 0 | 124 | 0 |
| D | 0 | 124 | 0 |
| Mode M0 | |||
|---|---|---|---|
| Quadrant | BADHDUFLAG | Total packets | Discarded packets |
| A | 0 | 12700 | 1 |
| B | 0 | 13304 | 1 |
| C | 0 | 12849 | 1 |
| D | 0 | 46781 | 1 |
| Mode M9 | |||
|---|---|---|---|
| Quadrant | BADHDUFLAG | Total packets | Discarded packets |
| A | 0 | 11 | 0 |
| B | 0 | 11 | 0 |
| C | 0 | 11 | 0 |
| D | 0 | 11 | 0 |
| Quadrant | Total seconds | Saturated seconds | Saturation percentage |
|---|---|---|---|
| A | 6212 | 20 | 0.321958% |
| B | 6213 | 41 | 0.659907% |
| C | 6213 | 65 | 1.046193% |
| D | 6212 | 4860 | 78.235673% |
Noise dominated data is calculated using 1-second bins in cleaned event files. If a bin has >2000 counts, and if more than 50% of those come from <1% of pixels, then it is considered to be noise-dominated and hence unusable.
| Quadrant | # 1 sec bins | Bins with >0 counts | Bins with >2000 counts | High rate bins dominated by noise | Noise dominated (total time) | Noise dominated (detector-on time) | Marked lightcurve |
|---|---|---|---|---|---|---|---|
| A | 7277 | 6212 | 0 | 0 | 0.00% | 0.00% | 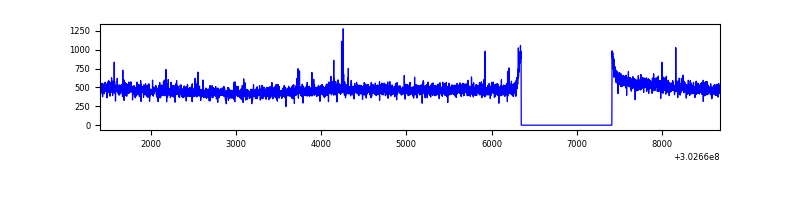 |
| B | 7278 | 6213 | 6 | 6 | 0.08% | 0.10% | 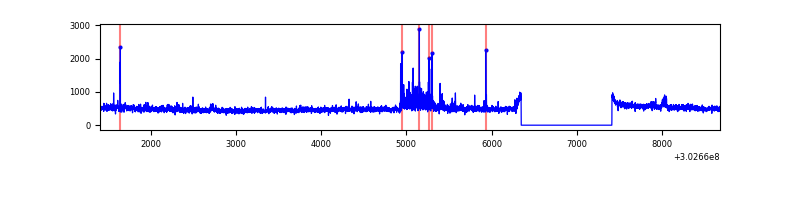 |
| C | 7278 | 6213 | 5 | 5 | 0.07% | 0.08% | 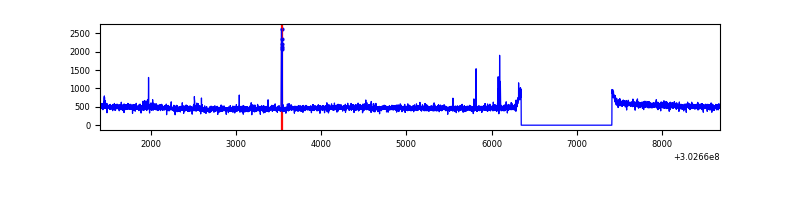 |
| D | 7276 | 6211 | 4863 | 4863 | 66.84% | 78.30% | 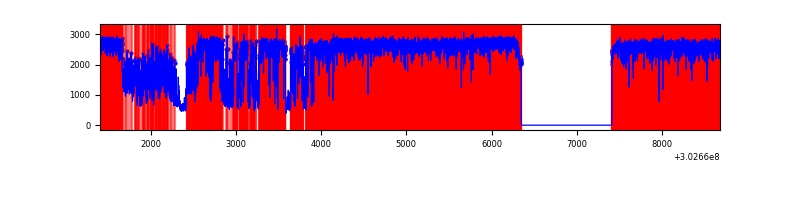 |
Top three noisy pixels from each quadrant. If the there are fewer than three noisy pixels in the level2.evt file, extra rows are filled as -1
| Pixel properties | Quadrant properties | ||||||
|---|---|---|---|---|---|---|---|
| Quadrant | DetID | PixID | Counts | Sigma | Mean | Median | Sigma |
| A | 5 | 16 | 9238 | 55.35 | 763 | 748 | 153.4 |
| A | 0 | 226 | 6377 | 36.7 | 763 | 748 | 153.4 |
| A | 3 | 137 | 6150 | 35.22 | 763 | 748 | 153.4 |
| B | 7 | 220 | 87307 | 601.81 | 760 | 739 | 143.8 |
| B | 0 | 189 | 25308 | 170.8 | 760 | 739 | 143.8 |
| B | 0 | 230 | 23252 | 156.51 | 760 | 739 | 143.8 |
| C | 14 | 238 | 117067 | 681.76 | 734 | 739 | 170.6 |
| C | 9 | 54 | 49630 | 286.54 | 734 | 739 | 170.6 |
| C | 13 | 61 | 5098 | 25.55 | 734 | 739 | 170.6 |
| D | 1 | 52 | 12216388 | 117526.78 | 439 | 427 | 103.9 |
| D | 1 | 20 | 303617 | 2916.92 | 439 | 427 | 103.9 |
| D | 9 | 1 | 85221 | 815.78 | 439 | 427 | 103.9 |
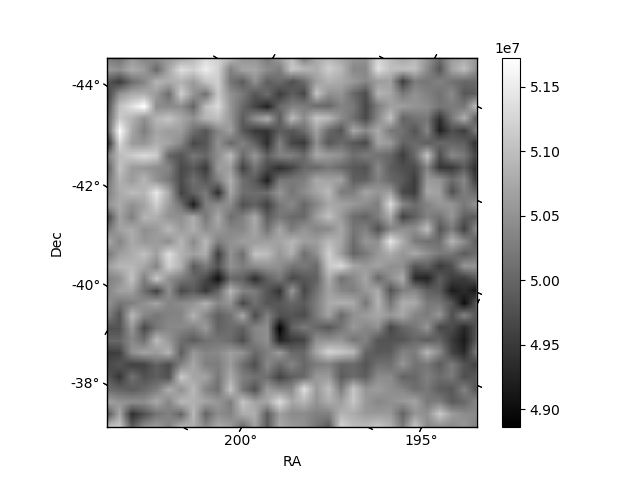
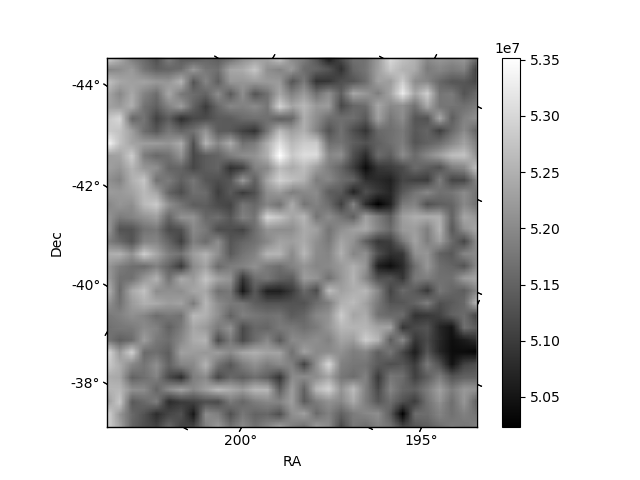
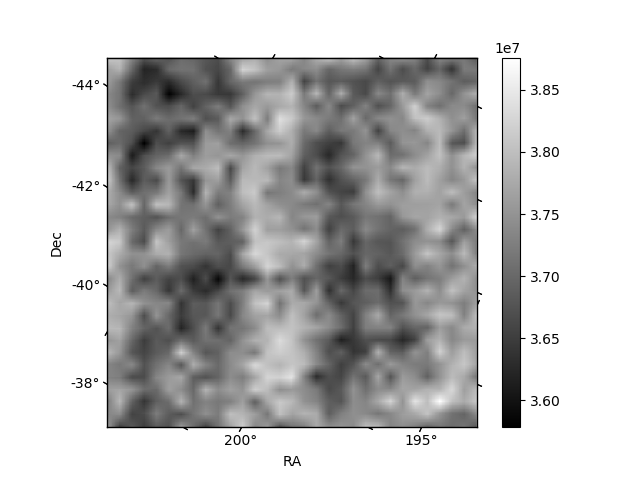
Histogram calculated using DETX and DETY for each event in the final _common_clean file
| Quadrant A | 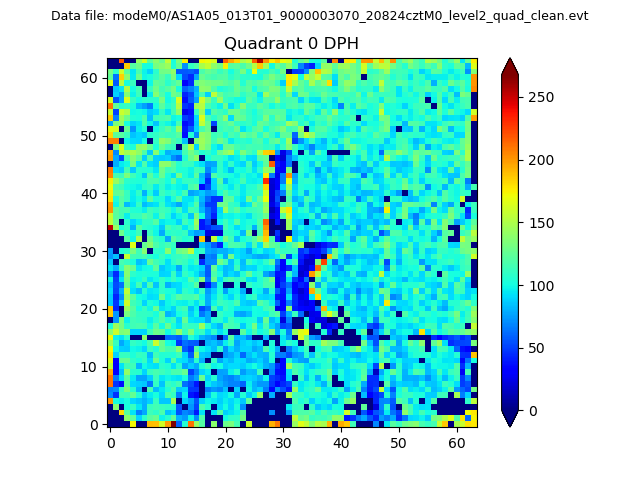 |
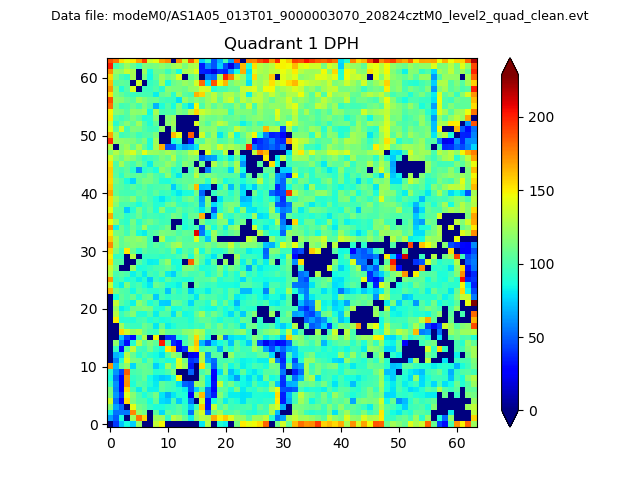 |
Quadrant B |
|---|---|---|---|
| Quadrant D | 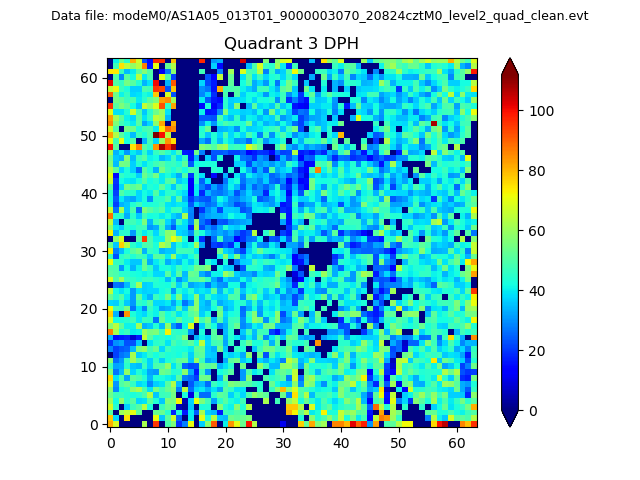 |
 |
Quadrant C |
| Plot type | Count rate plots | Images |
|---|---|---|
| Comparison with Poisson distribution Blue bars denote a histogram of data divided into 1 sec bins. Red curve is a Poisson curve with rate = median count rate of data. |
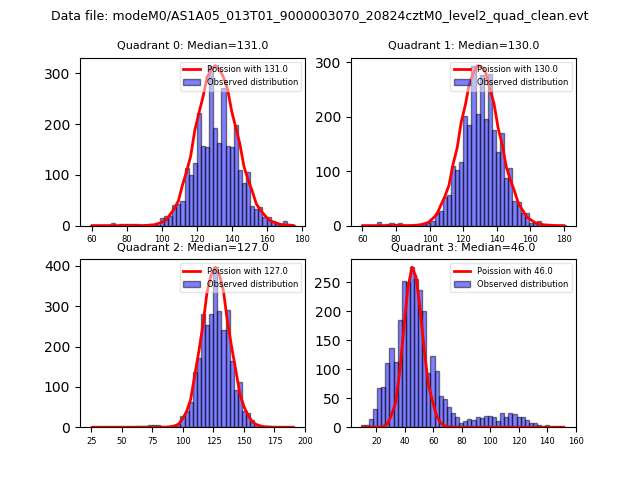 |
 |
| Quadrant-wise count rates Data is divided into 100 sec bins |
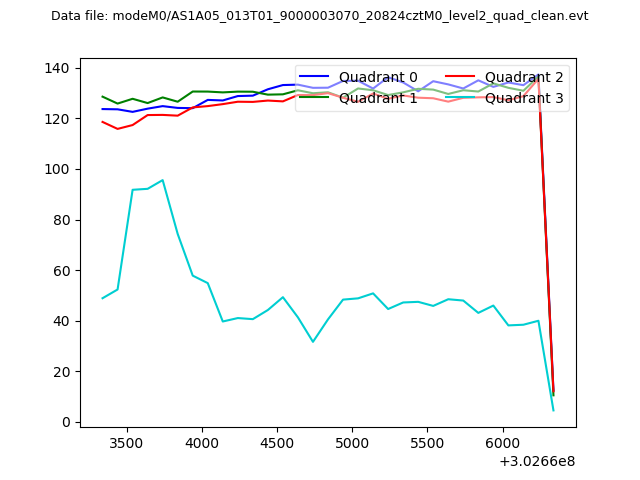 |
|
| Module-wise count rates for Quadrant A Data is divided into 100 sec bins |
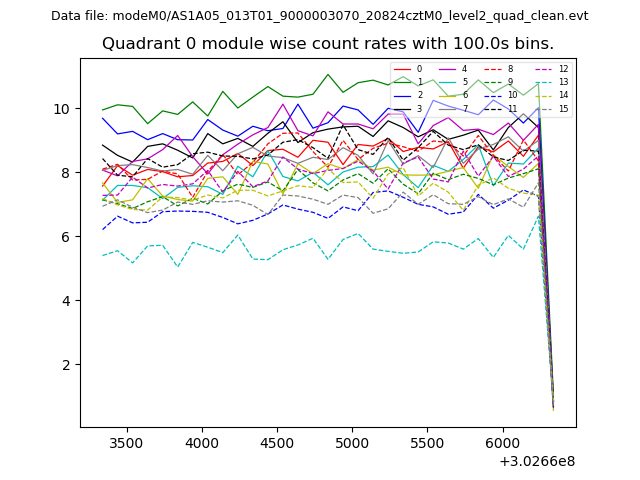 |
 |
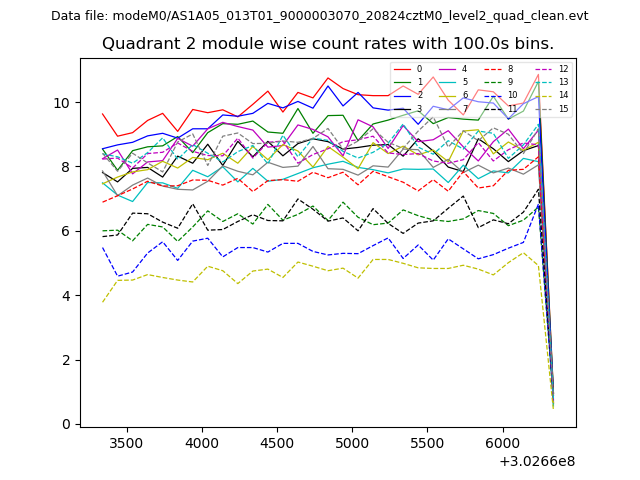
| Module-wise count rates for Quadrant B Data is divided into 100 sec bins |
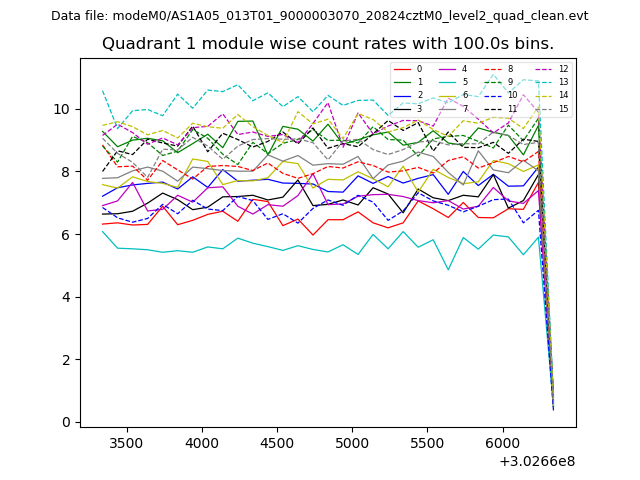 |
 |
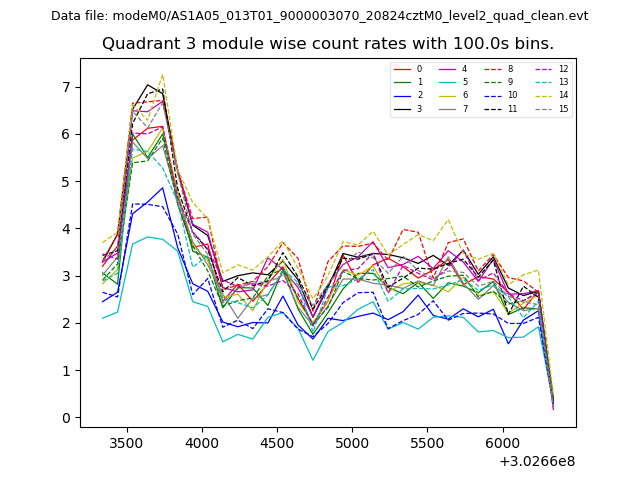
| Module-wise count rates for Quadrant C Data is divided into 100 sec bins |
 |
 |
| Module-wise count rates for Quadrant D Data is divided into 100 sec bins |
 |
 |
| Parameter | Plot |
|---|---|
| CZT HV Monitor | 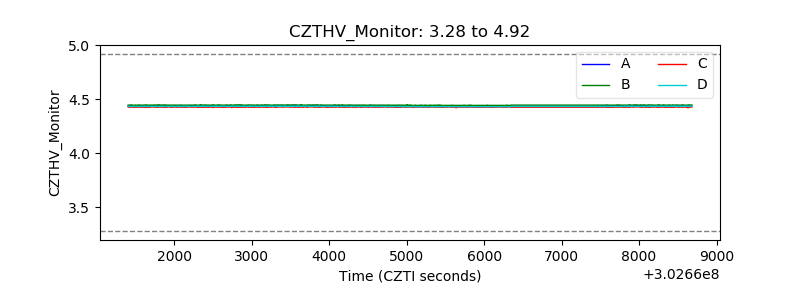 |
| D_VDD | 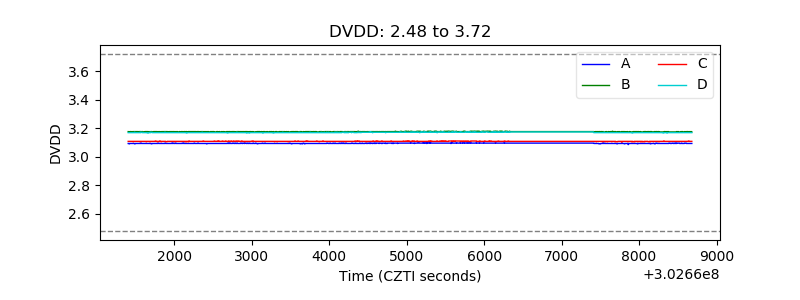 |
| Temperature 1 | 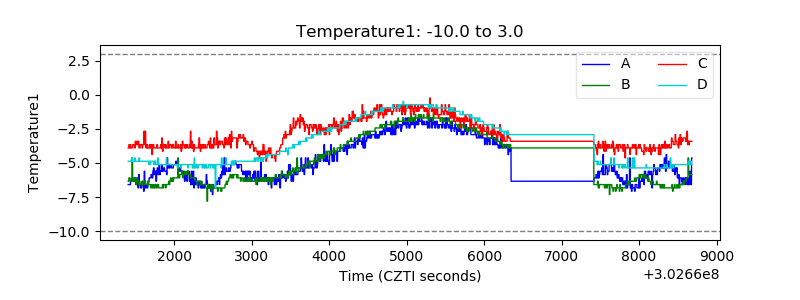 |
| Veto HV Monitor | 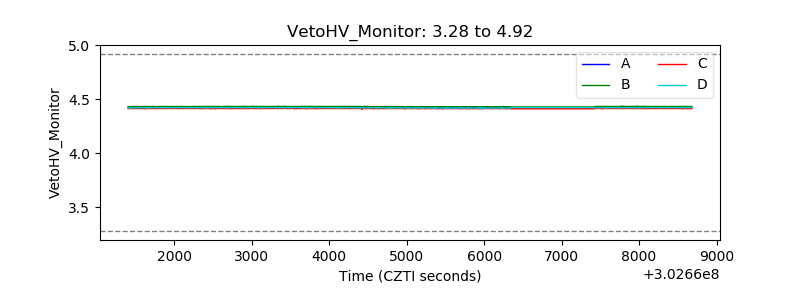 |
| Veto LLD | 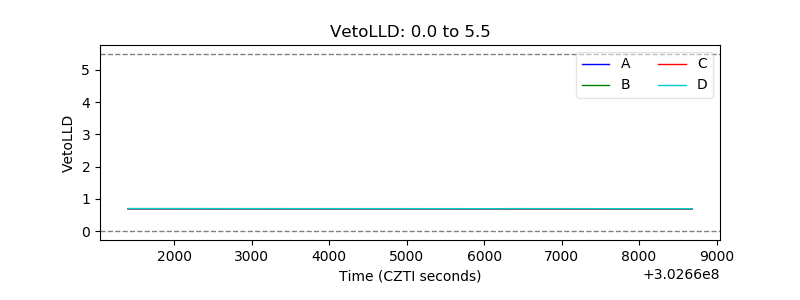 |
| Alpha Counter | 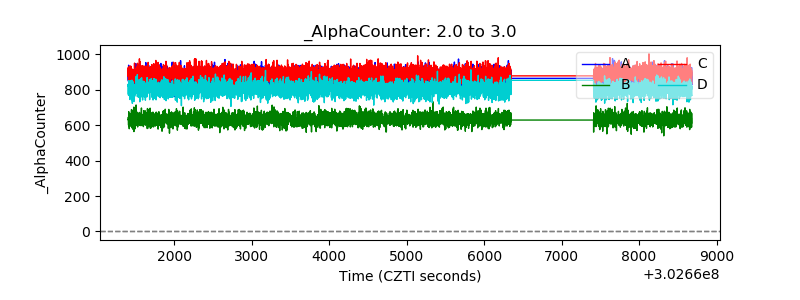 |
| _CPM_Rate | 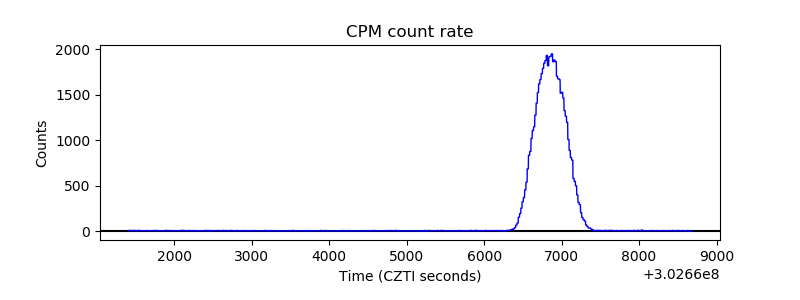 |
| CZT Counter | 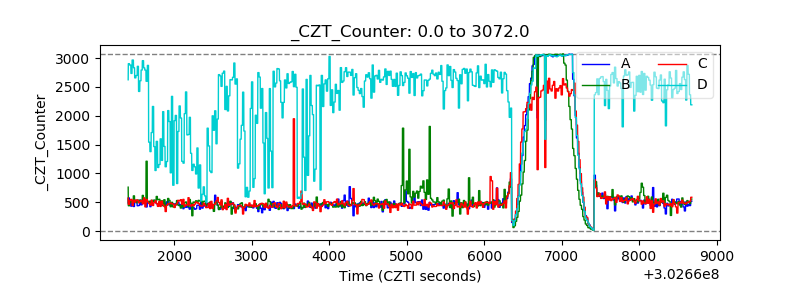 |
| +2.5 Volts monitor |  |
| +5 Volts monitor |  |
| _ROLL_ROT | 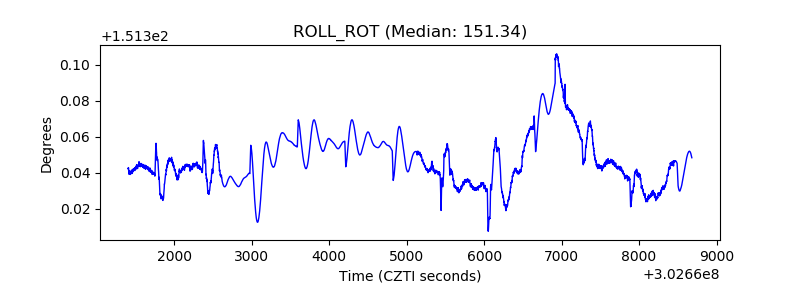 |
| _Roll_DEC | 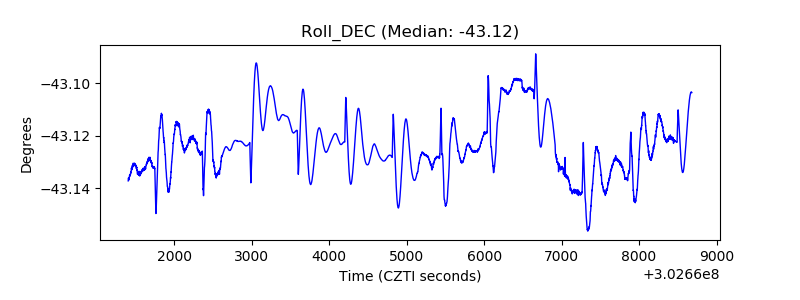 |
| _Roll_RA | 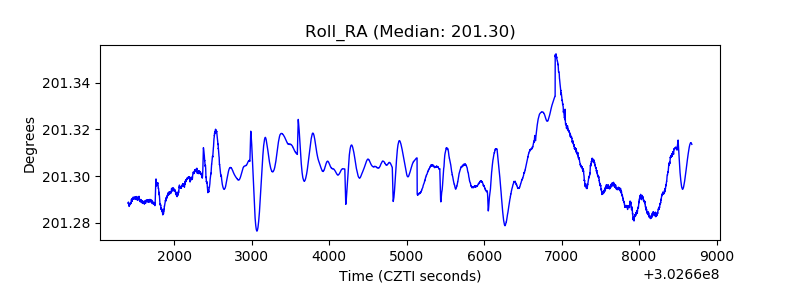 |
| Veto Counter | 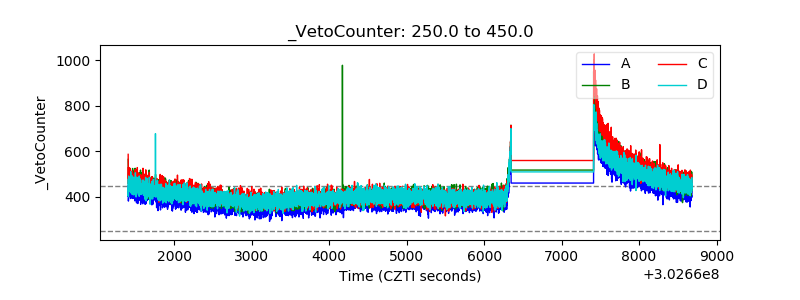 |