| Param | Original file | Final file |
|---|---|---|
| Filename | modeM0/AS1A05_013T01_9000003070_20828cztM0_level2.evt | modeM0/AS1A05_013T01_9000003070_20828cztM0_level2_quad_clean.evt |
| Size (bytes) | 524,471,040 | 106,571,520 |
| Size | 500.2 MB | 101.6 MB |
| Events in quadrant A | 3,073,418 | 739,489 |
| Events in quadrant B | 3,315,329 | 738,713 |
| Events in quadrant C | 3,123,452 | 719,651 |
| Events in quadrant D | 5,986,974 | 633,241 |
| Mode SS | |||
|---|---|---|---|
| Quadrant | BADHDUFLAG | Total packets | Discarded packets |
| A | 0 | 116 | 0 |
| B | 0 | 116 | 0 |
| C | 0 | 116 | 0 |
| D | 0 | 116 | 0 |
| Mode M0 | |||
|---|---|---|---|
| Quadrant | BADHDUFLAG | Total packets | Discarded packets |
| A | 0 | 12580 | 1 |
| B | 0 | 13386 | 1 |
| C | 0 | 12886 | 1 |
| D | 0 | 21585 | 2 |
| Mode M9 | |||
|---|---|---|---|
| Quadrant | BADHDUFLAG | Total packets | Discarded packets |
| A | 0 | 13 | 0 |
| B | 0 | 13 | 0 |
| C | 0 | 13 | 0 |
| D | 0 | 13 | 0 |
| Quadrant | Total seconds | Saturated seconds | Saturation percentage |
|---|---|---|---|
| A | 5662 | 65 | 1.148004% |
| B | 5663 | 124 | 2.189652% |
| C | 5663 | 114 | 2.013067% |
| D | 5662 | 1353 | 23.896150% |
Noise dominated data is calculated using 1-second bins in cleaned event files. If a bin has >2000 counts, and if more than 50% of those come from <1% of pixels, then it is considered to be noise-dominated and hence unusable.
| Quadrant | # 1 sec bins | Bins with >0 counts | Bins with >2000 counts | High rate bins dominated by noise | Noise dominated (total time) | Noise dominated (detector-on time) | Marked lightcurve |
|---|---|---|---|---|---|---|---|
| A | 7002 | 5662 | 0 | 0 | 0.00% | 0.00% | 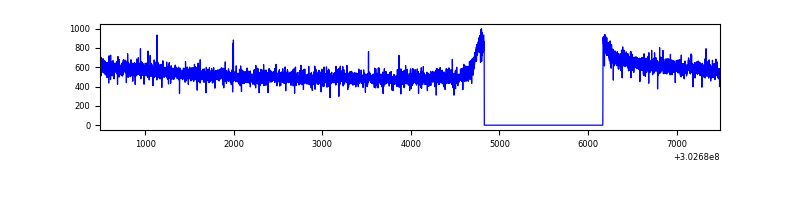 |
| B | 7003 | 5663 | 27 | 27 | 0.39% | 0.48% | 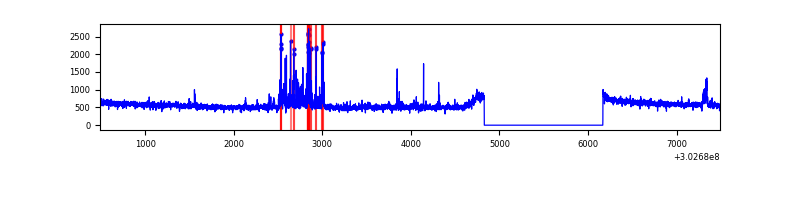 |
| C | 7003 | 5663 | 1 | 1 | 0.01% | 0.02% | 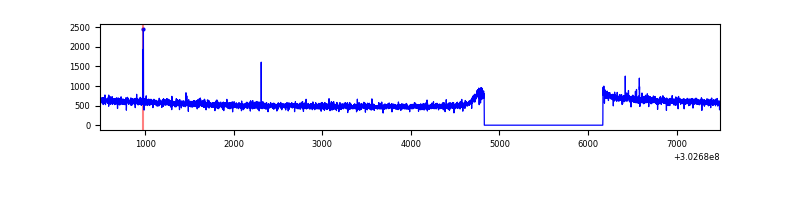 |
| D | 7002 | 5662 | 1279 | 1279 | 18.27% | 22.59% | 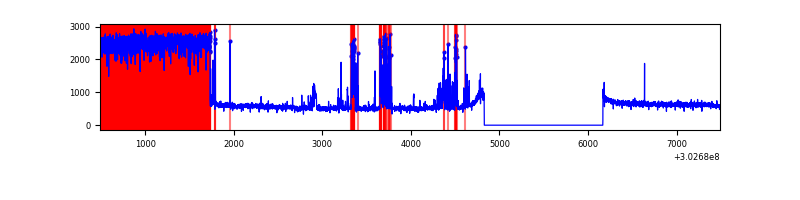 |
Top three noisy pixels from each quadrant. If the there are fewer than three noisy pixels in the level2.evt file, extra rows are filled as -1
| Pixel properties | Quadrant properties | ||||||
|---|---|---|---|---|---|---|---|
| Quadrant | DetID | PixID | Counts | Sigma | Mean | Median | Sigma |
| A | 0 | 226 | 7165 | 40.27 | 800 | 787 | 158.4 |
| A | 3 | 137 | 5932 | 32.48 | 800 | 787 | 158.4 |
| A | 12 | 194 | 5689 | 30.95 | 800 | 787 | 158.4 |
| B | 7 | 220 | 148995 | 1041.69 | 782 | 769 | 142.3 |
| B | 0 | 219 | 44519 | 307.46 | 782 | 769 | 142.3 |
| B | 3 | 64 | 25224 | 171.86 | 782 | 769 | 142.3 |
| C | 14 | 238 | 123752 | 714.36 | 765 | 774 | 172.2 |
| C | 9 | 54 | 12804 | 69.88 | 765 | 774 | 172.2 |
| C | 13 | 61 | 5446 | 27.14 | 765 | 774 | 172.2 |
| D | 1 | 52 | 2664100 | 16179.16 | 702 | 685 | 164.6 |
| D | 1 | 20 | 339209 | 2056.4 | 702 | 685 | 164.6 |
| D | 9 | 1 | 283011 | 1715.02 | 702 | 685 | 164.6 |
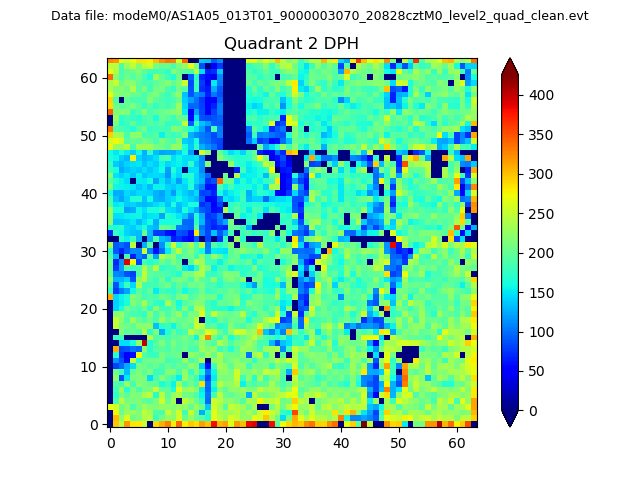
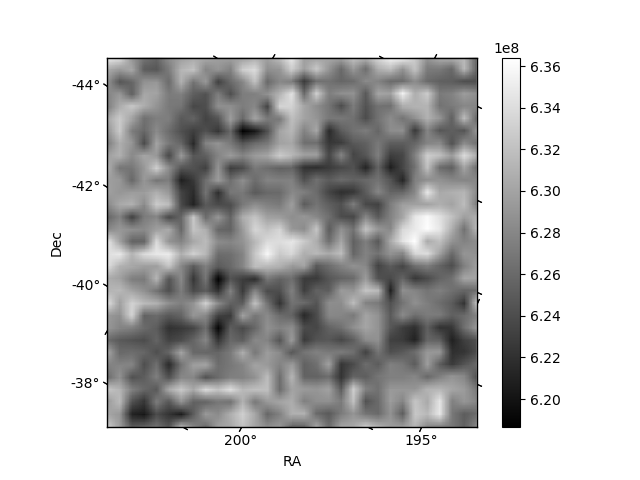
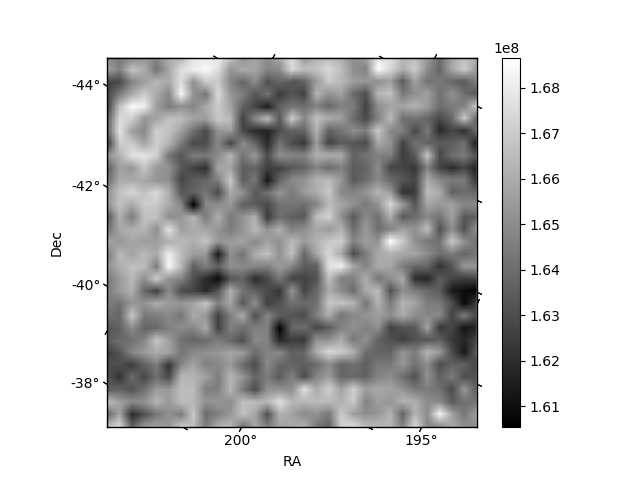
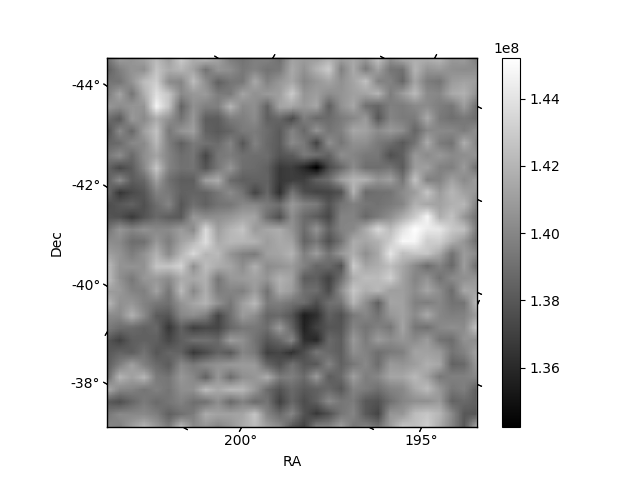
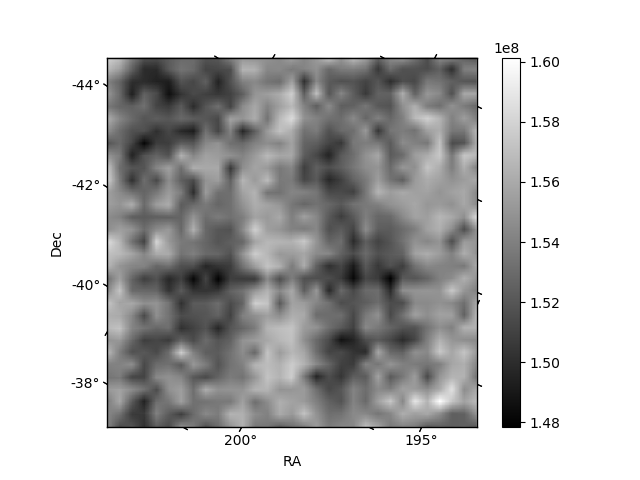
Histogram calculated using DETX and DETY for each event in the final _common_clean file
| Quadrant A | 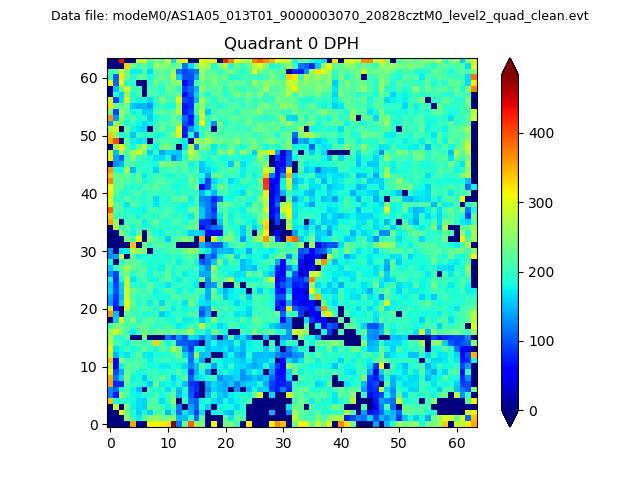 |
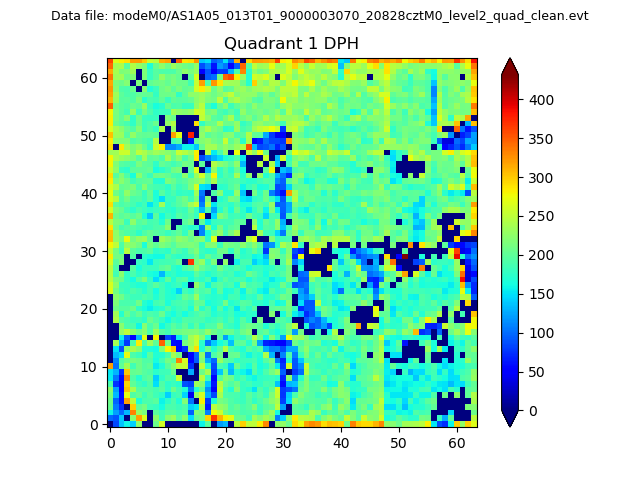 |
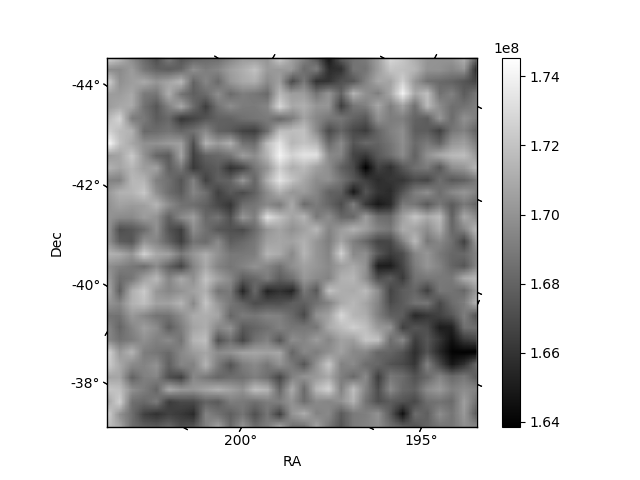
Quadrant B |
|---|---|---|---|
| Quadrant D | 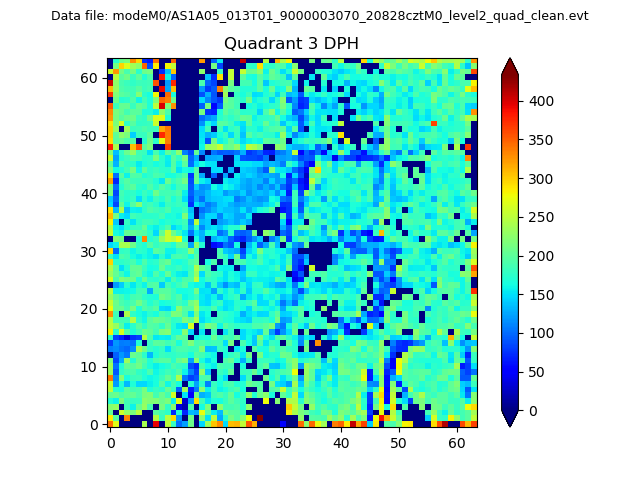 |
 |
Quadrant C |
| Plot type | Count rate plots | Images |
|---|---|---|
| Comparison with Poisson distribution Blue bars denote a histogram of data divided into 1 sec bins. Red curve is a Poisson curve with rate = median count rate of data. |
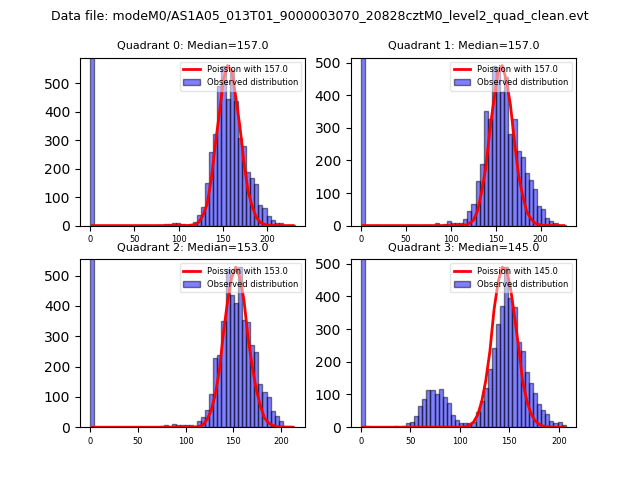 |
 |
| Quadrant-wise count rates Data is divided into 100 sec bins |
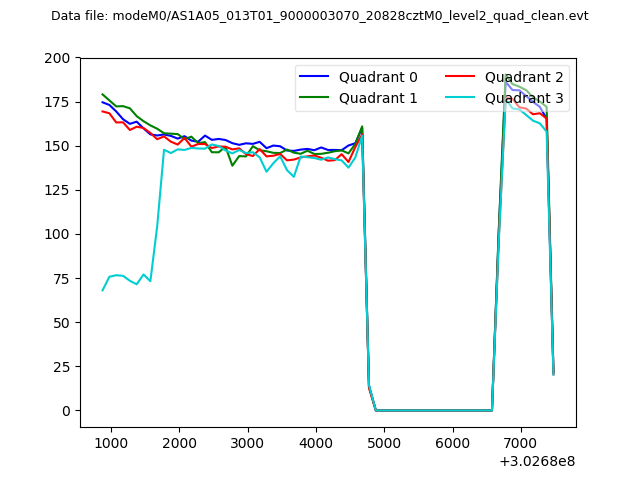 |
|
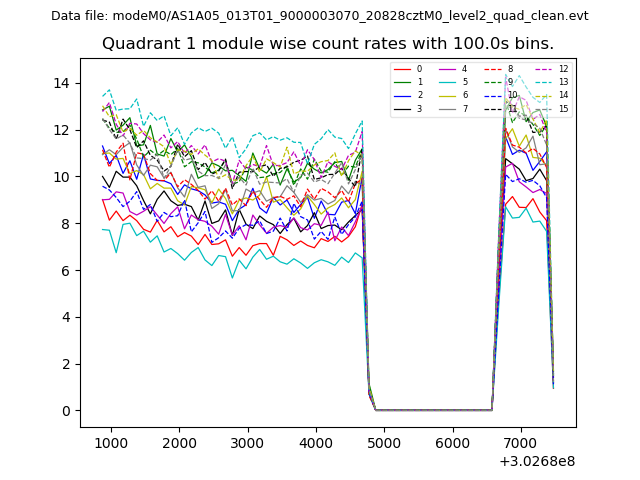
| Module-wise count rates for Quadrant A Data is divided into 100 sec bins |
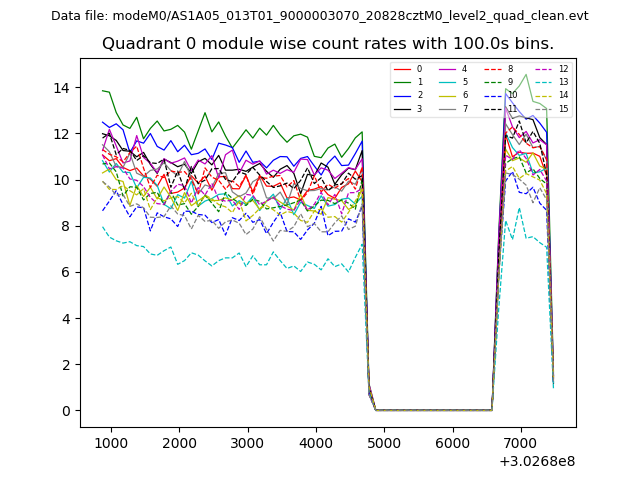 |
 |
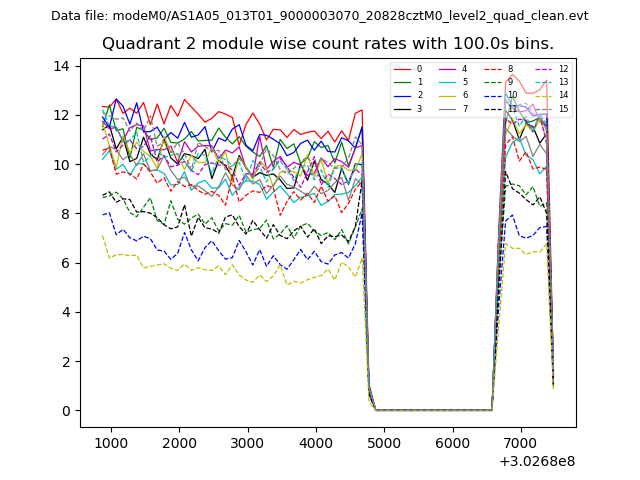
| Module-wise count rates for Quadrant B Data is divided into 100 sec bins |
 |
 |
| Module-wise count rates for Quadrant C Data is divided into 100 sec bins |
 |
 |
| Module-wise count rates for Quadrant D Data is divided into 100 sec bins |
 |
 |
| Parameter | Plot |
|---|---|
| CZT HV Monitor | 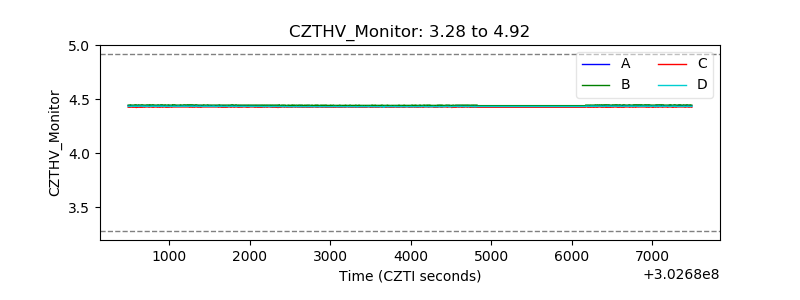 |
| D_VDD |  |
| Temperature 1 | 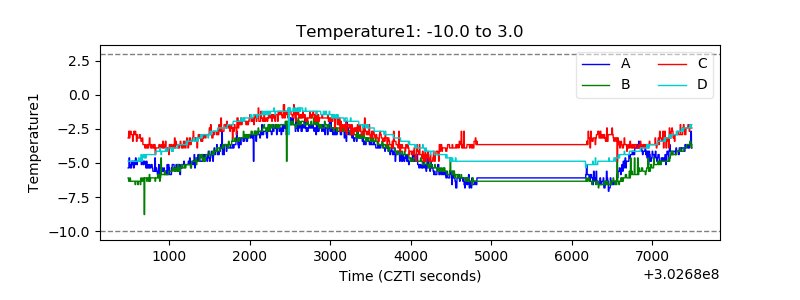 |
| Veto HV Monitor | 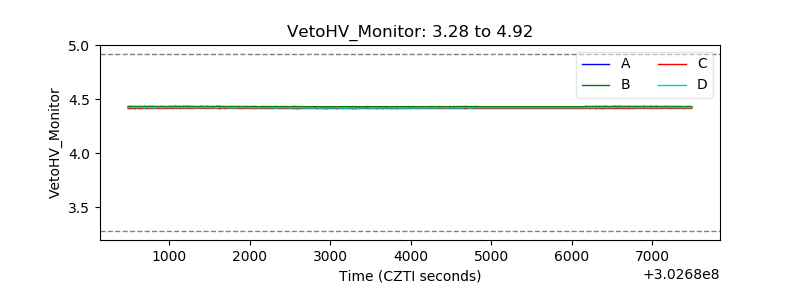 |
| Veto LLD |  |
| Alpha Counter | 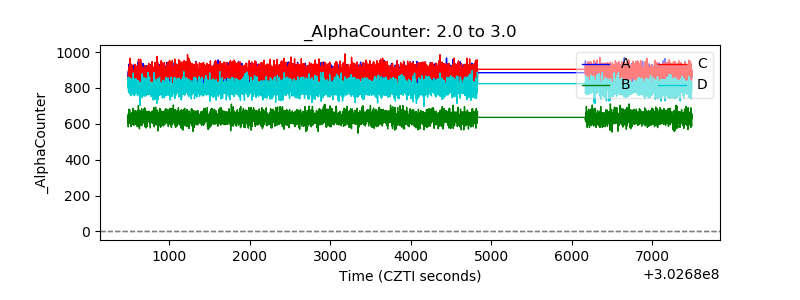 |
| _CPM_Rate | 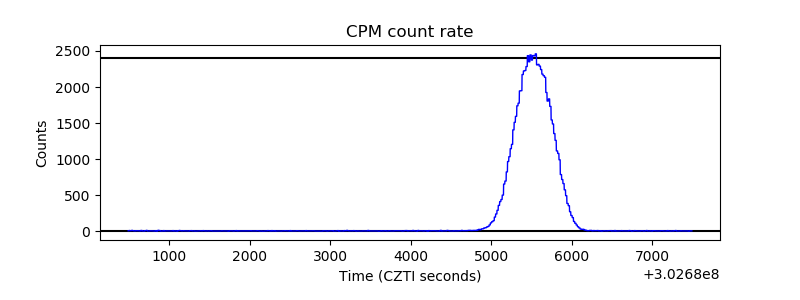 |
| CZT Counter | 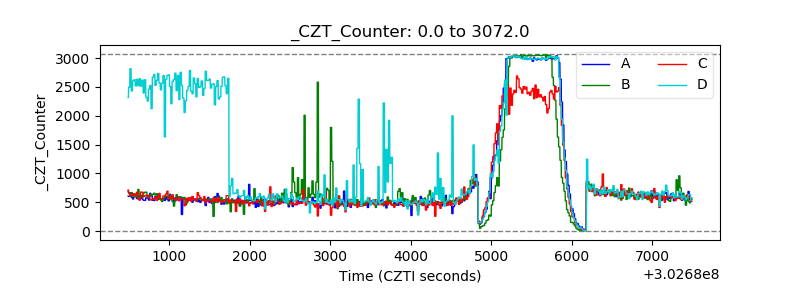 |
| +2.5 Volts monitor |  |
| +5 Volts monitor |  |
| _ROLL_ROT | 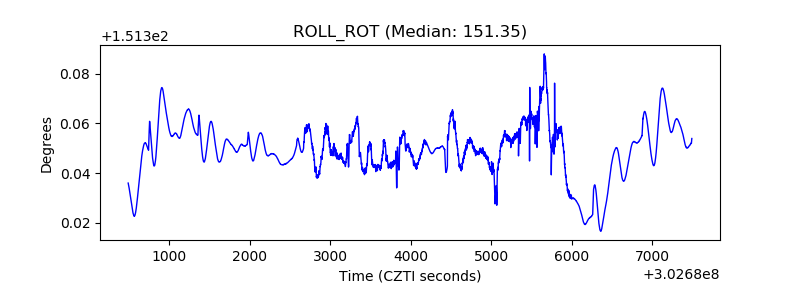 |
| _Roll_DEC | 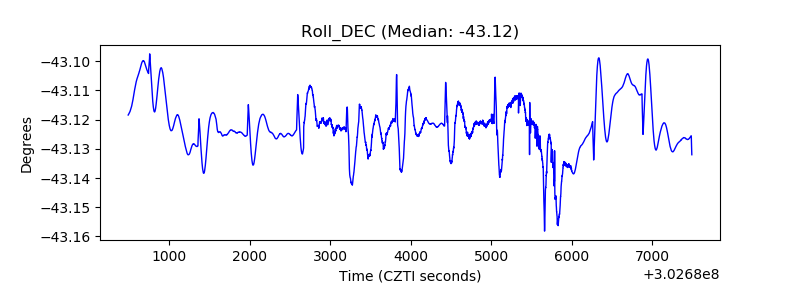 |
| _Roll_RA | 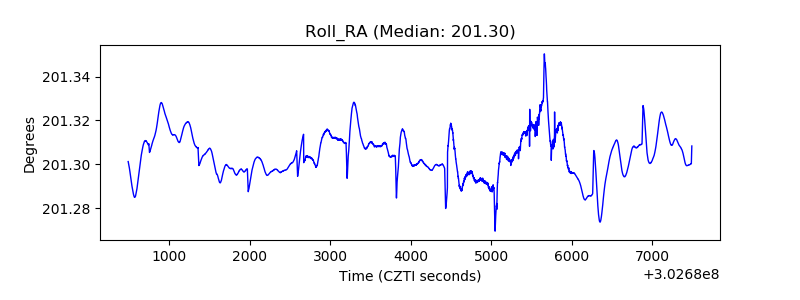 |
| Veto Counter | 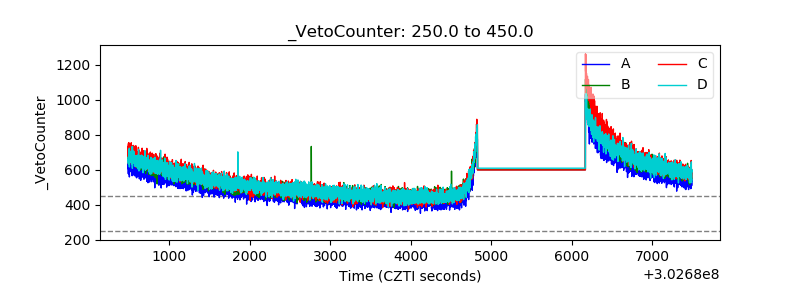 |