| Param | Original file | Final file |
|---|---|---|
| Filename | modeM0/AS1A05_013T01_9000003070_20829cztM0_level2.evt | modeM0/AS1A05_013T01_9000003070_20829cztM0_level2_quad_clean.evt |
| Size (bytes) | 498,695,040 | 118,039,680 |
| Size | 475.6 MB | 112.6 MB |
| Events in quadrant A | 3,296,061 | 816,461 |
| Events in quadrant B | 3,613,847 | 808,471 |
| Events in quadrant C | 3,318,308 | 786,521 |
| Events in quadrant D | 4,464,623 | 741,428 |
| Mode SS | |||
|---|---|---|---|
| Quadrant | BADHDUFLAG | Total packets | Discarded packets |
| A | 0 | 122 | 0 |
| B | 0 | 122 | 0 |
| C | 0 | 122 | 0 |
| D | 0 | 122 | 0 |
| Mode M0 | |||
|---|---|---|---|
| Quadrant | BADHDUFLAG | Total packets | Discarded packets |
| A | 0 | 13579 | 1 |
| B | 0 | 14574 | 1 |
| C | 0 | 13746 | 1 |
| D | 0 | 17436 | 1 |
| Mode M9 | |||
|---|---|---|---|
| Quadrant | BADHDUFLAG | Total packets | Discarded packets |
| A | 0 | 14 | 0 |
| B | 0 | 14 | 0 |
| C | 0 | 14 | 0 |
| D | 0 | 14 | 0 |
| Quadrant | Total seconds | Saturated seconds | Saturation percentage |
|---|---|---|---|
| A | 6049 | 81 | 1.339064% |
| B | 6048 | 137 | 2.265212% |
| C | 6048 | 139 | 2.298280% |
| D | 6048 | 397 | 6.564153% |
Noise dominated data is calculated using 1-second bins in cleaned event files. If a bin has >2000 counts, and if more than 50% of those come from <1% of pixels, then it is considered to be noise-dominated and hence unusable.
| Quadrant | # 1 sec bins | Bins with >0 counts | Bins with >2000 counts | High rate bins dominated by noise | Noise dominated (total time) | Noise dominated (detector-on time) | Marked lightcurve |
|---|---|---|---|---|---|---|---|
| A | 7384 | 6049 | 0 | 0 | 0.00% | 0.00% | 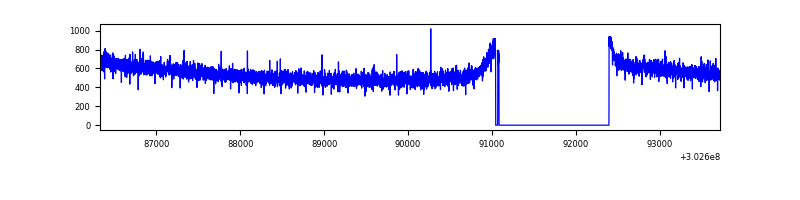 |
| B | 7383 | 6048 | 21 | 21 | 0.28% | 0.35% | 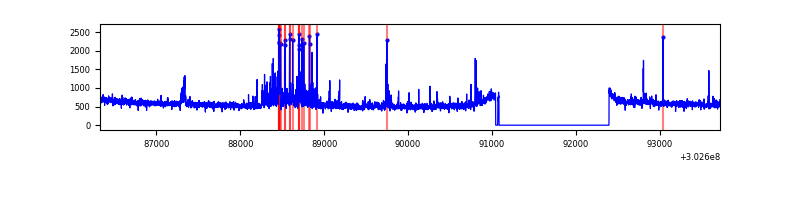 |
| C | 7383 | 6048 | 0 | 0 | 0.00% | 0.00% | 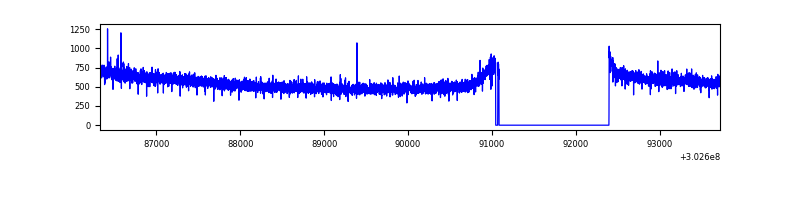 |
| D | 7382 | 6047 | 329 | 329 | 4.46% | 5.44% | 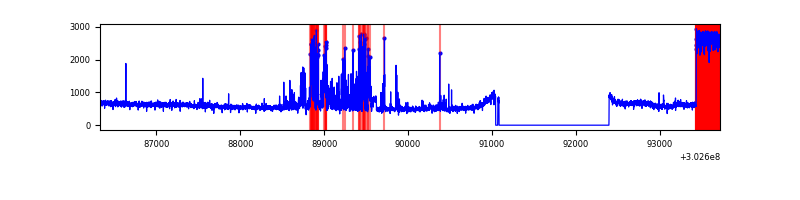 |
Top three noisy pixels from each quadrant. If the there are fewer than three noisy pixels in the level2.evt file, extra rows are filled as -1
| Pixel properties | Quadrant properties | ||||||
|---|---|---|---|---|---|---|---|
| Quadrant | DetID | PixID | Counts | Sigma | Mean | Median | Sigma |
| A | 0 | 226 | 7640 | 40.12 | 858 | 845 | 169.3 |
| A | 3 | 137 | 6182 | 31.51 | 858 | 845 | 169.3 |
| A | 12 | 194 | 6170 | 31.44 | 858 | 845 | 169.3 |
| B | 7 | 220 | 185692 | 1199.7 | 834 | 817 | 154.1 |
| B | 0 | 219 | 60892 | 389.84 | 834 | 817 | 154.1 |
| B | 0 | 189 | 40573 | 257.99 | 834 | 817 | 154.1 |
| C | 14 | 238 | 131690 | 709.88 | 813 | 821 | 184.4 |
| C | 3 | 233 | 11017 | 55.31 | 813 | 821 | 184.4 |
| C | 13 | 61 | 5749 | 26.73 | 813 | 821 | 184.4 |
| D | 1 | 52 | 684071 | 3558.6 | 811 | 790 | 192.0 |
| D | 1 | 20 | 265783 | 1380.11 | 811 | 790 | 192.0 |
| D | 1 | 239 | 239651 | 1244.01 | 811 | 790 | 192.0 |
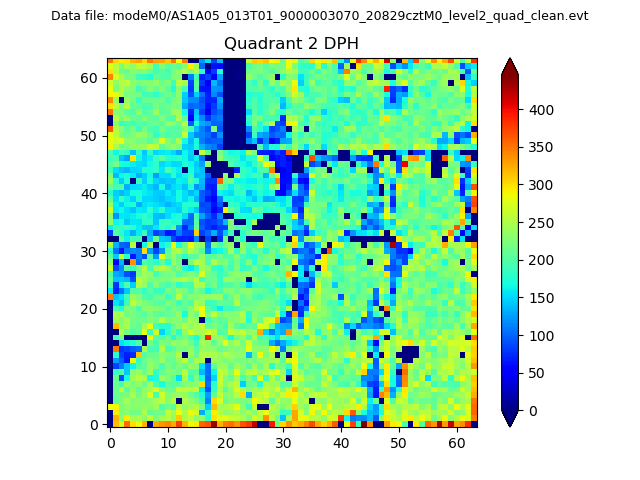
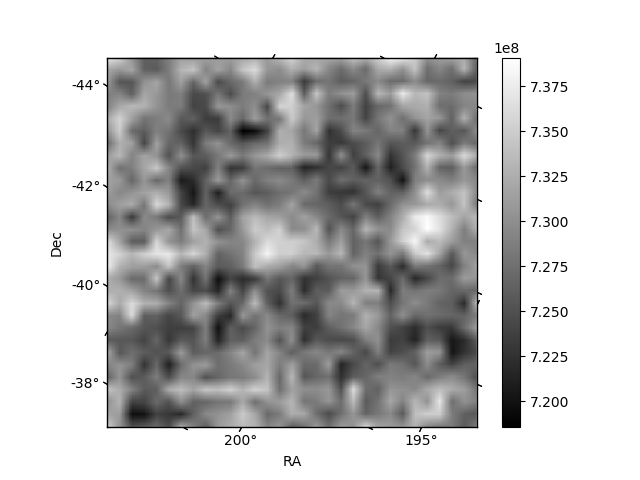
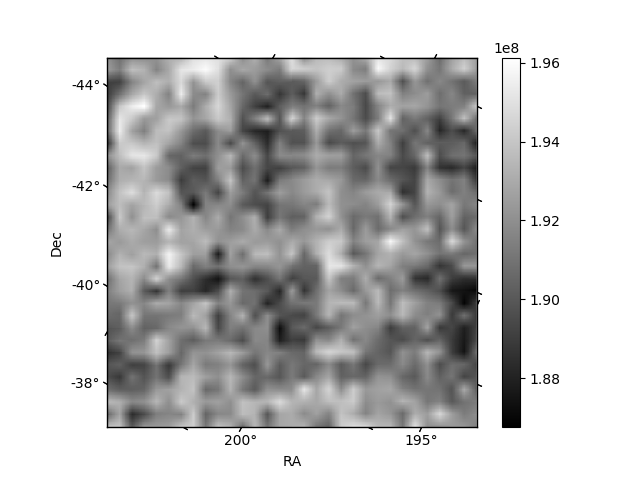
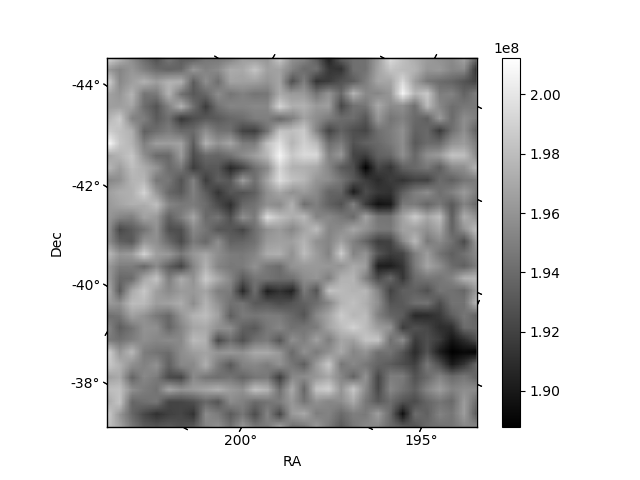
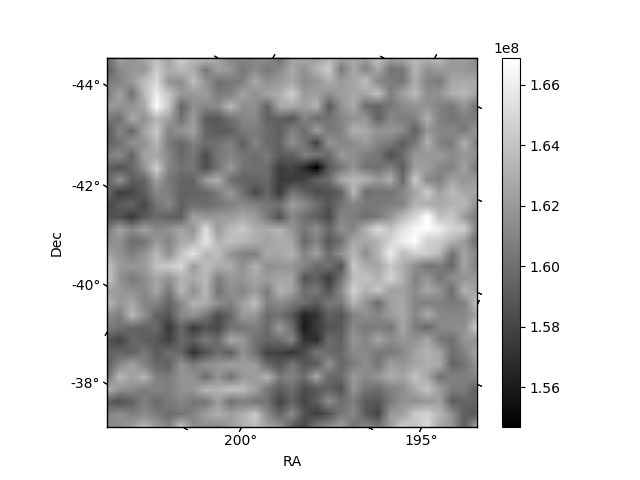
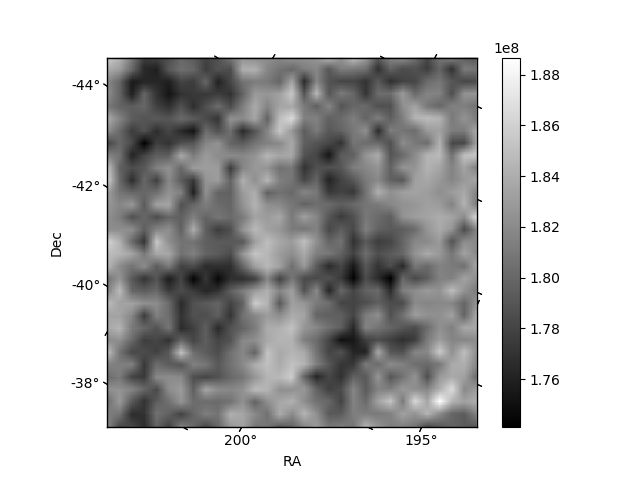
Histogram calculated using DETX and DETY for each event in the final _common_clean file
| Quadrant A | 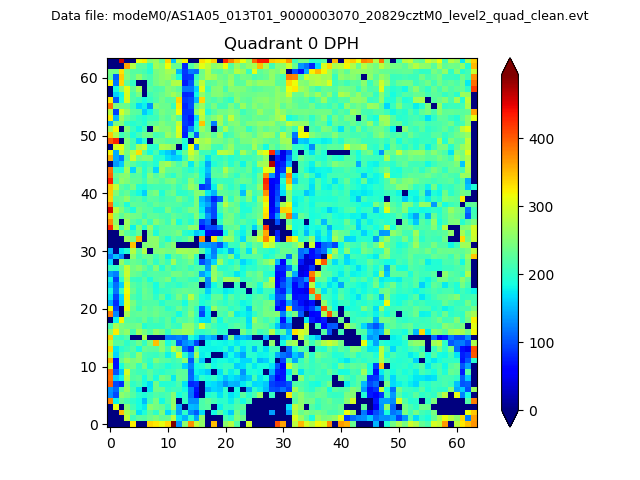 |
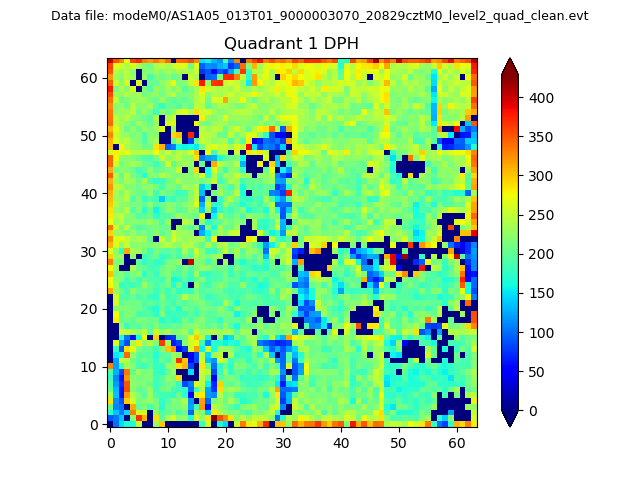 |
Quadrant B |
|---|---|---|---|
| Quadrant D | 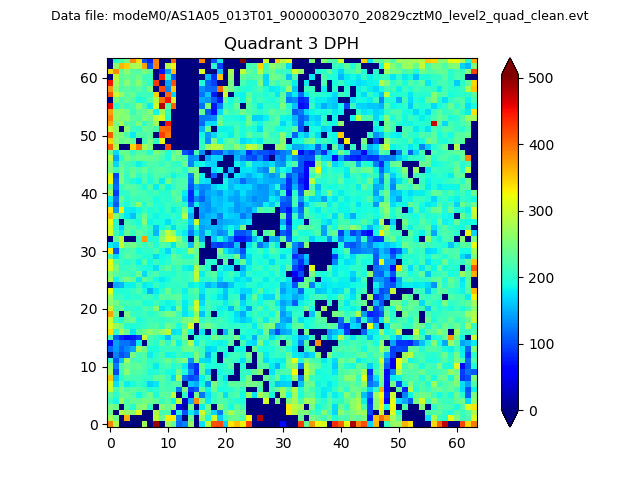 |
 |
Quadrant C |
| Plot type | Count rate plots | Images |
|---|---|---|
| Comparison with Poisson distribution Blue bars denote a histogram of data divided into 1 sec bins. Red curve is a Poisson curve with rate = median count rate of data. |
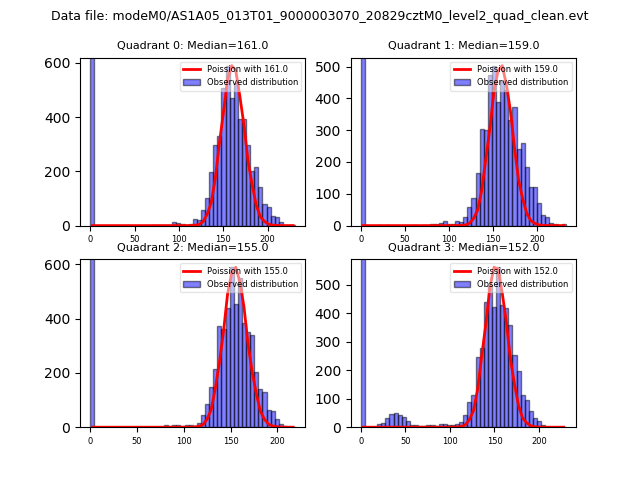 |
 |
| Quadrant-wise count rates Data is divided into 100 sec bins |
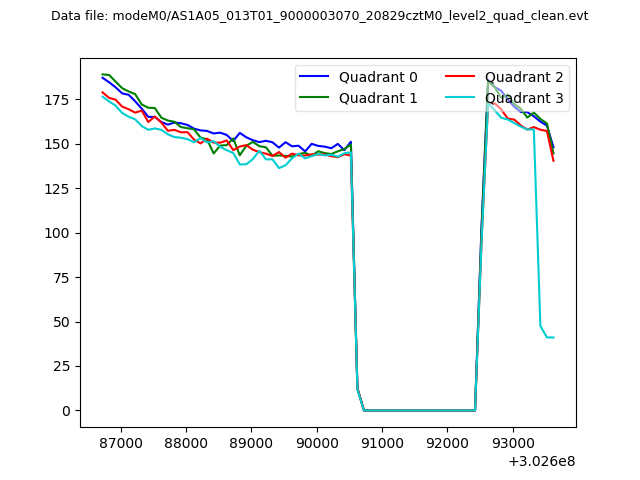 |
|
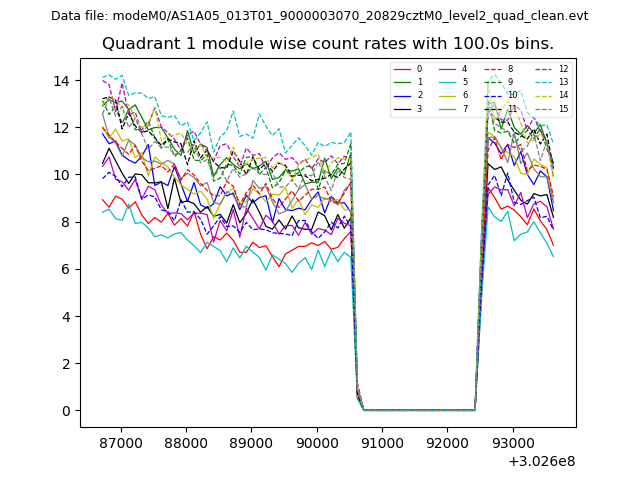
| Module-wise count rates for Quadrant A Data is divided into 100 sec bins |
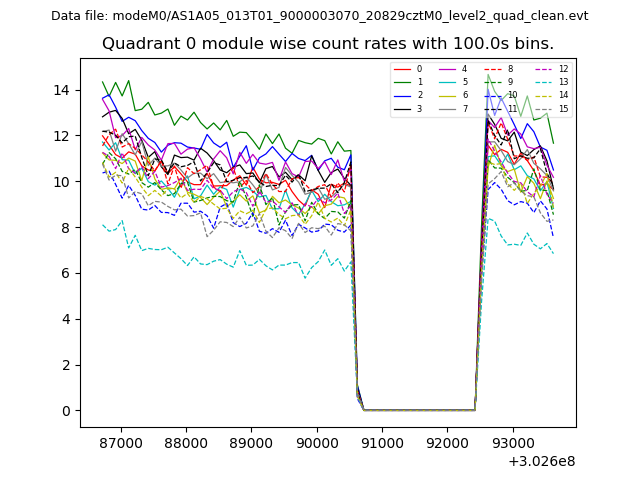 |
 |
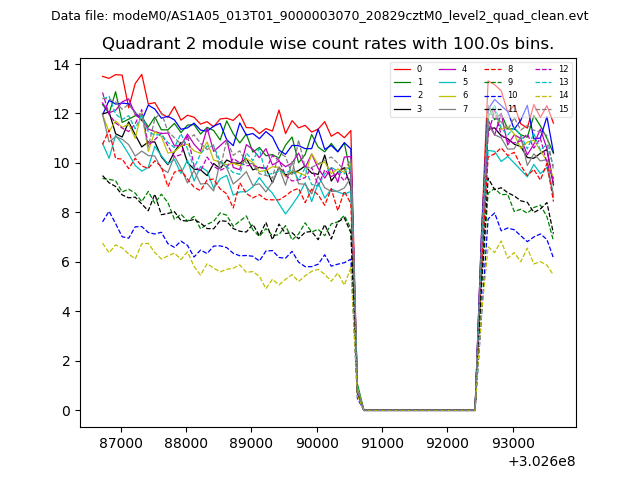
| Module-wise count rates for Quadrant B Data is divided into 100 sec bins |
 |
 |
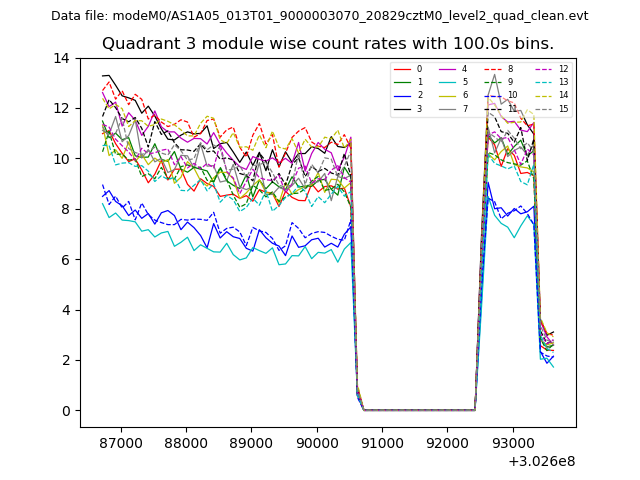
| Module-wise count rates for Quadrant C Data is divided into 100 sec bins |
 |
 |
| Module-wise count rates for Quadrant D Data is divided into 100 sec bins |
 |
 |
| Parameter | Plot |
|---|---|
| CZT HV Monitor | 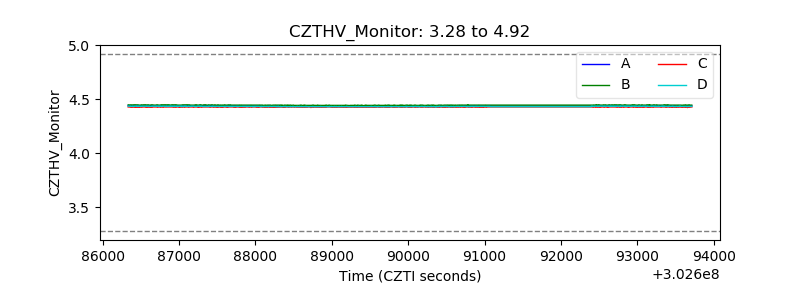 |
| D_VDD | 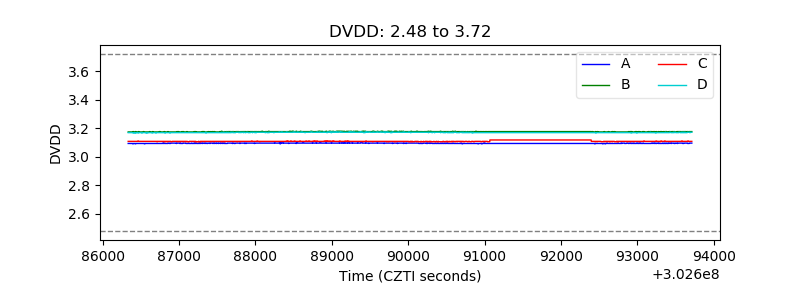 |
| Temperature 1 |  |
| Veto HV Monitor | 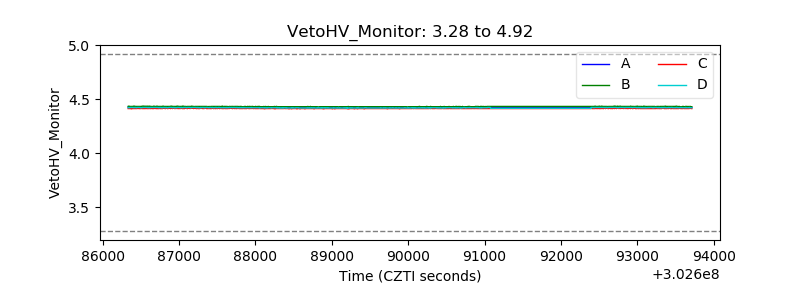 |
| Veto LLD | 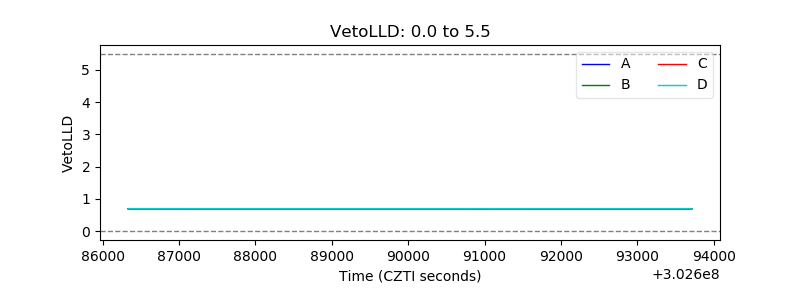 |
| Alpha Counter | 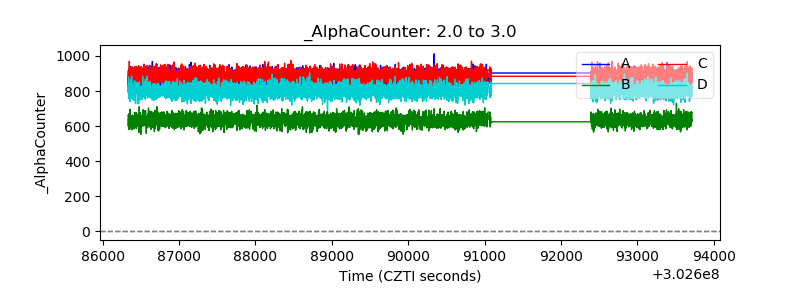 |
| _CPM_Rate | 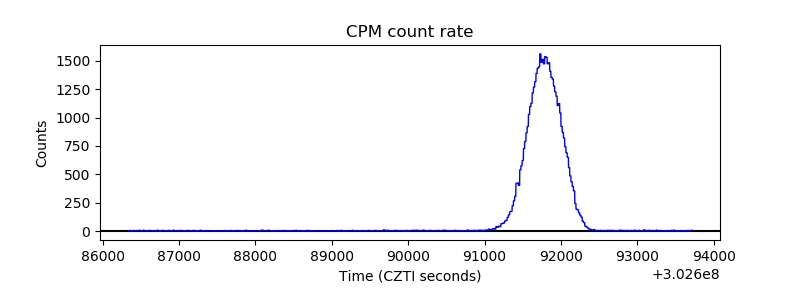 |
| CZT Counter | 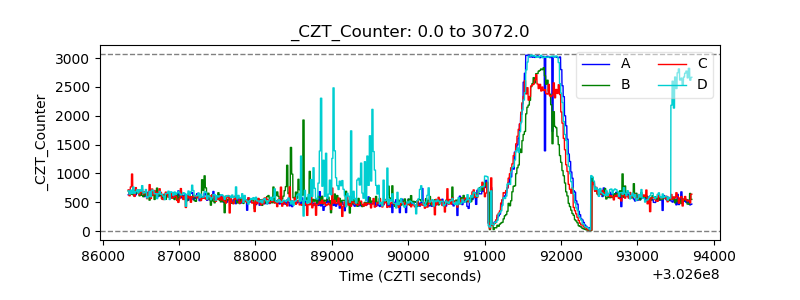 |
| +2.5 Volts monitor |  |
| +5 Volts monitor |  |
| _ROLL_ROT | 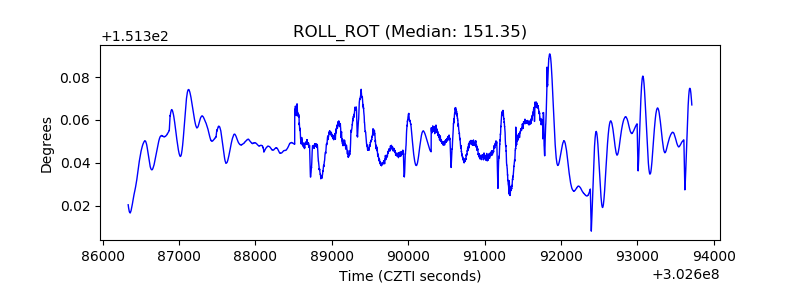 |
| _Roll_DEC | 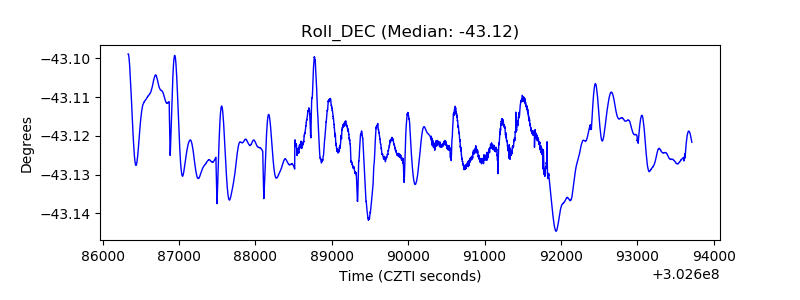 |
| _Roll_RA | 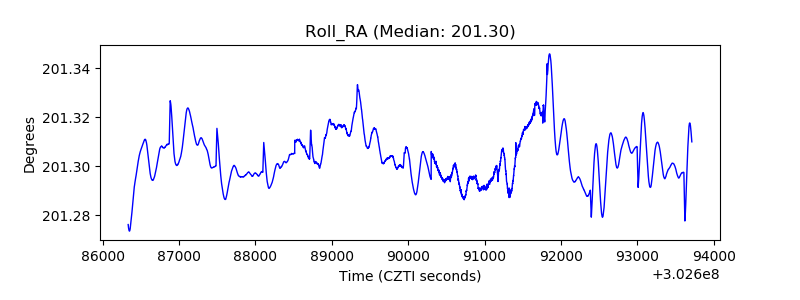 |
| Veto Counter | 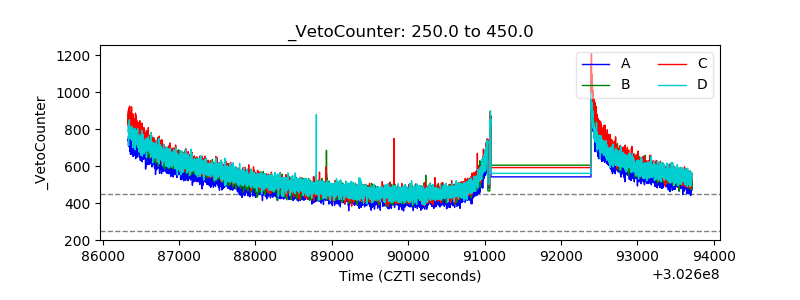 |