| Param | Original file | Final file |
|---|---|---|
| Filename | modeM0/AS1A05_013T01_9000003070_20833cztM0_level2.evt | modeM0/AS1A05_013T01_9000003070_20833cztM0_level2_quad_clean.evt |
| Size (bytes) | 614,229,120 | 104,423,040 |
| Size | 585.8 MB | 99.6 MB |
| Events in quadrant A | 3,337,114 | 688,724 |
| Events in quadrant B | 3,978,346 | 679,493 |
| Events in quadrant C | 3,373,522 | 663,099 |
| Events in quadrant D | 7,430,704 | 634,524 |
| Mode SS | |||
|---|---|---|---|
| Quadrant | BADHDUFLAG | Total packets | Discarded packets |
| A | 0 | 146 | 0 |
| B | 0 | 146 | 0 |
| C | 0 | 146 | 0 |
| D | 0 | 146 | 0 |
| Mode M0 | |||
|---|---|---|---|
| Quadrant | BADHDUFLAG | Total packets | Discarded packets |
| A | 0 | 14622 | 1 |
| B | 0 | 16444 | 1 |
| C | 0 | 14709 | 1 |
| D | 0 | 27350 | 1 |
| Mode M9 | |||
|---|---|---|---|
| Quadrant | BADHDUFLAG | Total packets | Discarded packets |
| A | 0 | 2 | 0 |
| B | 0 | 2 | 0 |
| C | 0 | 2 | 0 |
| D | 0 | 2 | 0 |
| Quadrant | Total seconds | Saturated seconds | Saturation percentage |
|---|---|---|---|
| A | 7123 | 36 | 0.505405% |
| B | 7124 | 88 | 1.235261% |
| C | 7123 | 64 | 0.898498% |
| D | 7123 | 499 | 7.005475% |
Noise dominated data is calculated using 1-second bins in cleaned event files. If a bin has >2000 counts, and if more than 50% of those come from <1% of pixels, then it is considered to be noise-dominated and hence unusable.
| Quadrant | # 1 sec bins | Bins with >0 counts | Bins with >2000 counts | High rate bins dominated by noise | Noise dominated (total time) | Noise dominated (detector-on time) | Marked lightcurve |
|---|---|---|---|---|---|---|---|
| A | 7338 | 7123 | 0 | 0 | 0.00% | 0.00% | 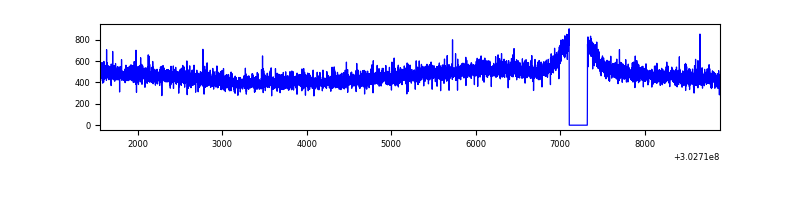 |
| B | 7339 | 7124 | 16 | 16 | 0.22% | 0.22% | 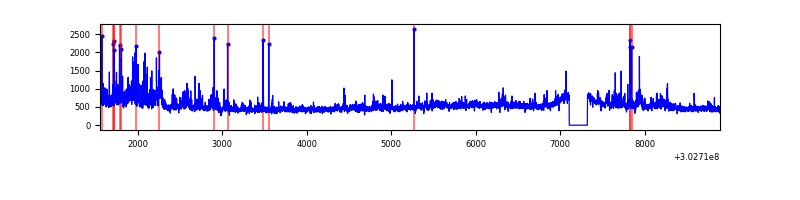 |
| C | 7338 | 7123 | 0 | 0 | 0.00% | 0.00% | 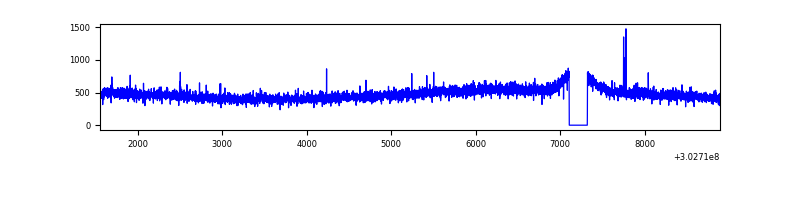 |
| D | 7338 | 7123 | 971 | 971 | 13.23% | 13.63% | 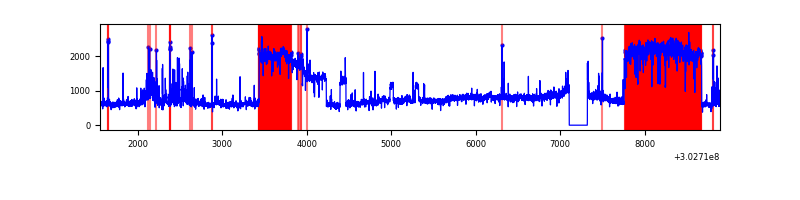 |
Top three noisy pixels from each quadrant. If the there are fewer than three noisy pixels in the level2.evt file, extra rows are filled as -1
| Pixel properties | Quadrant properties | ||||||
|---|---|---|---|---|---|---|---|
| Quadrant | DetID | PixID | Counts | Sigma | Mean | Median | Sigma |
| A | 0 | 226 | 7577 | 38.36 | 868 | 852 | 175.3 |
| A | 3 | 137 | 6897 | 34.48 | 868 | 852 | 175.3 |
| A | 12 | 194 | 6206 | 30.54 | 868 | 852 | 175.3 |
| B | 0 | 189 | 230889 | 1400.5 | 856 | 834 | 164.3 |
| B | 7 | 220 | 140694 | 851.42 | 856 | 834 | 164.3 |
| B | 0 | 219 | 94723 | 571.57 | 856 | 834 | 164.3 |
| C | 14 | 238 | 129268 | 669.61 | 823 | 827 | 191.8 |
| C | 3 | 233 | 21933 | 110.03 | 823 | 827 | 191.8 |
| C | 0 | 207 | 7303 | 33.76 | 823 | 827 | 191.8 |
| D | 1 | 20 | 3883578 | 19353.37 | 830 | 804 | 200.6 |
| D | 9 | 1 | 110537 | 546.96 | 830 | 804 | 200.6 |
| D | 1 | 52 | 90646 | 447.81 | 830 | 804 | 200.6 |
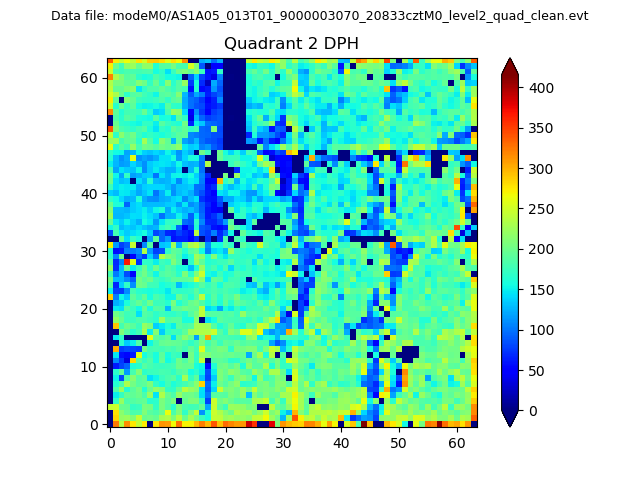
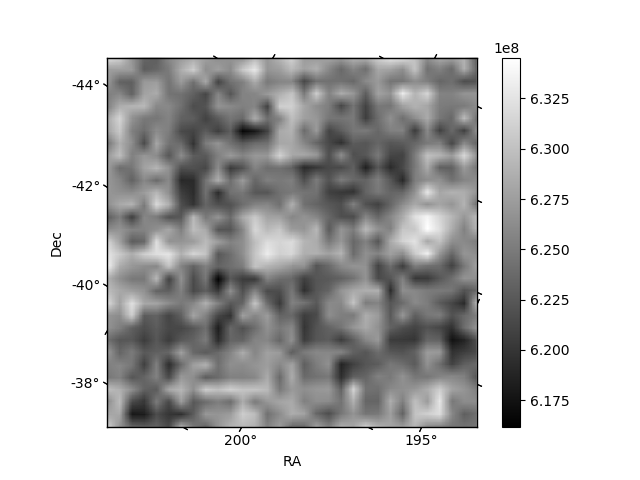
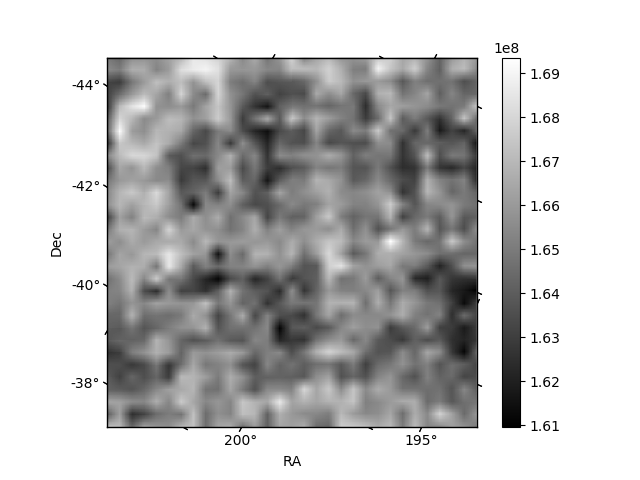
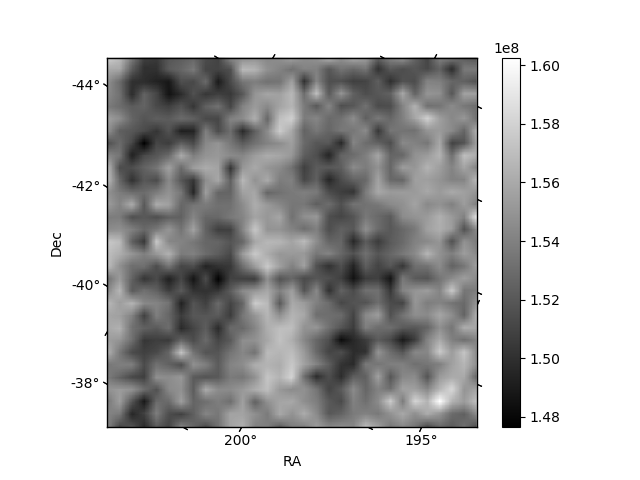
Histogram calculated using DETX and DETY for each event in the final _common_clean file
| Quadrant A | 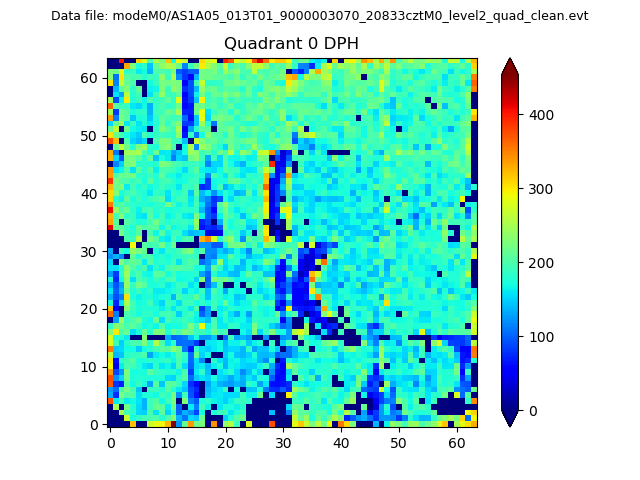 |
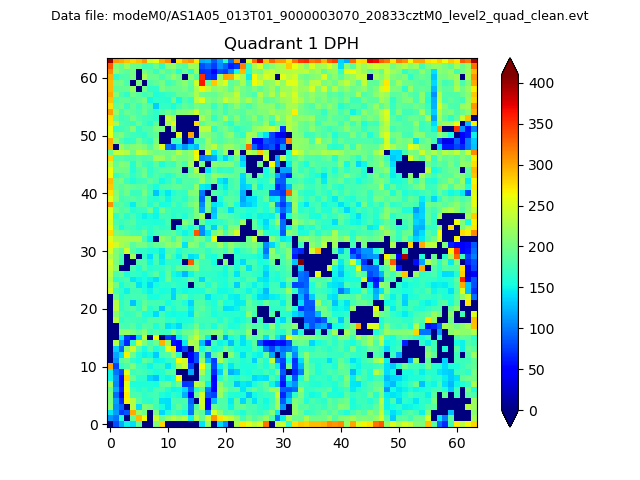 |
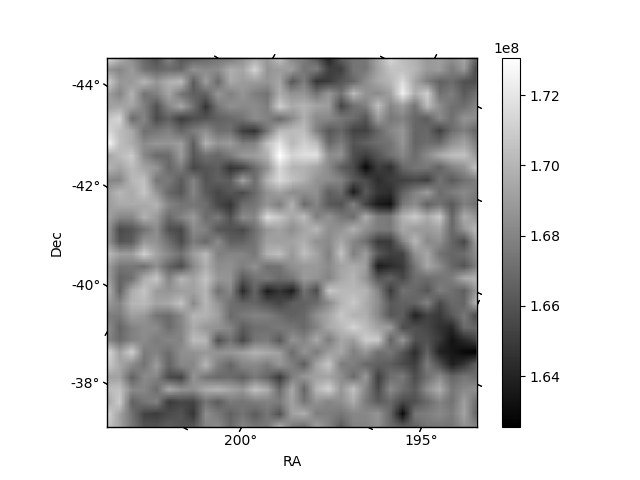
Quadrant B |
|---|---|---|---|
| Quadrant D | 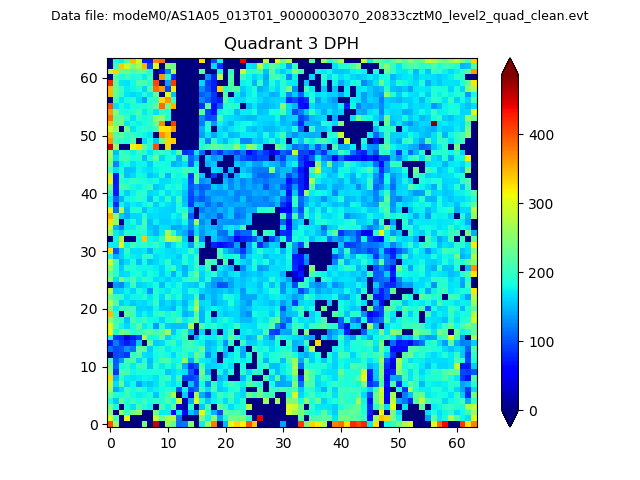 |
 |
Quadrant C |
| Plot type | Count rate plots | Images |
|---|---|---|
| Comparison with Poisson distribution Blue bars denote a histogram of data divided into 1 sec bins. Red curve is a Poisson curve with rate = median count rate of data. |
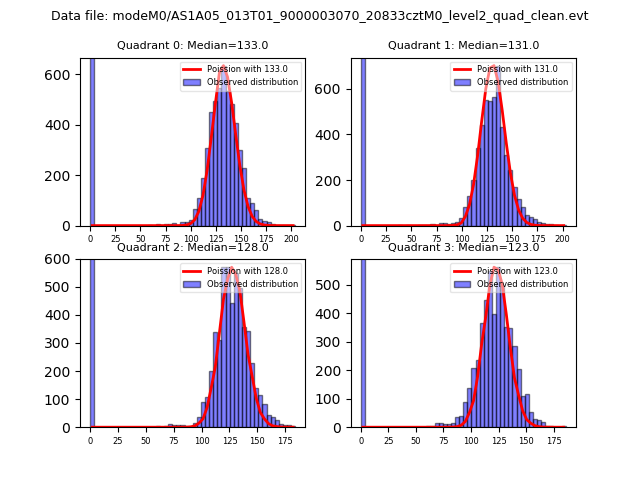 |
 |
| Quadrant-wise count rates Data is divided into 100 sec bins |
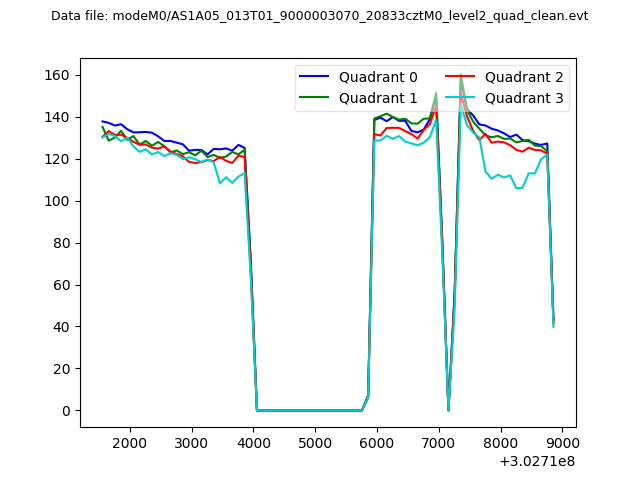 |
|
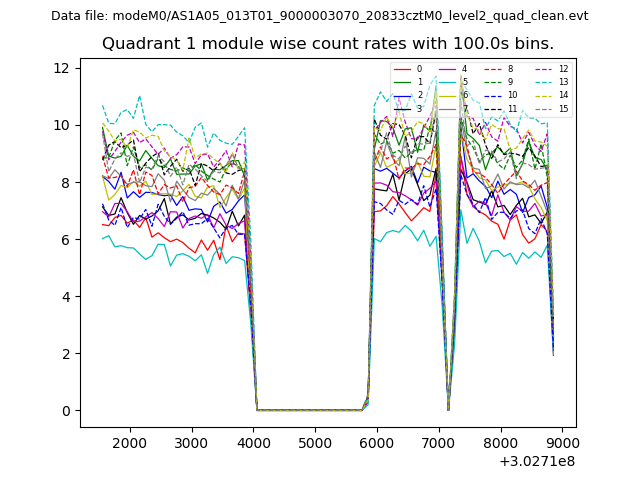
| Module-wise count rates for Quadrant A Data is divided into 100 sec bins |
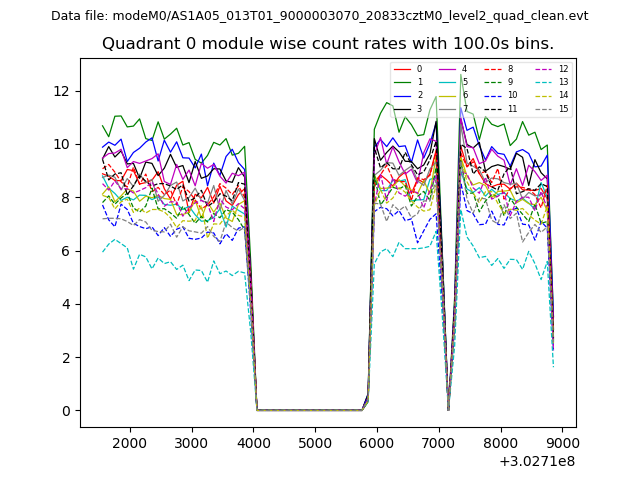 |
 |
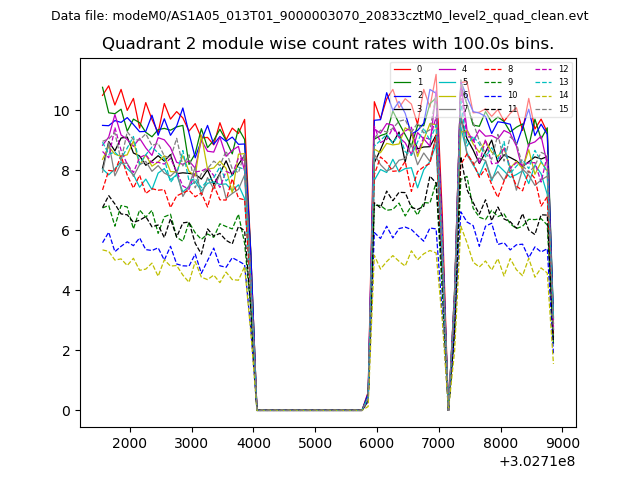
| Module-wise count rates for Quadrant B Data is divided into 100 sec bins |
 |
 |
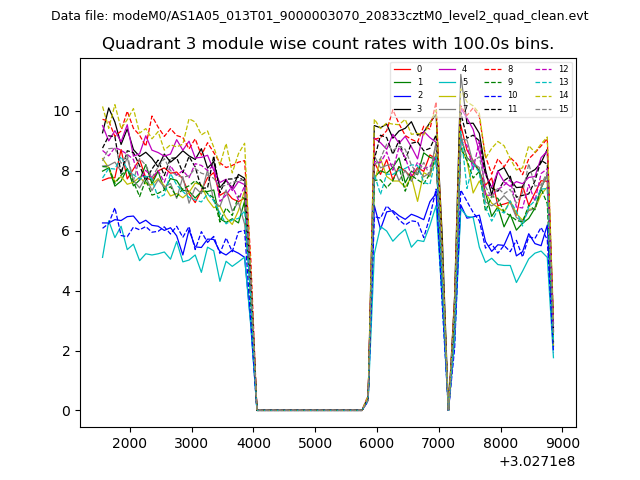
| Module-wise count rates for Quadrant C Data is divided into 100 sec bins |
 |
 |
| Module-wise count rates for Quadrant D Data is divided into 100 sec bins |
 |
 |
| Parameter | Plot |
|---|---|
| CZT HV Monitor | 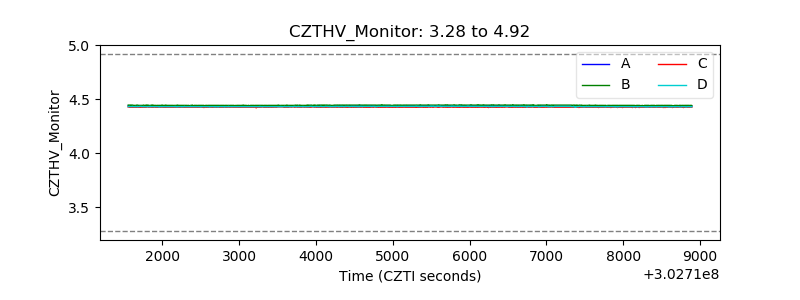 |
| D_VDD | 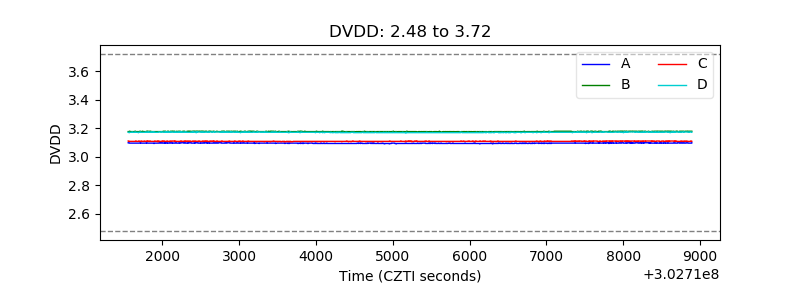 |
| Temperature 1 | 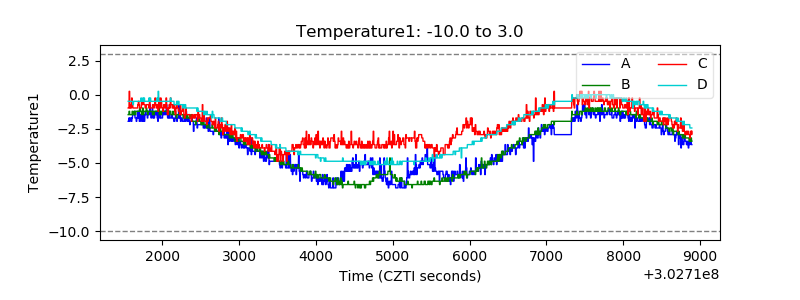 |
| Veto HV Monitor | 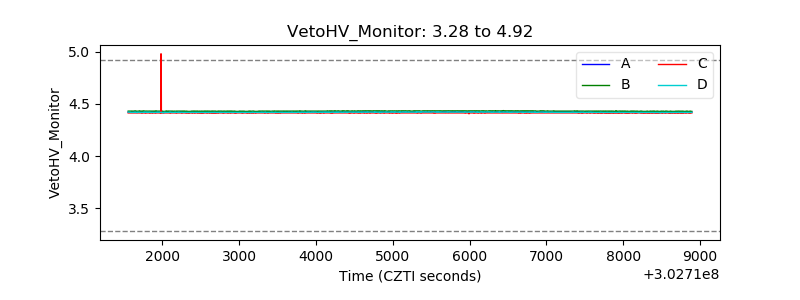 |
| Veto LLD | 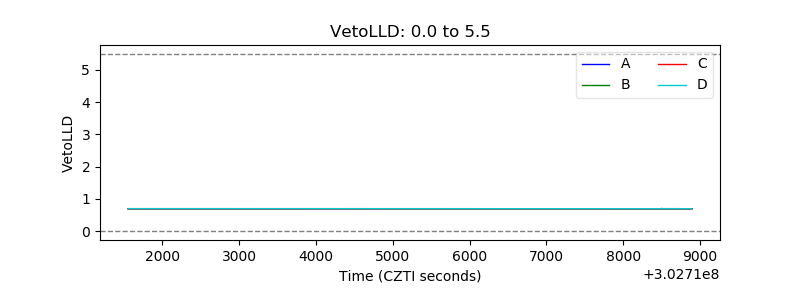 |
| Alpha Counter | 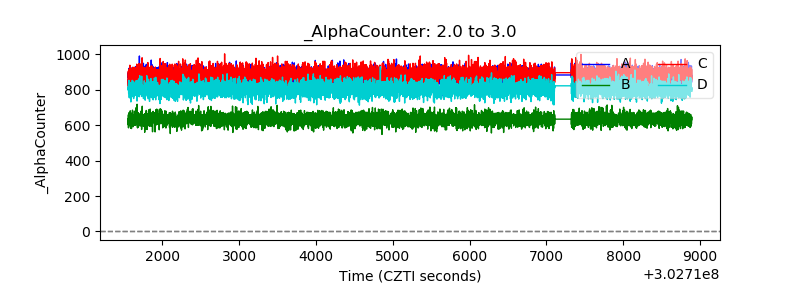 |
| _CPM_Rate | 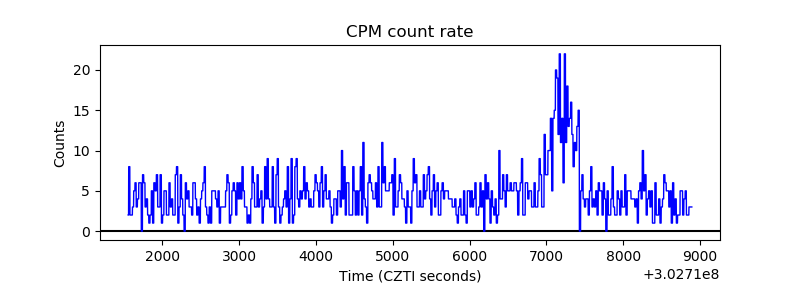 |
| CZT Counter | 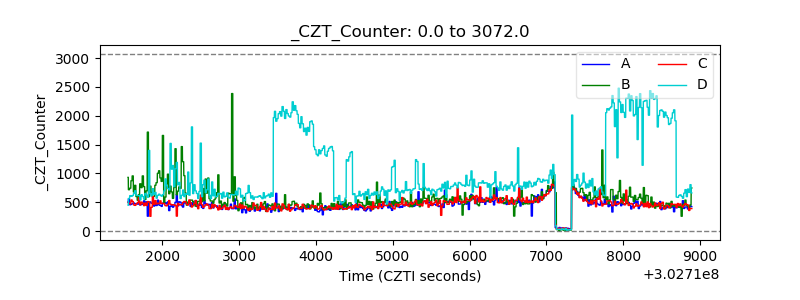 |
| +2.5 Volts monitor |  |
| +5 Volts monitor |  |
| _ROLL_ROT | 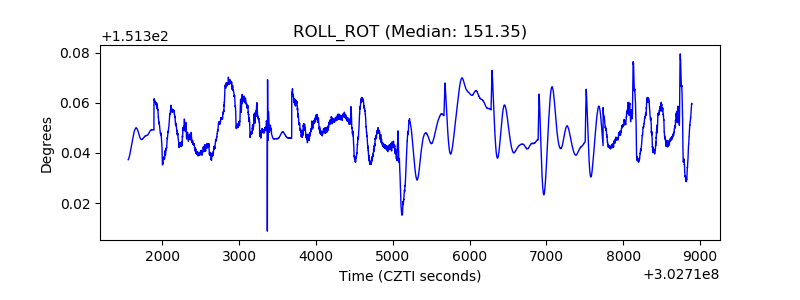 |
| _Roll_DEC | 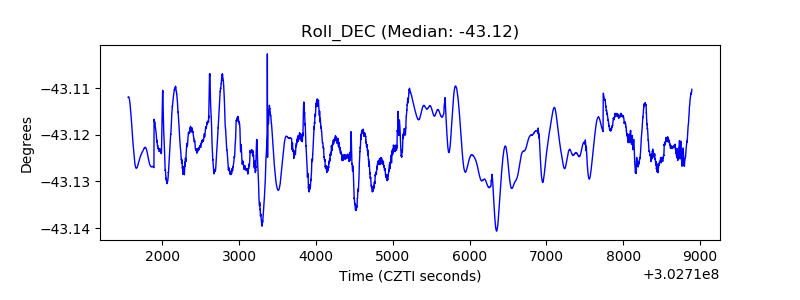 |
| _Roll_RA | 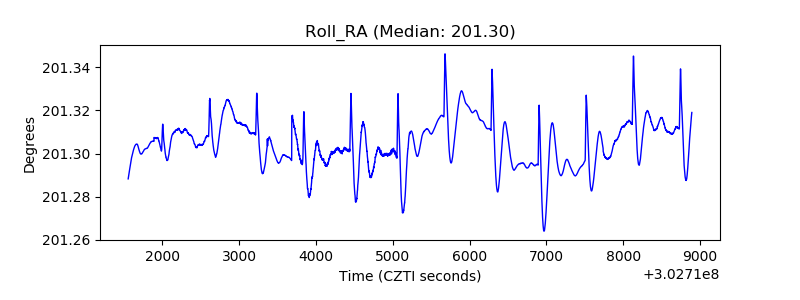 |
| Veto Counter | 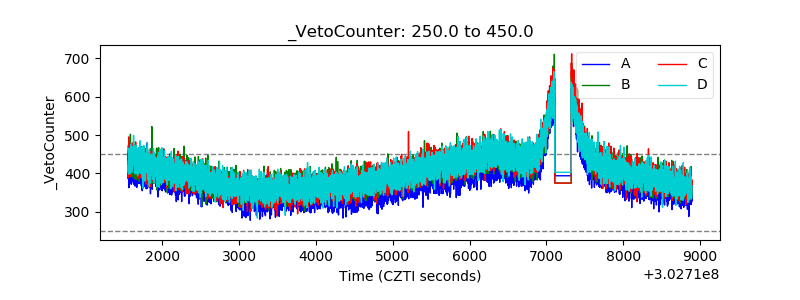 |