| Param | Original file | Final file |
|---|---|---|
| Filename | modeM0/AS1A05_013T01_9000003070_20837cztM0_level2.evt | modeM0/AS1A05_013T01_9000003070_20837cztM0_level2_quad_clean.evt |
| Size (bytes) | 542,191,680 | 91,848,960 |
| Size | 517.1 MB | 87.6 MB |
| Events in quadrant A | 3,232,650 | 600,831 |
| Events in quadrant B | 3,318,530 | 590,860 |
| Events in quadrant C | 3,134,200 | 575,292 |
| Events in quadrant D | 6,296,411 | 562,766 |
| Mode SS | |||
|---|---|---|---|
| Quadrant | BADHDUFLAG | Total packets | Discarded packets |
| A | 0 | 130 | 0 |
| B | 0 | 130 | 0 |
| C | 0 | 130 | 0 |
| D | 0 | 130 | 0 |
| Mode M0 | |||
|---|---|---|---|
| Quadrant | BADHDUFLAG | Total packets | Discarded packets |
| A | 0 | 13863 | 1 |
| B | 0 | 13954 | 1 |
| C | 0 | 13642 | 1 |
| D | 0 | 23629 | 1 |
| Mode M9 | |||
|---|---|---|---|
| Quadrant | BADHDUFLAG | Total packets | Discarded packets |
| A | 0 | 5 | 0 |
| B | 0 | 5 | 0 |
| C | 0 | 5 | 0 |
| D | 0 | 5 | 0 |
| Quadrant | Total seconds | Saturated seconds | Saturation percentage |
|---|---|---|---|
| A | 6480 | 88 | 1.358025% |
| B | 6480 | 72 | 1.111111% |
| C | 6481 | 87 | 1.342385% |
| D | 6481 | 161 | 2.484185% |
Noise dominated data is calculated using 1-second bins in cleaned event files. If a bin has >2000 counts, and if more than 50% of those come from <1% of pixels, then it is considered to be noise-dominated and hence unusable.
| Quadrant | # 1 sec bins | Bins with >0 counts | Bins with >2000 counts | High rate bins dominated by noise | Noise dominated (total time) | Noise dominated (detector-on time) | Marked lightcurve |
|---|---|---|---|---|---|---|---|
| A | 6940 | 6480 | 62 | 62 | 0.89% | 0.96% | 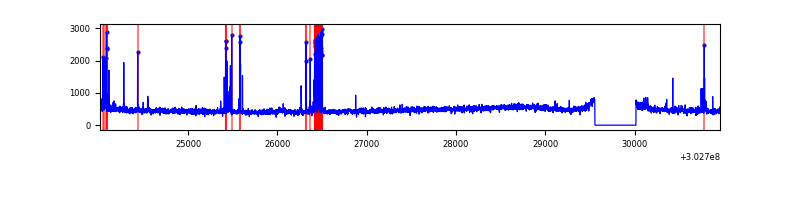 |
| B | 6940 | 6480 | 22 | 22 | 0.32% | 0.34% | 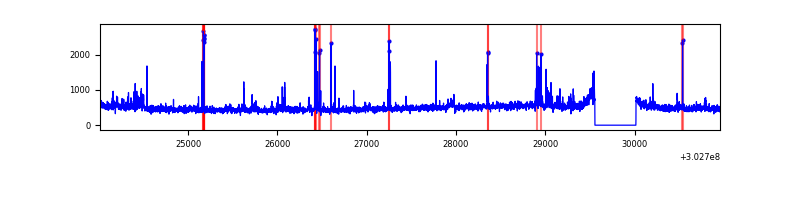 |
| C | 6941 | 6482 | 27 | 27 | 0.39% | 0.42% | 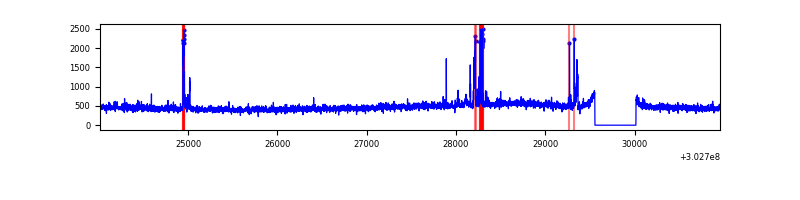 |
| D | 6941 | 6481 | 171 | 171 | 2.46% | 2.64% | 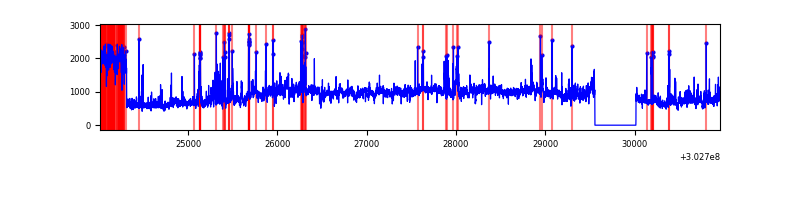 |
Top three noisy pixels from each quadrant. If the there are fewer than three noisy pixels in the level2.evt file, extra rows are filled as -1
| Pixel properties | Quadrant properties | ||||||
|---|---|---|---|---|---|---|---|
| Quadrant | DetID | PixID | Counts | Sigma | Mean | Median | Sigma |
| A | 5 | 16 | 256893 | 1644.14 | 772 | 757 | 155.8 |
| A | 5 | 203 | 7850 | 45.53 | 772 | 757 | 155.8 |
| A | 0 | 226 | 6709 | 38.2 | 772 | 757 | 155.8 |
| B | 0 | 189 | 97840 | 660.02 | 765 | 747 | 147.1 |
| B | 3 | 64 | 68963 | 463.72 | 765 | 747 | 147.1 |
| B | 7 | 220 | 59119 | 396.8 | 765 | 747 | 147.1 |
| C | 9 | 54 | 150122 | 865.13 | 733 | 737 | 172.7 |
| C | 14 | 238 | 112219 | 645.63 | 733 | 737 | 172.7 |
| C | 13 | 61 | 5173 | 25.69 | 733 | 737 | 172.7 |
| D | 1 | 20 | 2856492 | 15855.57 | 742 | 721 | 180.1 |
| D | 1 | 52 | 373500 | 2069.71 | 742 | 721 | 180.1 |
| D | 1 | 239 | 73958 | 406.62 | 742 | 721 | 180.1 |
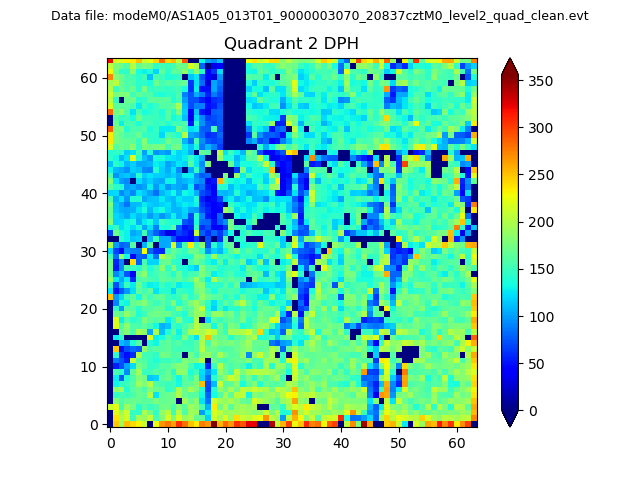
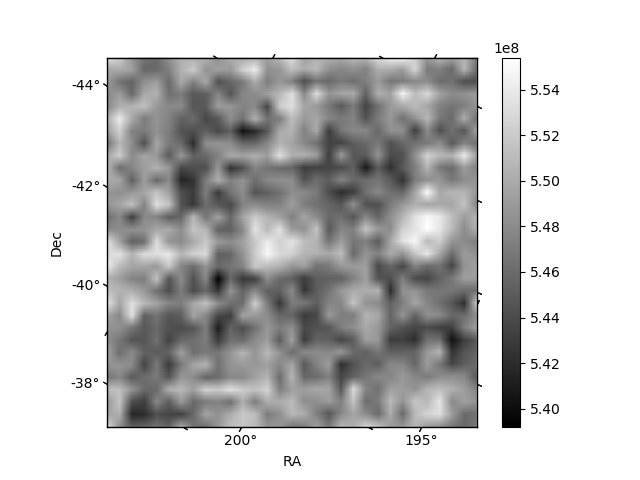
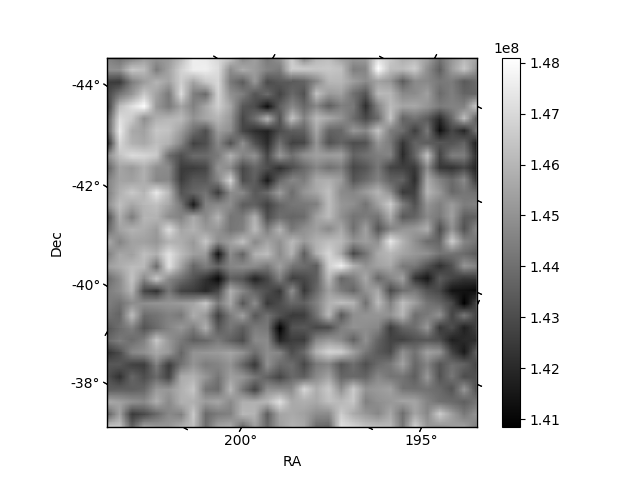
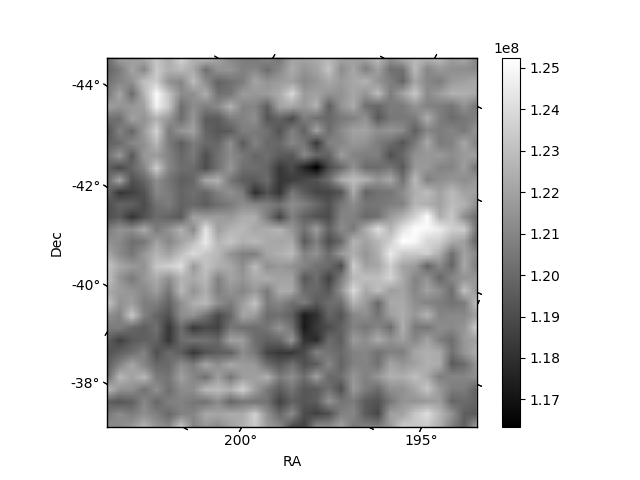
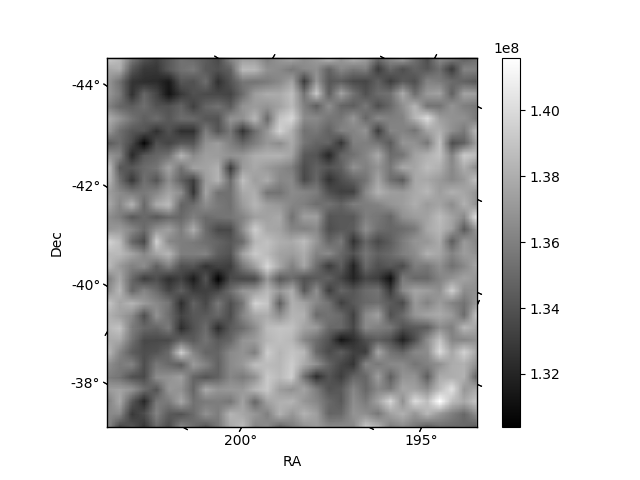
Histogram calculated using DETX and DETY for each event in the final _common_clean file
| Quadrant A | 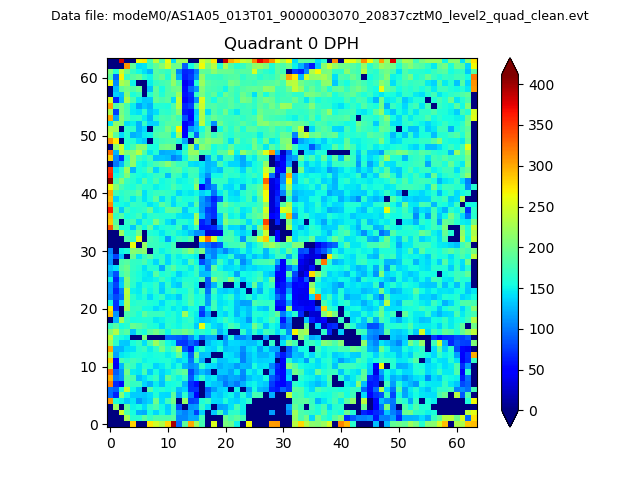 |
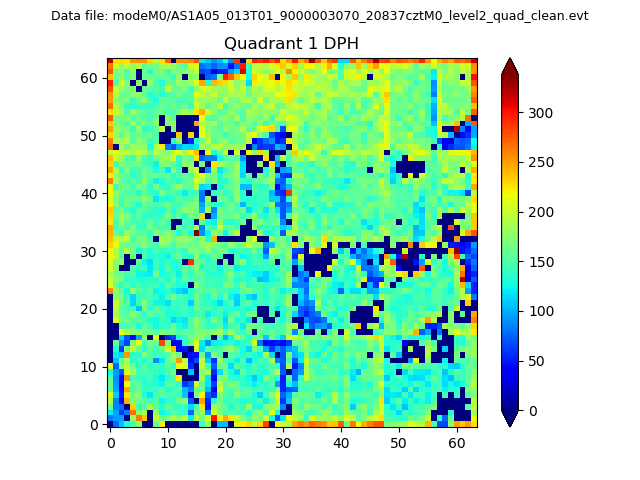 |
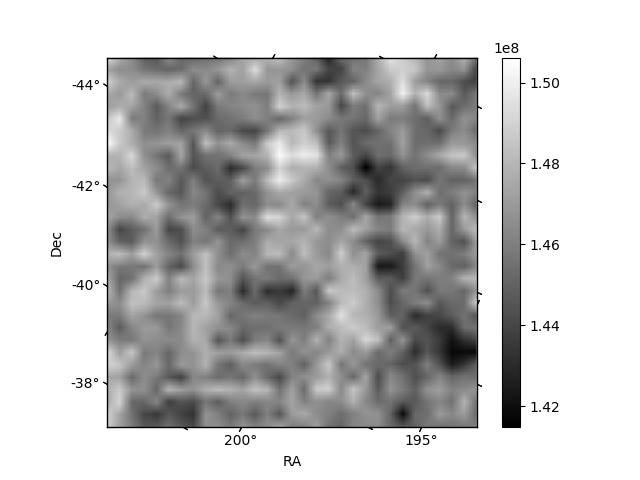
Quadrant B |
|---|---|---|---|
| Quadrant D | 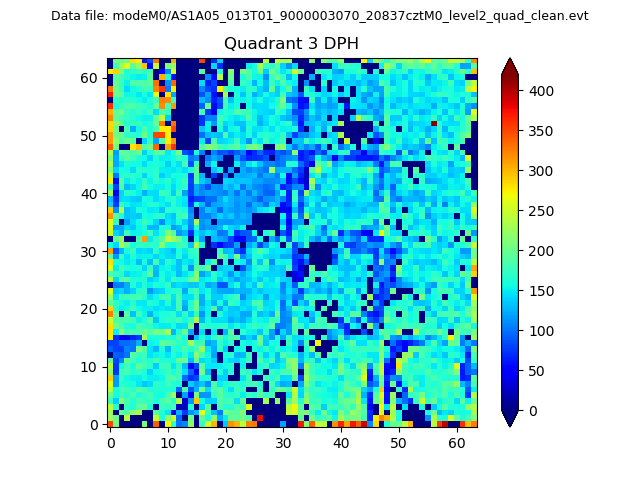 |
 |
Quadrant C |
| Plot type | Count rate plots | Images |
|---|---|---|
| Comparison with Poisson distribution Blue bars denote a histogram of data divided into 1 sec bins. Red curve is a Poisson curve with rate = median count rate of data. |
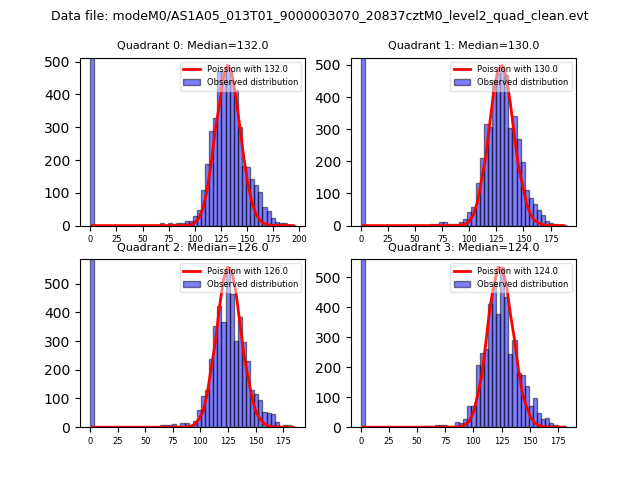 |
 |
| Quadrant-wise count rates Data is divided into 100 sec bins |
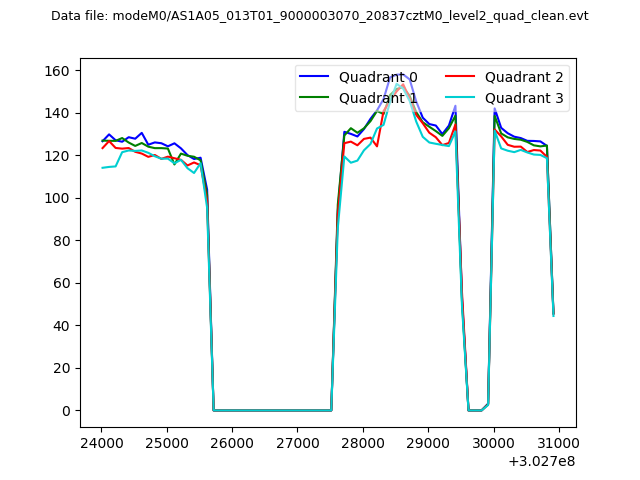 |
|
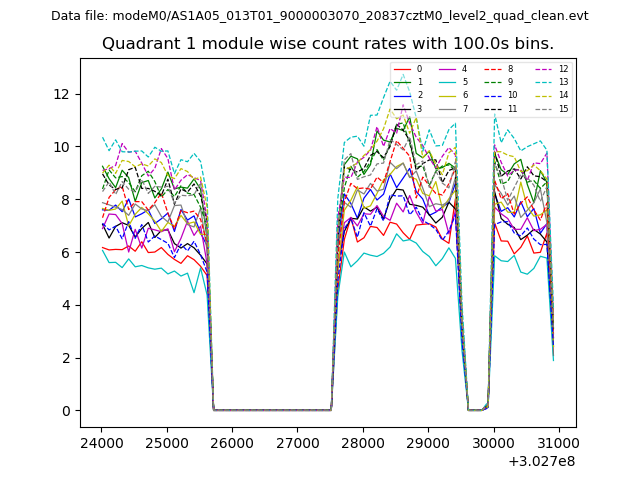
| Module-wise count rates for Quadrant A Data is divided into 100 sec bins |
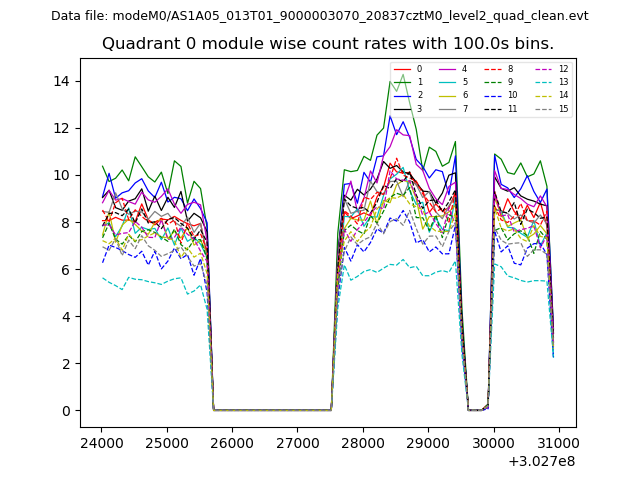 |
 |
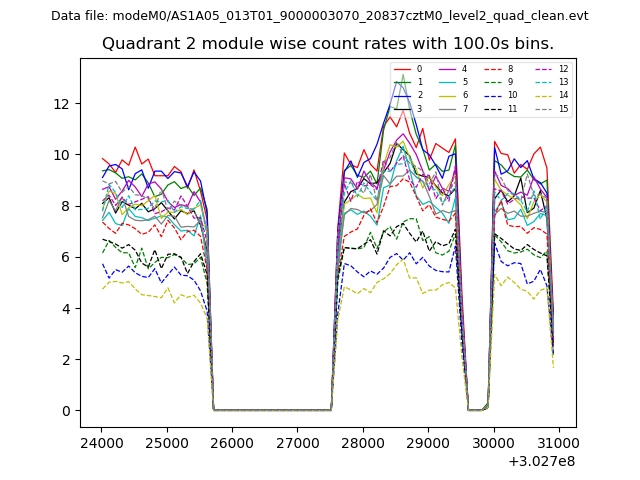
| Module-wise count rates for Quadrant B Data is divided into 100 sec bins |
 |
 |
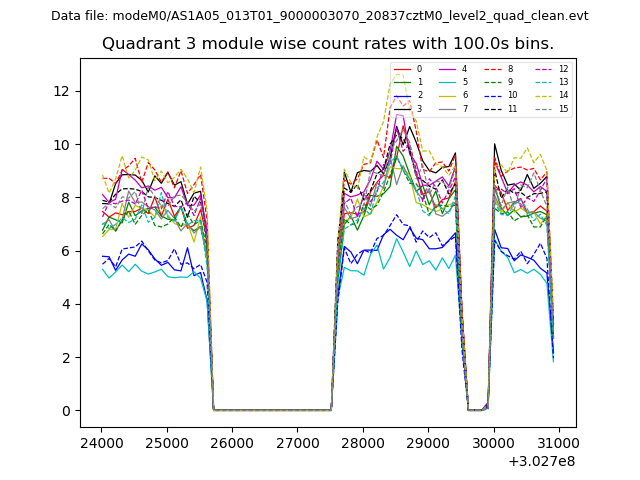
| Module-wise count rates for Quadrant C Data is divided into 100 sec bins |
 |
 |
| Module-wise count rates for Quadrant D Data is divided into 100 sec bins |
 |
 |
| Parameter | Plot |
|---|---|
| CZT HV Monitor | 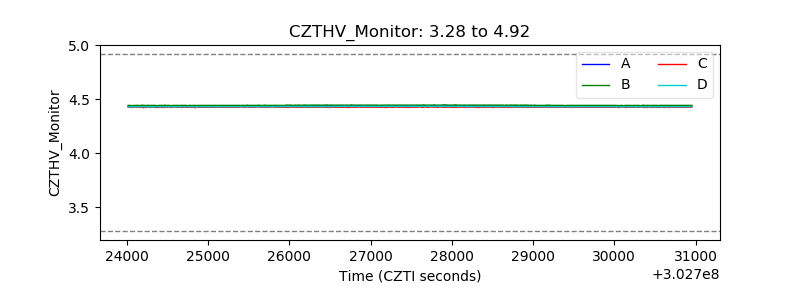 |
| D_VDD | 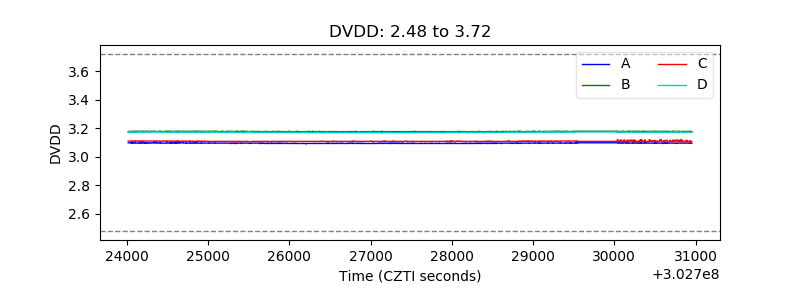 |
| Temperature 1 | 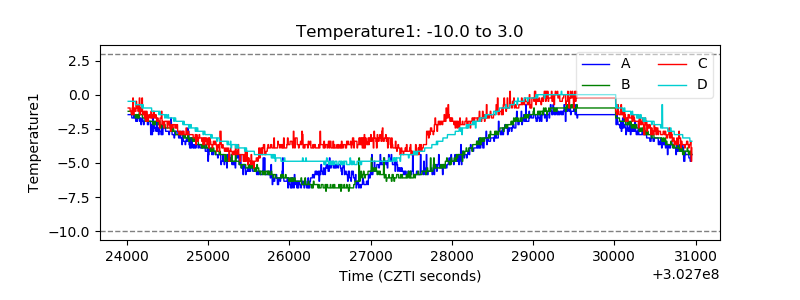 |
| Veto HV Monitor | 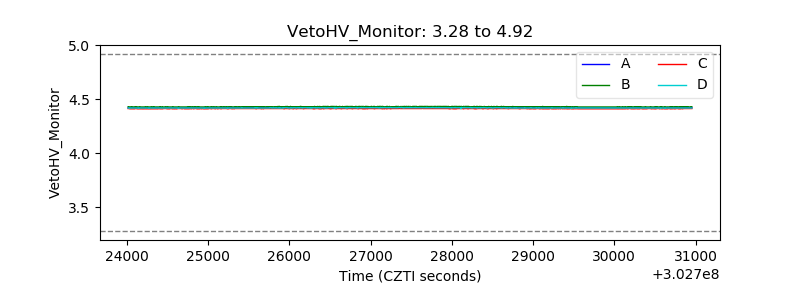 |
| Veto LLD | 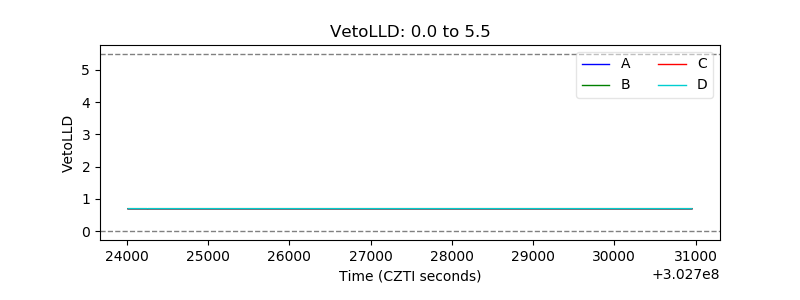 |
| Alpha Counter |  |
| _CPM_Rate | 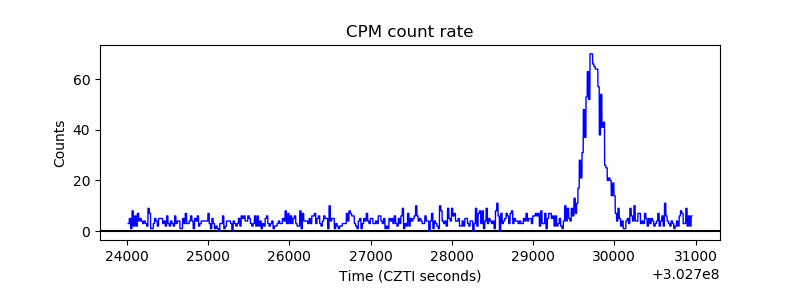 |
| CZT Counter | 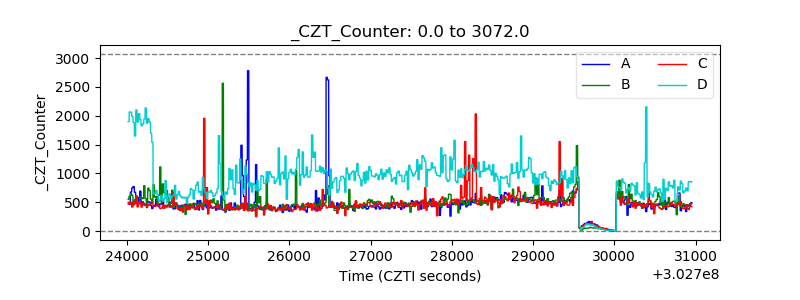 |
| +2.5 Volts monitor |  |
| +5 Volts monitor | 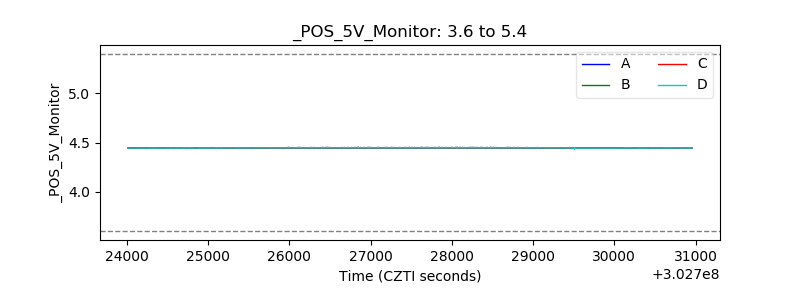 |
| _ROLL_ROT | 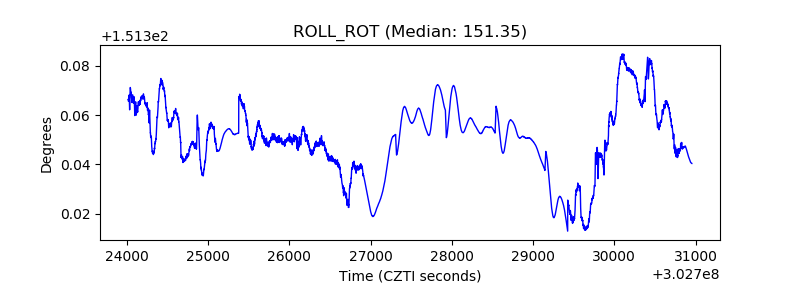 |
| _Roll_DEC | 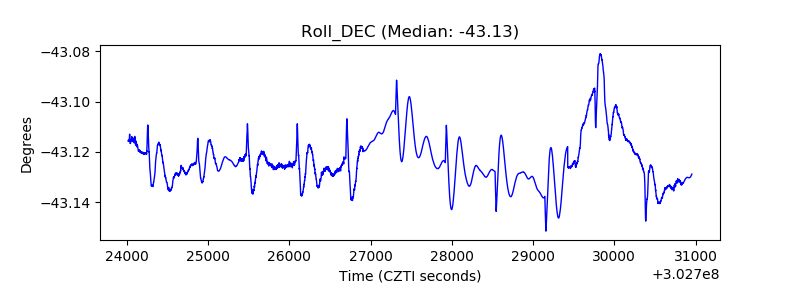 |
| _Roll_RA | 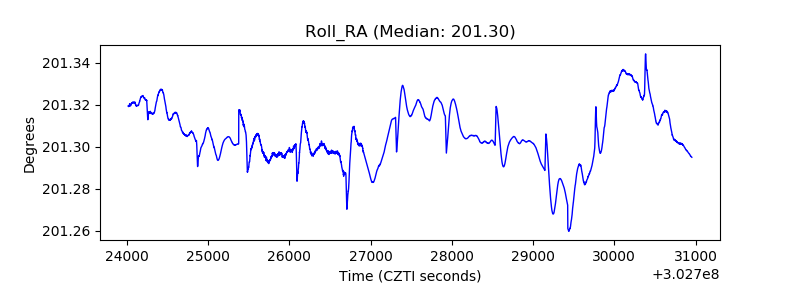 |
| Veto Counter | 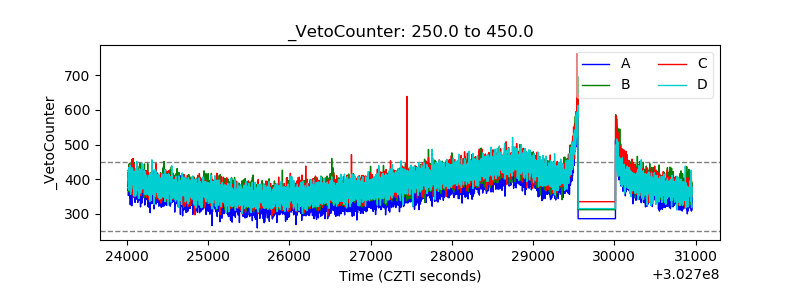 |