| Param | Original file | Final file |
|---|---|---|
| Filename | modeM0/AS1A05_013T01_9000003070_20838cztM0_level2.evt | modeM0/AS1A05_013T01_9000003070_20838cztM0_level2_quad_clean.evt |
| Size (bytes) | 991,105,920 | 168,860,160 |
| Size | 945.2 MB | 161.0 MB |
| Events in quadrant A | 5,822,460 | 1,115,617 |
| Events in quadrant B | 6,243,333 | 1,076,263 |
| Events in quadrant C | 5,729,986 | 1,053,544 |
| Events in quadrant D | 11,414,000 | 1,042,861 |
| Mode SS | |||
|---|---|---|---|
| Quadrant | BADHDUFLAG | Total packets | Discarded packets |
| A | 0 | 242 | 0 |
| B | 0 | 242 | 0 |
| C | 0 | 242 | 0 |
| D | 0 | 242 | 0 |
| Mode M0 | |||
|---|---|---|---|
| Quadrant | BADHDUFLAG | Total packets | Discarded packets |
| A | 0 | 25340 | 2 |
| B | 0 | 26296 | 2 |
| C | 0 | 25098 | 2 |
| D | 0 | 42901 | 2 |
| Mode M9 | |||
|---|---|---|---|
| Quadrant | BADHDUFLAG | Total packets | Discarded packets |
| A | 0 | 8 | 0 |
| B | 0 | 8 | 0 |
| C | 0 | 8 | 0 |
| D | 0 | 8 | 0 |
| Quadrant | Total seconds | Saturated seconds | Saturation percentage |
|---|---|---|---|
| A | 11943 | 104 | 0.870803% |
| B | 11944 | 164 | 1.373074% |
| C | 11944 | 135 | 1.130275% |
| D | 11944 | 388 | 3.248493% |
Noise dominated data is calculated using 1-second bins in cleaned event files. If a bin has >2000 counts, and if more than 50% of those come from <1% of pixels, then it is considered to be noise-dominated and hence unusable.
| Quadrant | # 1 sec bins | Bins with >0 counts | Bins with >2000 counts | High rate bins dominated by noise | Noise dominated (total time) | Noise dominated (detector-on time) | Marked lightcurve |
|---|---|---|---|---|---|---|---|
| A | 12673 | 11944 | 62 | 62 | 0.49% | 0.52% | 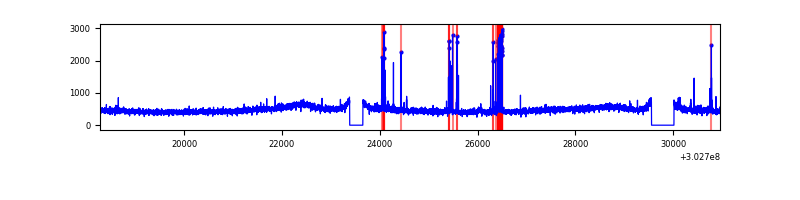 |
| B | 12674 | 11944 | 42 | 42 | 0.33% | 0.35% | 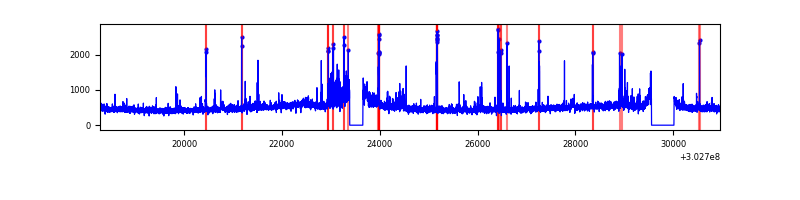 |
| C | 12674 | 11946 | 29 | 29 | 0.23% | 0.24% | 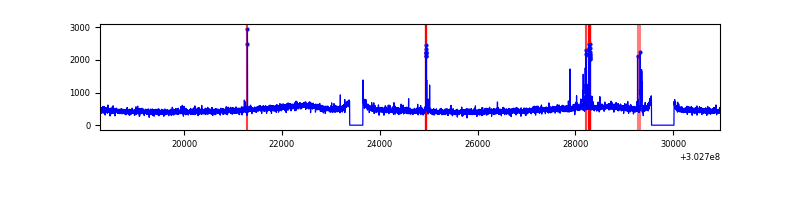 |
| D | 12674 | 11944 | 567 | 567 | 4.47% | 4.75% | 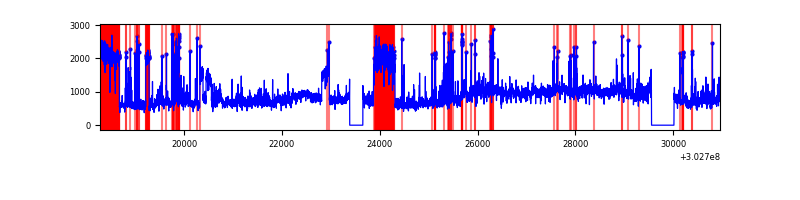 |
Top three noisy pixels from each quadrant. If the there are fewer than three noisy pixels in the level2.evt file, extra rows are filled as -1
| Pixel properties | Quadrant properties | ||||||
|---|---|---|---|---|---|---|---|
| Quadrant | DetID | PixID | Counts | Sigma | Mean | Median | Sigma |
| A | 5 | 16 | 258225 | 881.48 | 1446 | 1419 | 291.3 |
| A | 0 | 226 | 12638 | 38.51 | 1446 | 1419 | 291.3 |
| A | 3 | 137 | 11544 | 34.75 | 1446 | 1419 | 291.3 |
| B | 0 | 189 | 194135 | 716.32 | 1423 | 1388 | 269.1 |
| B | 7 | 220 | 184507 | 680.54 | 1423 | 1388 | 269.1 |
| B | 3 | 64 | 128850 | 473.7 | 1423 | 1388 | 269.1 |
| C | 14 | 238 | 211631 | 654.9 | 1370 | 1380 | 321.0 |
| C | 9 | 54 | 159407 | 492.23 | 1370 | 1380 | 321.0 |
| C | 13 | 61 | 9508 | 25.32 | 1370 | 1380 | 321.0 |
| D | 1 | 20 | 5132000 | 15228.49 | 1390 | 1351 | 336.9 |
| D | 1 | 52 | 504929 | 1494.69 | 1390 | 1351 | 336.9 |
| D | 9 | 1 | 191833 | 565.38 | 1390 | 1351 | 336.9 |
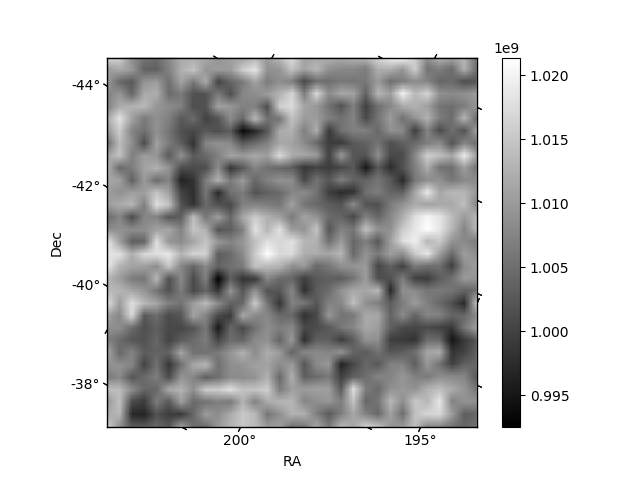
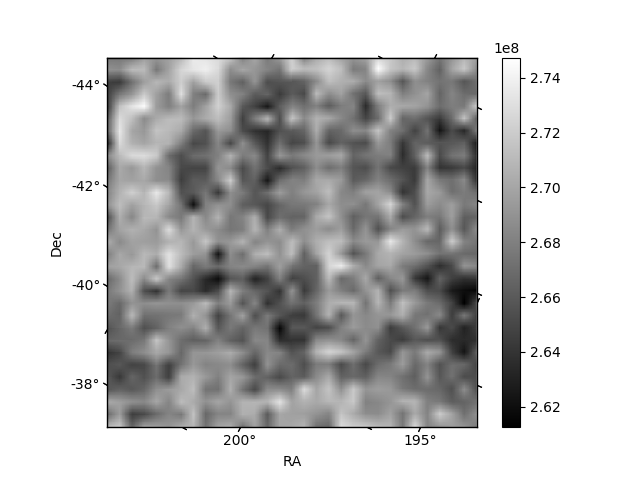
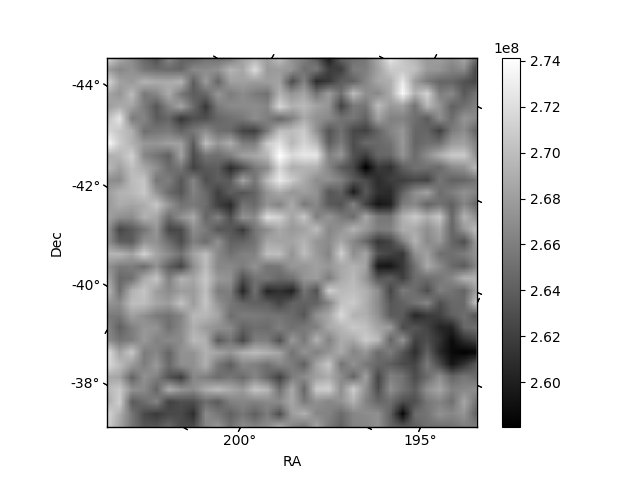
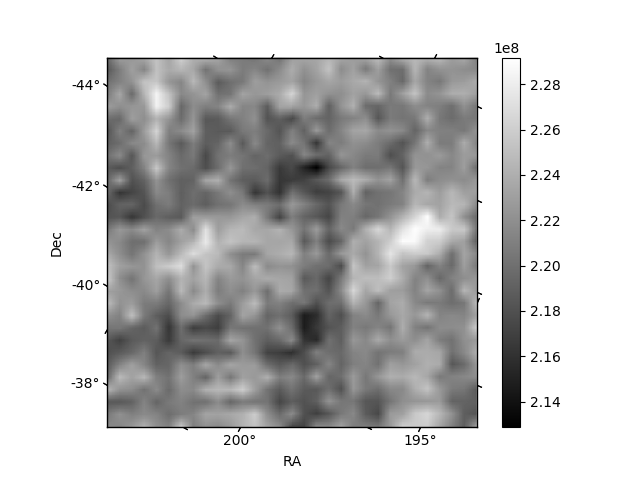
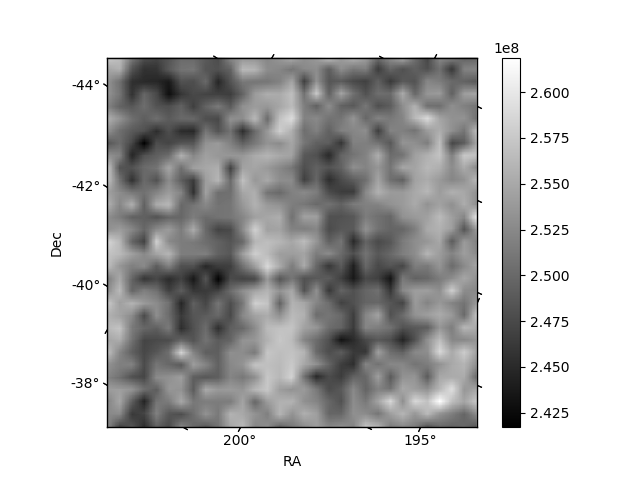
Histogram calculated using DETX and DETY for each event in the final _common_clean file
| Quadrant A | 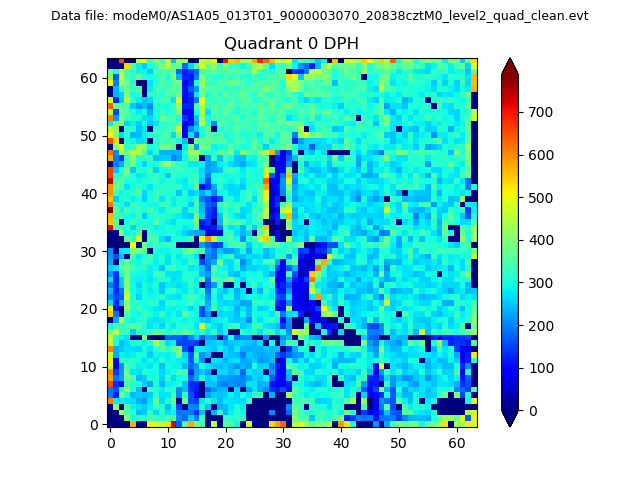 |
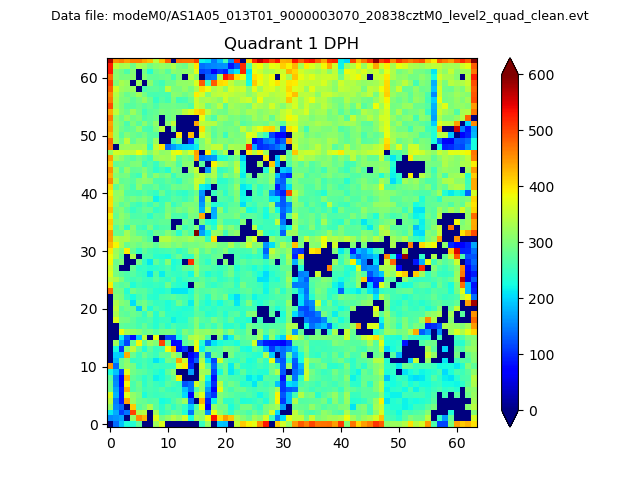 |
Quadrant B |
|---|---|---|---|
| Quadrant D | 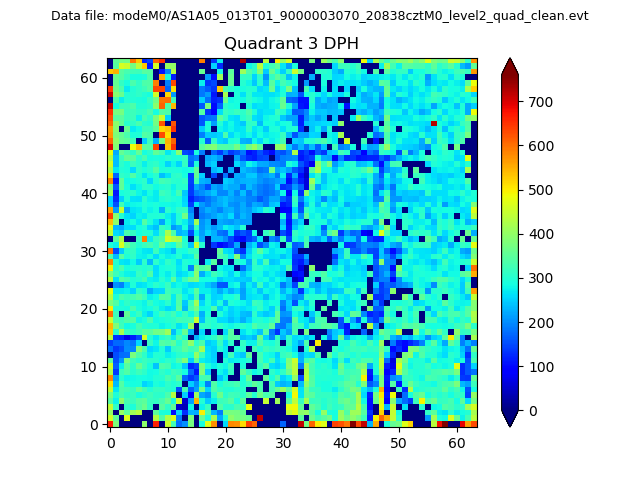 |
 |
Quadrant C |
| Plot type | Count rate plots | Images |
|---|---|---|
| Comparison with Poisson distribution Blue bars denote a histogram of data divided into 1 sec bins. Red curve is a Poisson curve with rate = median count rate of data. |
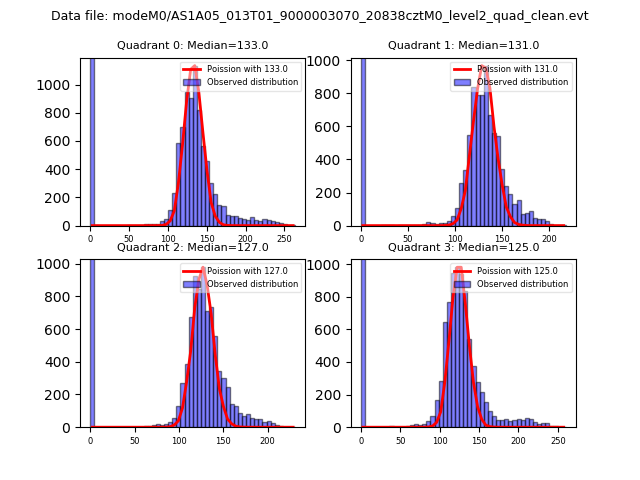 |
 |
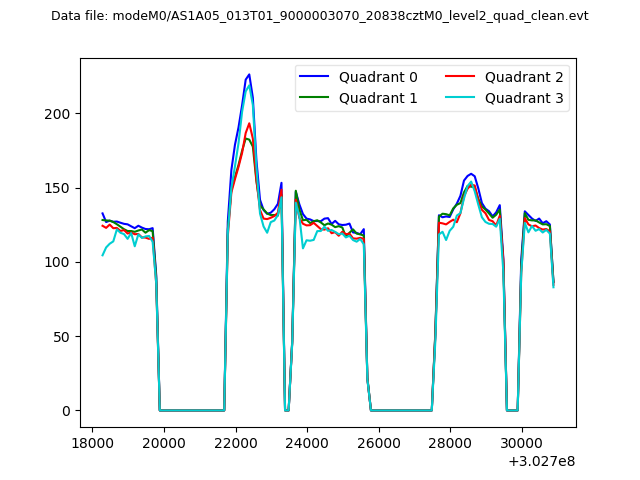
| Quadrant-wise count rates Data is divided into 100 sec bins |
 |
|
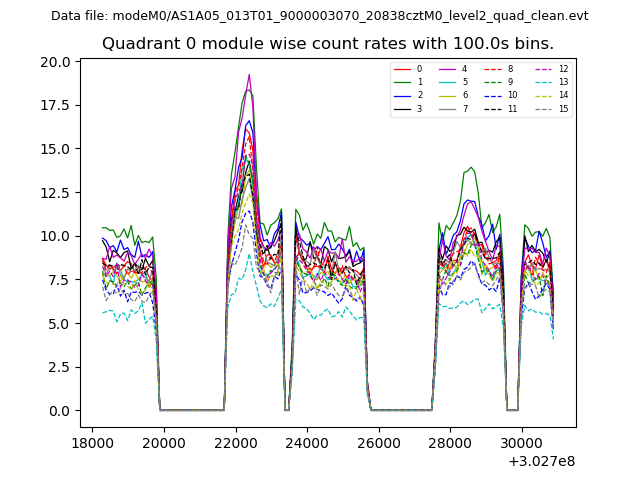
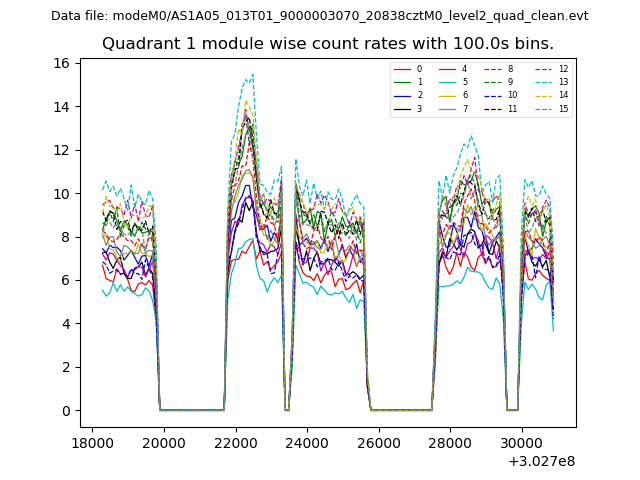
| Module-wise count rates for Quadrant A Data is divided into 100 sec bins |
 |
 |
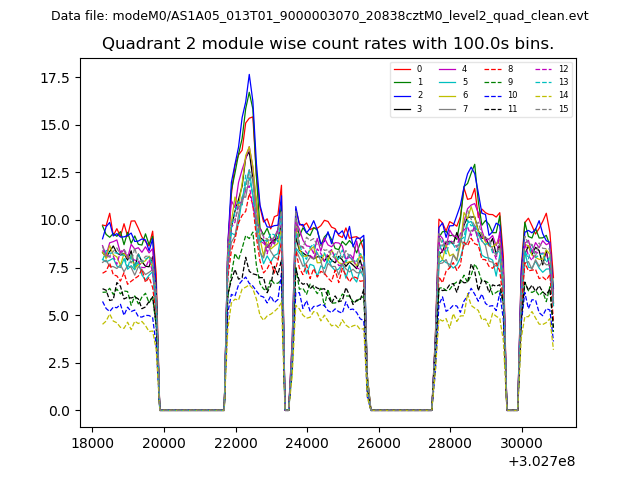
| Module-wise count rates for Quadrant B Data is divided into 100 sec bins |
 |
 |
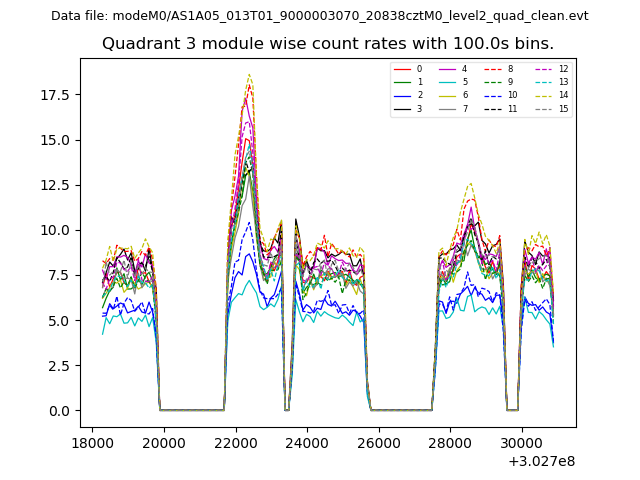
| Module-wise count rates for Quadrant C Data is divided into 100 sec bins |
 |
 |
| Module-wise count rates for Quadrant D Data is divided into 100 sec bins |
 |
 |
| Parameter | Plot |
|---|---|
| CZT HV Monitor | 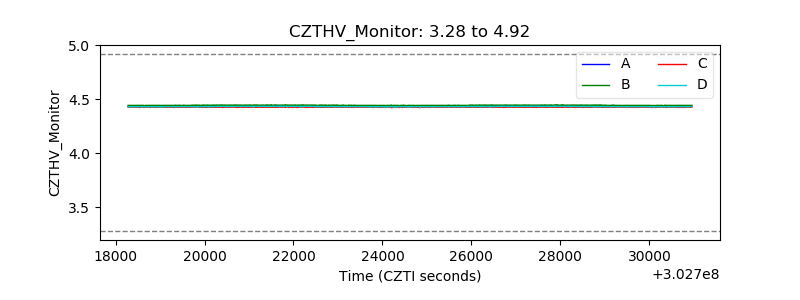 |
| D_VDD | 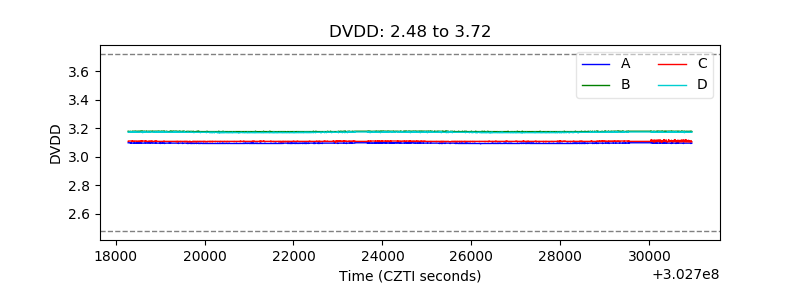 |
| Temperature 1 | 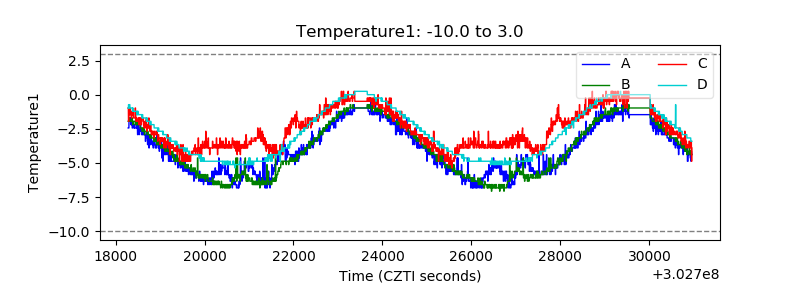 |
| Veto HV Monitor | 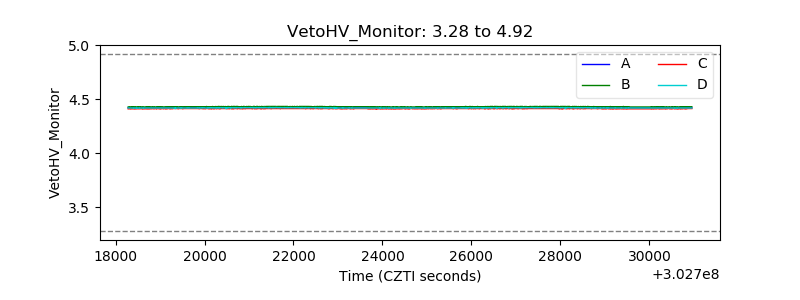 |
| Veto LLD | 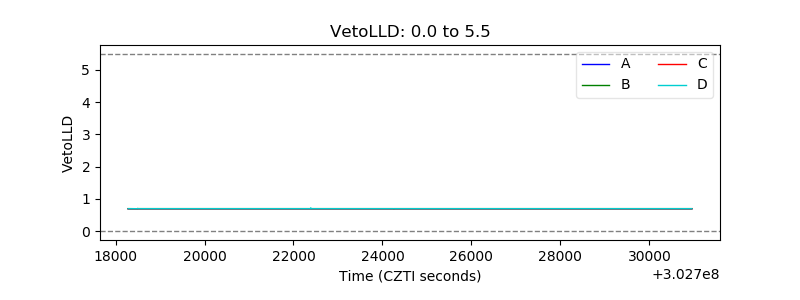 |
| Alpha Counter | 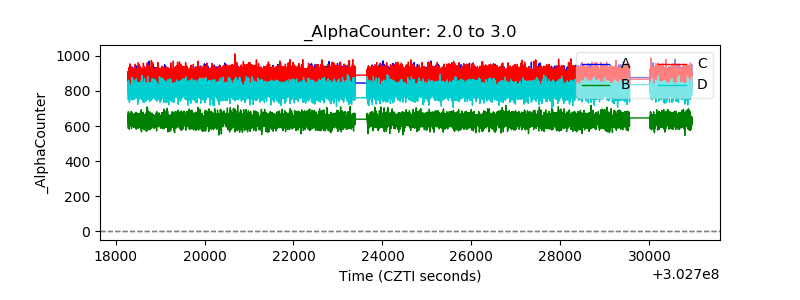 |
| _CPM_Rate | 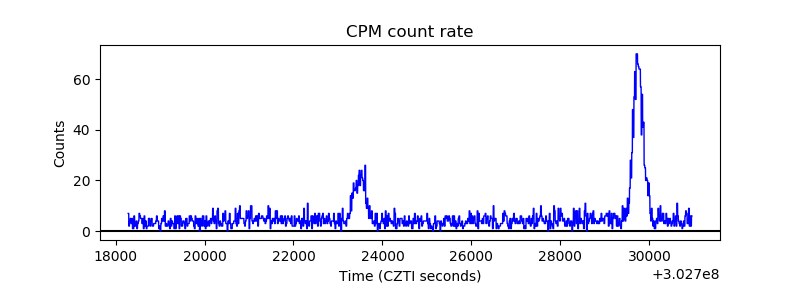 |
| CZT Counter |  |
| +2.5 Volts monitor |  |
| +5 Volts monitor | 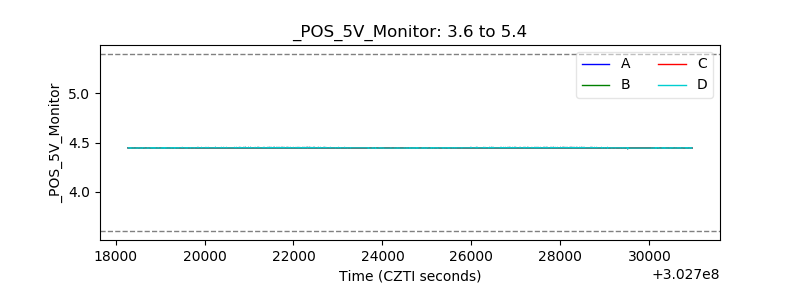 |
| _ROLL_ROT | 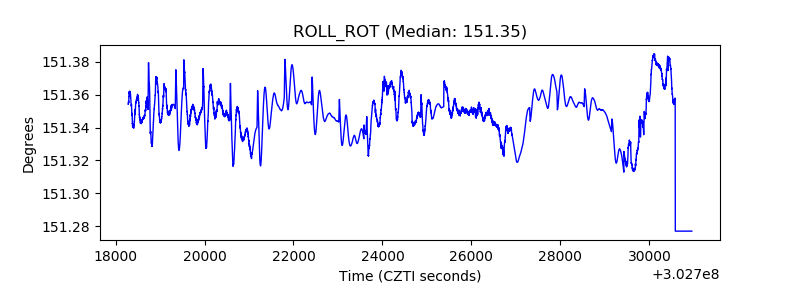 |
| _Roll_DEC | 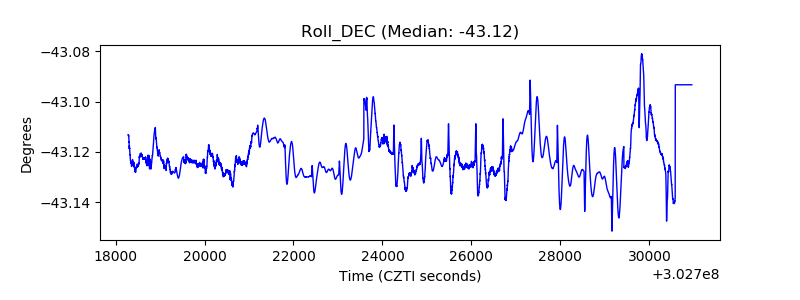 |
| _Roll_RA | 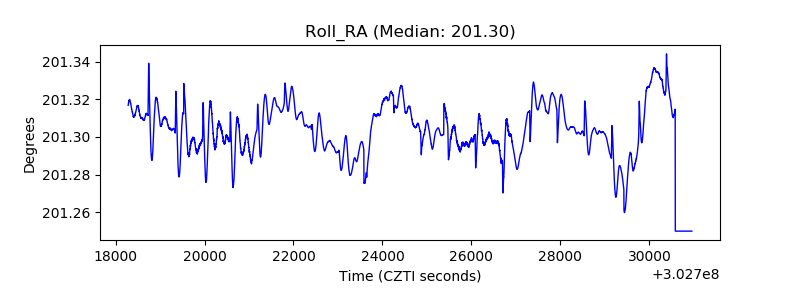 |
| Veto Counter | 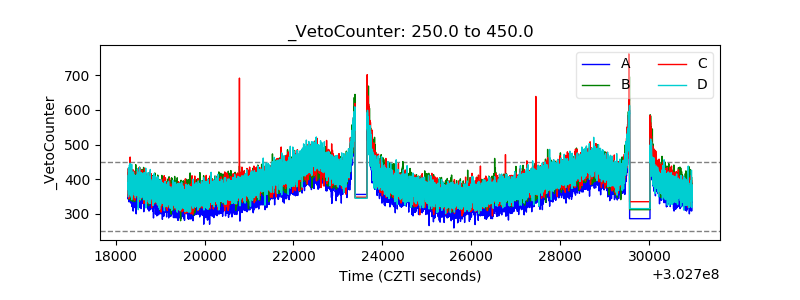 |