| Param | Original file | Final file |
|---|---|---|
| Filename | modeM0/AS1A05_013T01_9000003070_20971cztM0_level2.evt | modeM0/AS1A05_013T01_9000003070_20971cztM0_level2_quad_clean.evt |
| Size (bytes) | 1,606,976,640 | 282,916,800 |
| Size | 1.5 GB | 269.8 MB |
| Events in quadrant A | 9,600,358 | 1,855,441 |
| Events in quadrant B | 11,037,551 | 1,800,487 |
| Events in quadrant C | 9,605,151 | 1,771,728 |
| Events in quadrant D | 17,018,125 | 1,706,892 |
| Mode SS | |||
|---|---|---|---|
| Quadrant | BADHDUFLAG | Total packets | Discarded packets |
| A | 0 | 424 | 0 |
| B | 0 | 424 | 0 |
| C | 0 | 424 | 0 |
| D | 0 | 424 | 0 |
| Mode M0 | |||
|---|---|---|---|
| Quadrant | BADHDUFLAG | Total packets | Discarded packets |
| A | 0 | 42623 | 3 |
| B | 0 | 46581 | 3 |
| C | 0 | 42703 | 3 |
| D | 0 | 64343 | 3 |
| Mode M9 | |||
|---|---|---|---|
| Quadrant | BADHDUFLAG | Total packets | Discarded packets |
| A | 0 | 16 | 0 |
| B | 0 | 16 | 0 |
| C | 0 | 16 | 0 |
| D | 0 | 16 | 0 |
| Quadrant | Total seconds | Saturated seconds | Saturation percentage |
|---|---|---|---|
| A | 20822 | 137 | 0.657958% |
| B | 20823 | 502 | 2.410796% |
| C | 20822 | 205 | 0.984536% |
| D | 20822 | 1925 | 9.245029% |
Noise dominated data is calculated using 1-second bins in cleaned event files. If a bin has >2000 counts, and if more than 50% of those come from <1% of pixels, then it is considered to be noise-dominated and hence unusable.
| Quadrant | # 1 sec bins | Bins with >0 counts | Bins with >2000 counts | High rate bins dominated by noise | Noise dominated (total time) | Noise dominated (detector-on time) | Marked lightcurve |
|---|---|---|---|---|---|---|---|
| A | 25454 | 20824 | 0 | 0 | 0.00% | 0.00% | 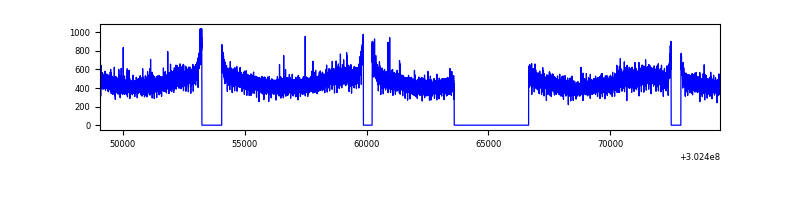 |
| B | 25455 | 20824 | 285 | 285 | 1.12% | 1.37% | 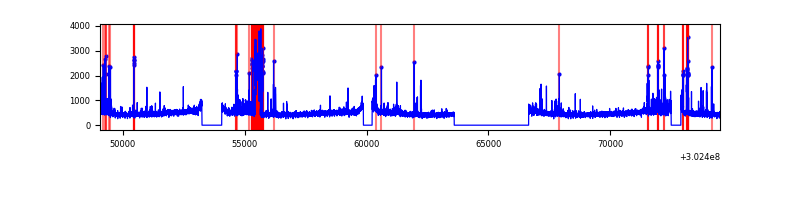 |
| C | 25454 | 20826 | 0 | 0 | 0.00% | 0.00% | 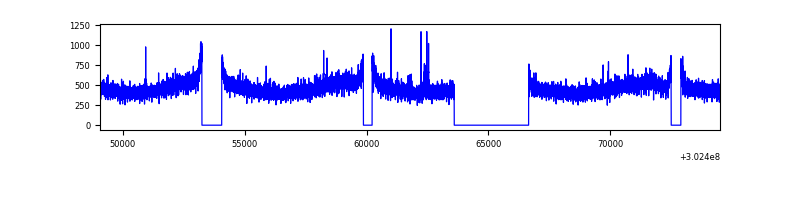 |
| D | 25454 | 20825 | 1644 | 1644 | 6.46% | 7.89% | 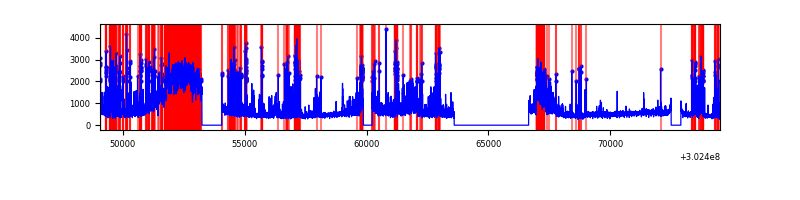 |
Top three noisy pixels from each quadrant. If the there are fewer than three noisy pixels in the level2.evt file, extra rows are filled as -1
| Pixel properties | Quadrant properties | ||||||
|---|---|---|---|---|---|---|---|
| Quadrant | DetID | PixID | Counts | Sigma | Mean | Median | Sigma |
| A | 0 | 226 | 21724 | 38.56 | 2496 | 2447 | 499.9 |
| A | 3 | 137 | 20050 | 35.21 | 2496 | 2447 | 499.9 |
| A | 12 | 194 | 18050 | 31.21 | 2496 | 2447 | 499.9 |
| B | 3 | 64 | 396206 | 864.01 | 2444 | 2386 | 455.8 |
| B | 0 | 182 | 391954 | 854.68 | 2444 | 2386 | 455.8 |
| B | 7 | 220 | 289089 | 629.0 | 2444 | 2386 | 455.8 |
| C | 14 | 238 | 368729 | 670.31 | 2354 | 2368 | 546.6 |
| C | 7 | 247 | 51308 | 89.54 | 2354 | 2368 | 546.6 |
| C | 13 | 61 | 16876 | 26.54 | 2354 | 2368 | 546.6 |
| D | 1 | 20 | 3909694 | 6972.06 | 2319 | 2252 | 560.4 |
| D | 1 | 52 | 2464469 | 4393.34 | 2319 | 2252 | 560.4 |
| D | 12 | 227 | 1234351 | 2198.44 | 2319 | 2252 | 560.4 |
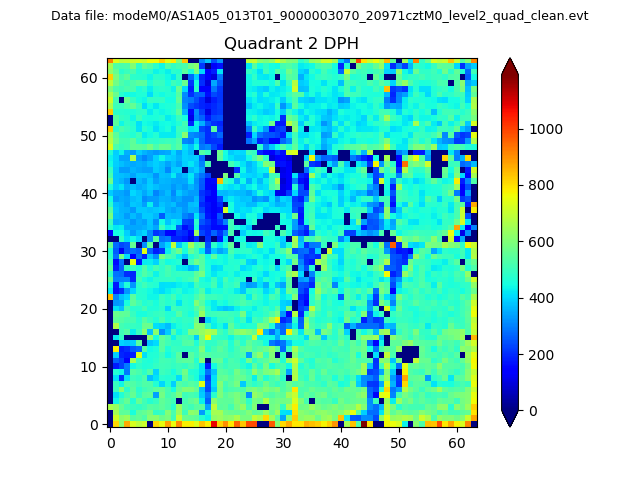
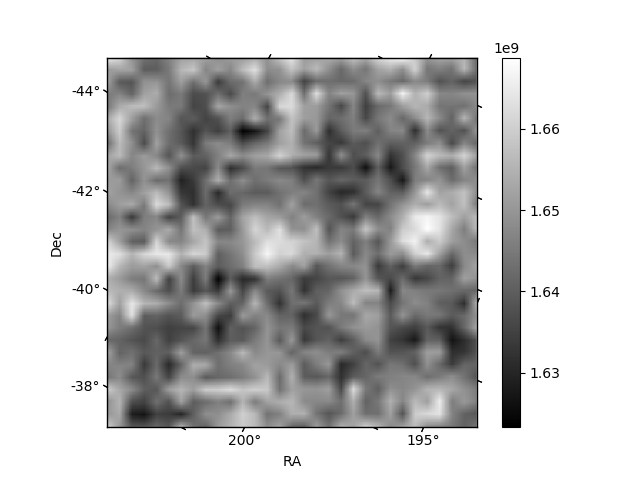
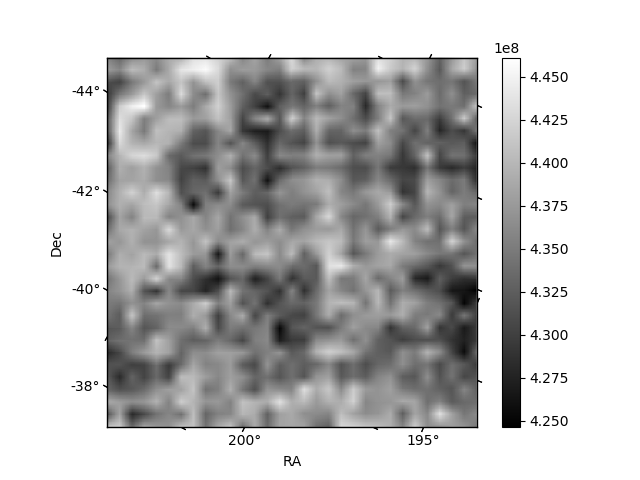
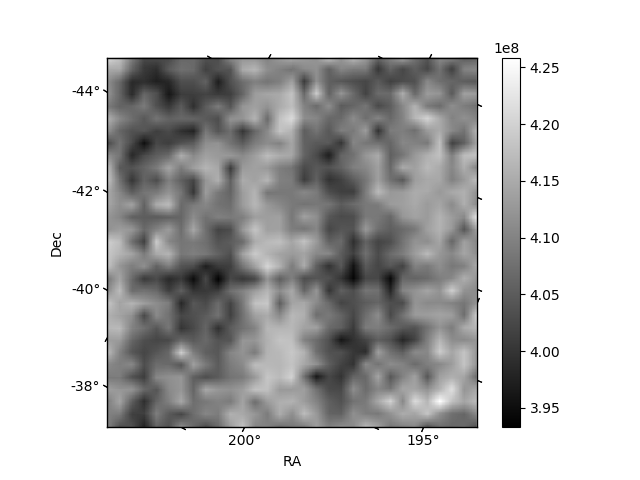
Histogram calculated using DETX and DETY for each event in the final _common_clean file
| Quadrant A | 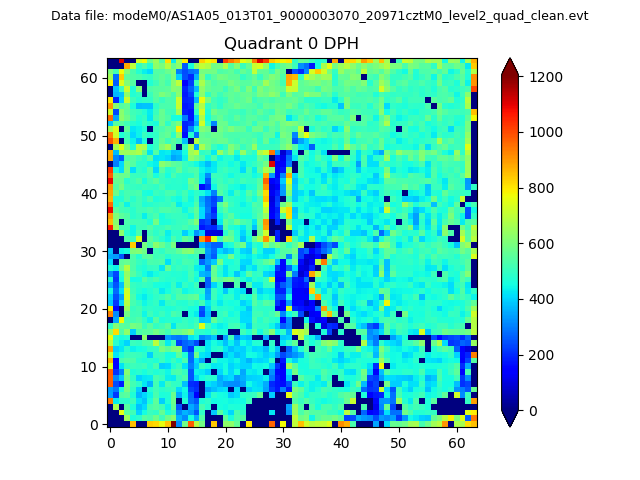 |
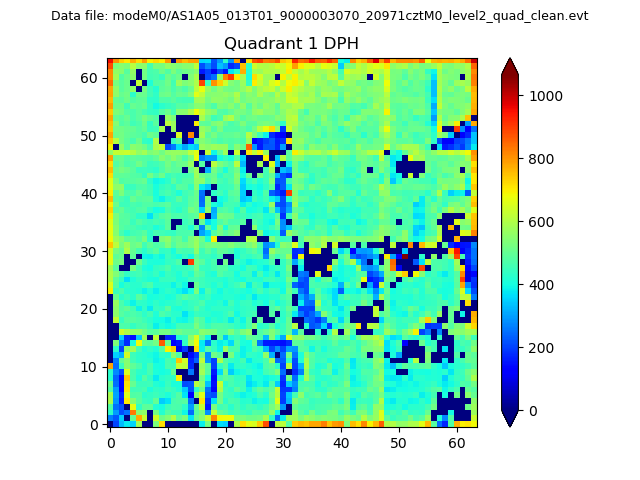 |
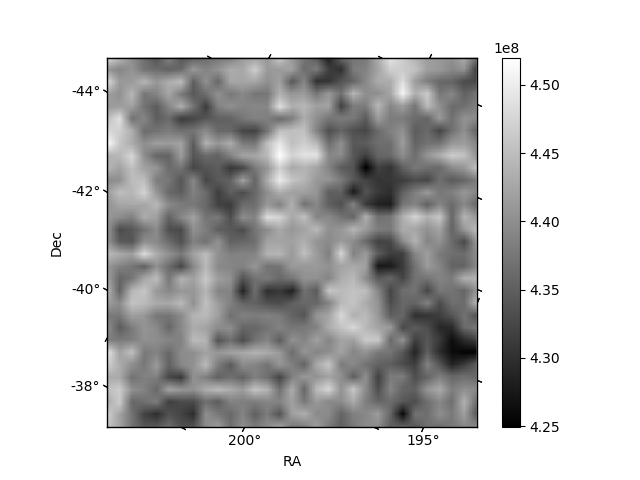
Quadrant B |
|---|---|---|---|
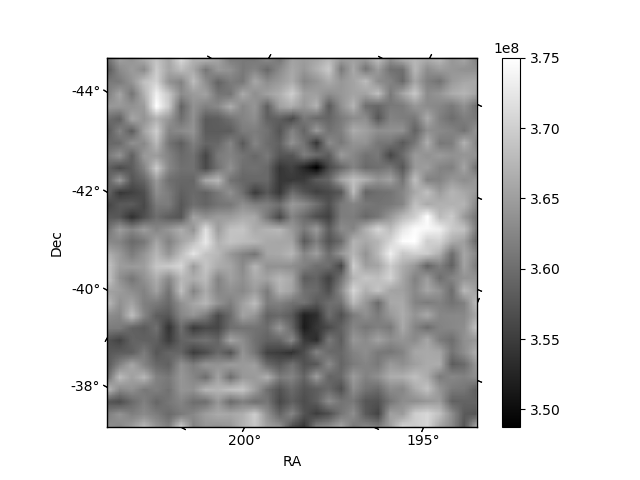
| Quadrant D | 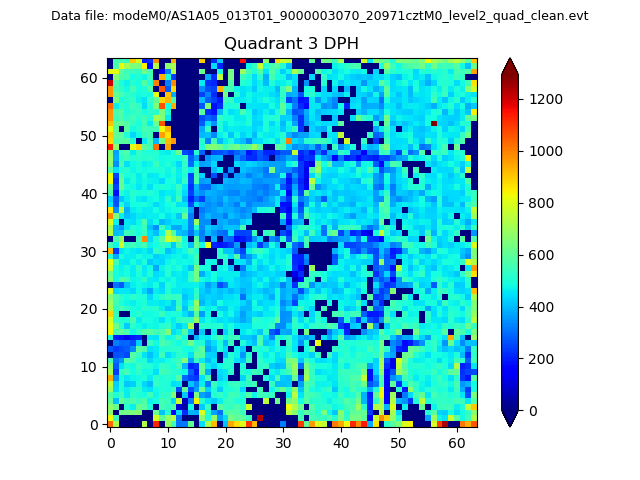 |
 |
Quadrant C |
| Plot type | Count rate plots | Images |
|---|---|---|
| Comparison with Poisson distribution Blue bars denote a histogram of data divided into 1 sec bins. Red curve is a Poisson curve with rate = median count rate of data. |
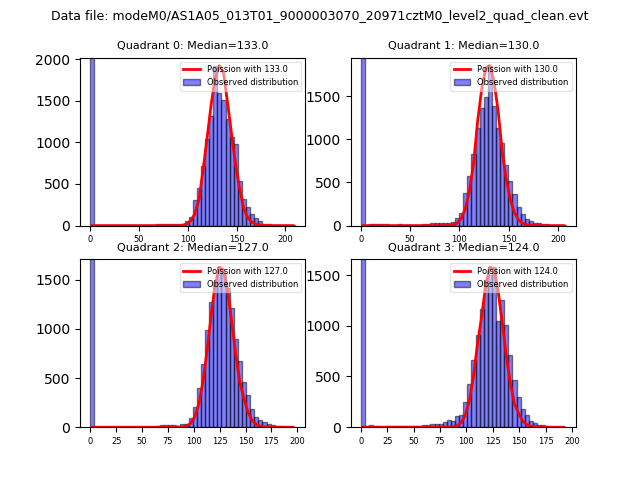 |
 |
| Quadrant-wise count rates Data is divided into 100 sec bins |
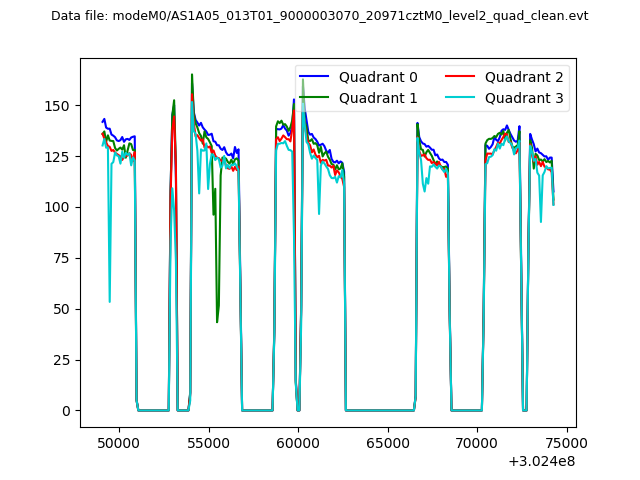 |
|
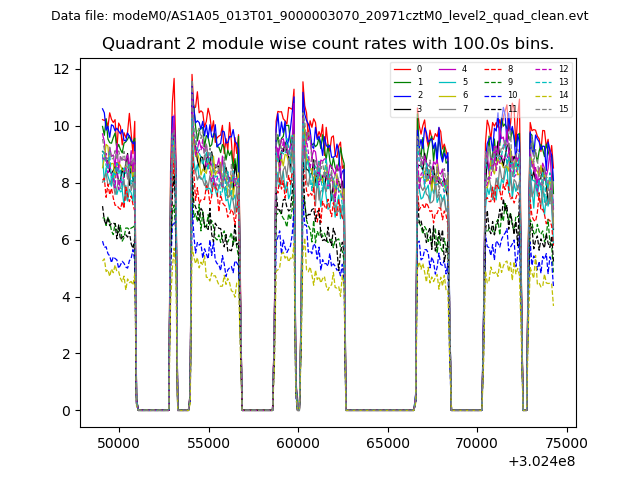
| Module-wise count rates for Quadrant A Data is divided into 100 sec bins |
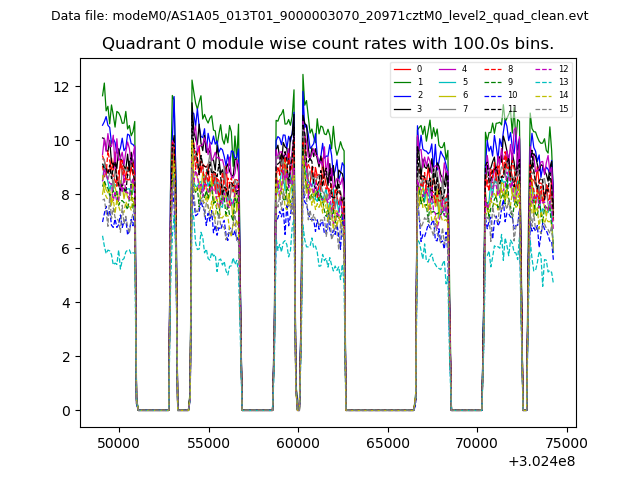 |
 |
| Module-wise count rates for Quadrant B Data is divided into 100 sec bins |
 |
 |
| Module-wise count rates for Quadrant C Data is divided into 100 sec bins |
 |
 |
| Module-wise count rates for Quadrant D Data is divided into 100 sec bins |
 |
 |
| Parameter | Plot |
|---|---|
| CZT HV Monitor | 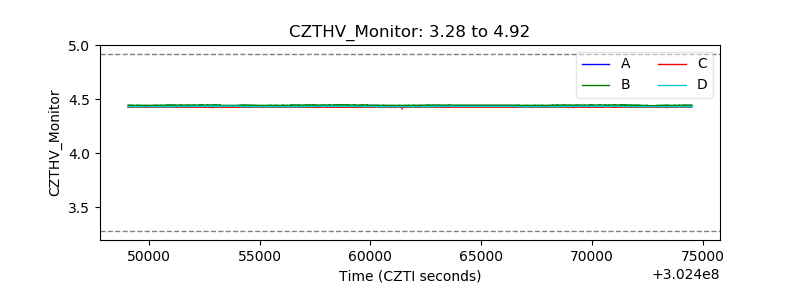 |
| D_VDD | 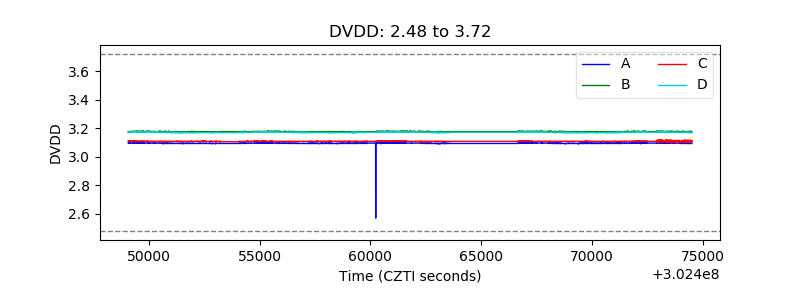 |
| Temperature 1 | 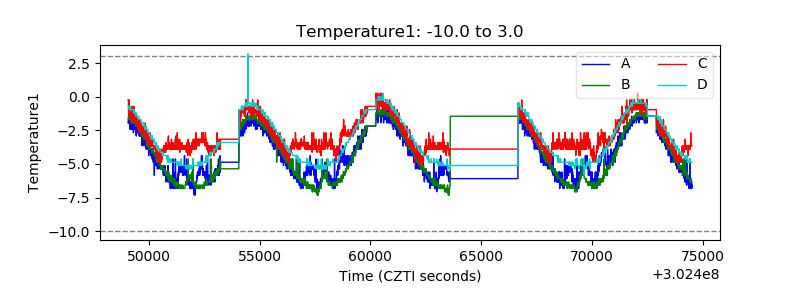 |
| Veto HV Monitor | 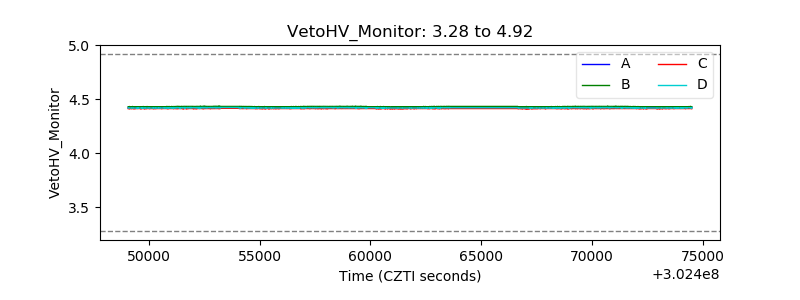 |
| Veto LLD | 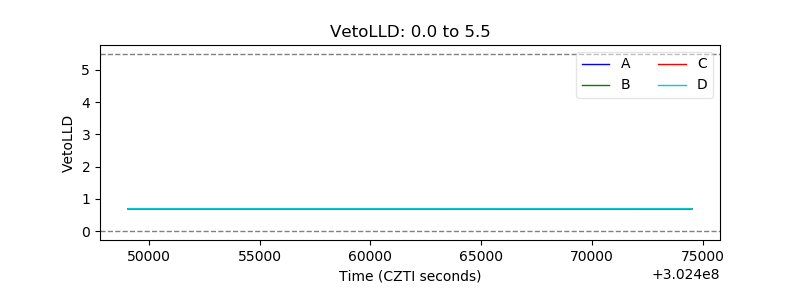 |
| Alpha Counter | 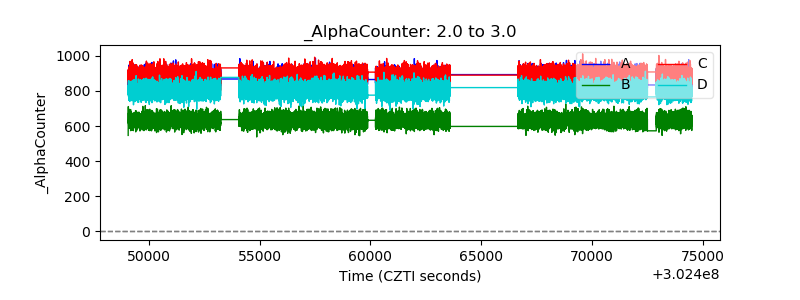 |
| _CPM_Rate | 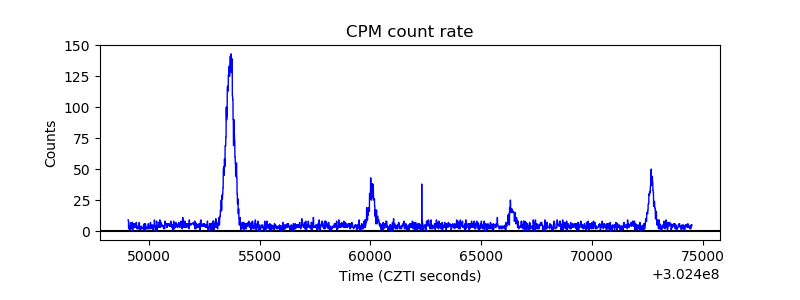 |
| CZT Counter | 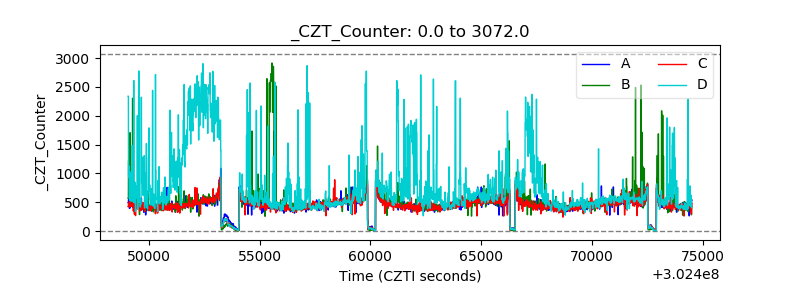 |
| +2.5 Volts monitor |  |
| +5 Volts monitor |  |
| _ROLL_ROT | 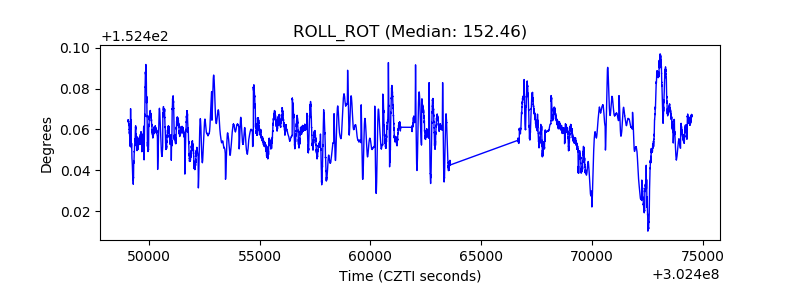 |
| _Roll_DEC |  |
| _Roll_RA | 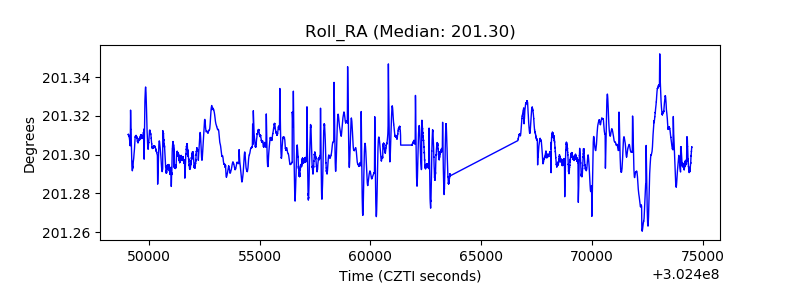 |
| Veto Counter | 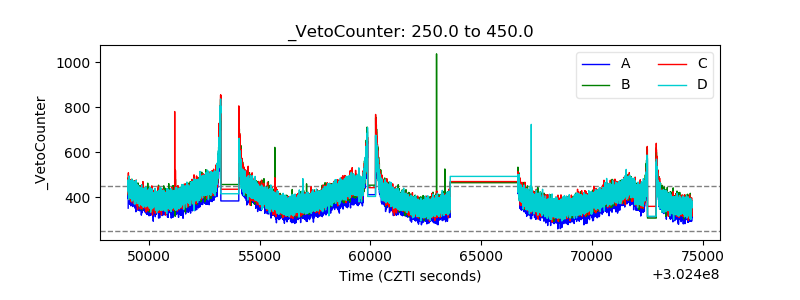 |