| Param | Original file | Final file |
|---|---|---|
| Filename | modeM0/AS1A06_009T03_9000003072cztM0_level2.fits | modeM0/AS1A06_009T03_9000003072cztM0_level2_quad_clean.evt |
| Size (bytes) | 138,093,120 | 87,808,320 |
| Size | 131.7 MB | 83.7 MB |
| Events in quadrant A | 841,300 | 430,848 |
| Events in quadrant B | 803,786 | 429,096 |
| Events in quadrant C | 821,584 | 417,355 |
| Events in quadrant D | 702,442 | 367,398 |
| Mode M9 | |||
|---|---|---|---|
| Quadrant | BADHDUFLAG | Total packets | Discarded packets |
| A | 0 | 14 | 0 |
| B | 0 | 14 | 0 |
| C | 0 | 14 | 0 |
| D | 0 | 14 | 0 |
| Mode SS | |||
|---|---|---|---|
| Quadrant | BADHDUFLAG | Total packets | Discarded packets |
| A | 0 | 298 | 0 |
| B | 0 | 298 | 0 |
| C | 0 | 298 | 0 |
| D | 0 | 298 | 0 |
| Mode M0 | |||
|---|---|---|---|
| Quadrant | BADHDUFLAG | Total packets | Discarded packets |
| A | 0 | 30118 | 0 |
| B | 0 | 31515 | 0 |
| C | 0 | 30338 | 0 |
| D | 0 | 46273 | 0 |
| Quadrant | Total seconds | Saturated seconds | Saturation percentage |
|---|---|---|---|
| A | 14676 | 55 | 0.374762% |
| B | 14676 | 142 | 0.967566% |
| C | 14676 | 113 | 0.769965% |
| D | 14676 | 581 | 3.958844% |
Noise dominated data is calculated using 1-second bins in cleaned event files. If a bin has >2000 counts, and if more than 50% of those come from <1% of pixels, then it is considered to be noise-dominated and hence unusable.
| Quadrant | # 1 sec bins | Bins with >0 counts | Bins with >2000 counts | High rate bins dominated by noise | Noise dominated (total time) | Noise dominated (detector-on time) | Marked lightcurve |
|---|---|---|---|---|---|---|---|
| A | 16101 | 14674 | 0 | 0 | 0.00% | 0.00% |  |
| B | 16101 | 14674 | 0 | 0 | 0.00% | 0.00% |  |
| C | 16100 | 14673 | 0 | 0 | 0.00% | 0.00% | 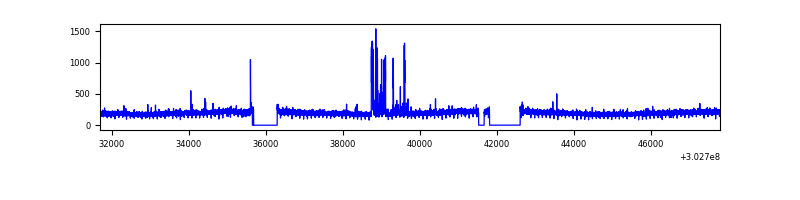 |
| D | 16101 | 14668 | 0 | 0 | 0.00% | 0.00% | 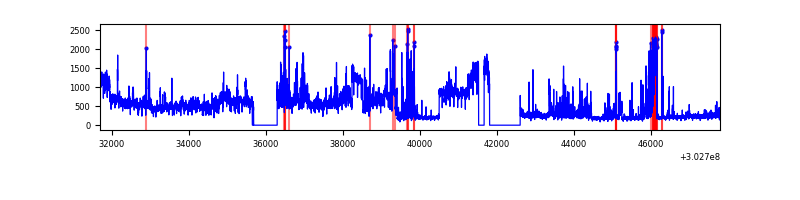 |
Top three noisy pixels from each quadrant. If the there are fewer than three noisy pixels in the level2.evt file, extra rows are filled as -1
| Pixel properties | Quadrant properties | ||||||
|---|---|---|---|---|---|---|---|
| Quadrant | DetID | PixID | Counts | Sigma | Mean | Median | Sigma |
| A | 0 | 29 | 861 | 11.51 | 219 | 204 | 57.1 |
| A | 7 | 110 | 651 | 7.83 | 219 | 204 | 57.1 |
| A | 0 | 30 | 639 | 7.62 | 219 | 204 | 57.1 |
| B | 2 | 9 | 701 | 11.18 | 212 | 202 | 44.6 |
| B | 2 | 8 | 570 | 8.24 | 212 | 202 | 44.6 |
| B | 3 | 17 | 554 | 7.89 | 212 | 202 | 44.6 |
| C | 1 | 80 | 653 | 7.88 | 216 | 202 | 57.2 |
| C | 1 | 81 | 652 | 7.87 | 216 | 202 | 57.2 |
| C | 12 | 241 | 599 | 6.94 | 216 | 202 | 57.2 |
| D | 3 | 14 | 544 | 6.54 | 200 | 181 | 55.5 |
| D | 10 | 189 | 513 | 5.98 | 200 | 181 | 55.5 |
| D | 6 | 38 | 510 | 5.93 | 200 | 181 | 55.5 |
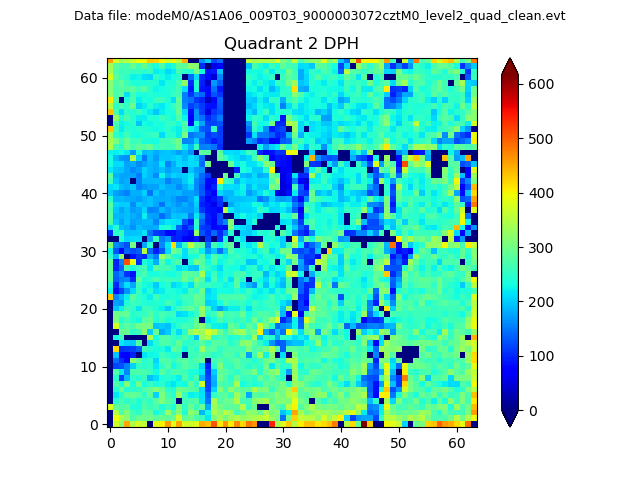
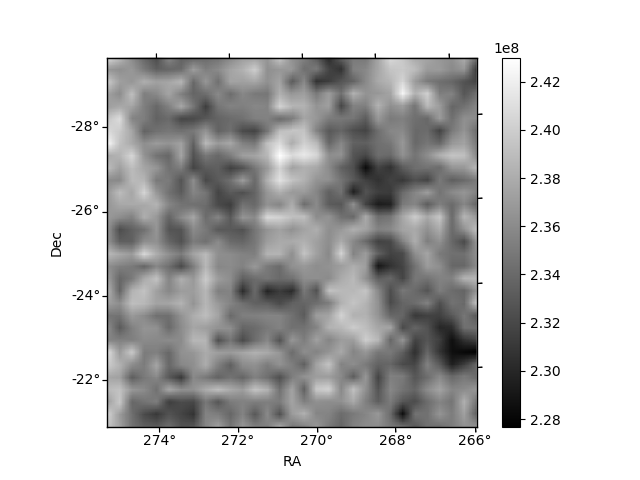
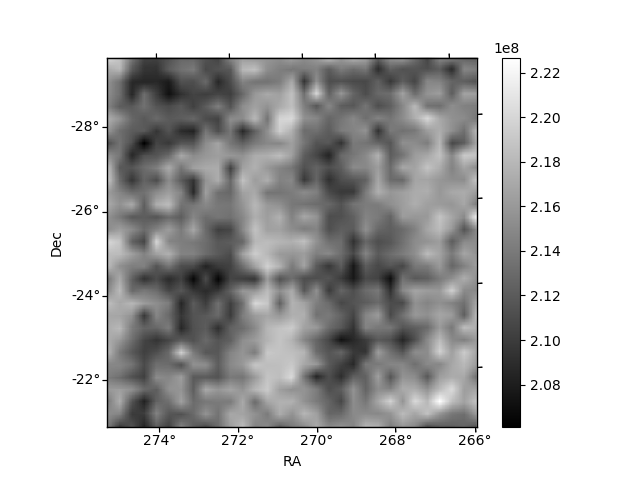
Histogram calculated using DETX and DETY for each event in the final _common_clean file
| Quadrant A | 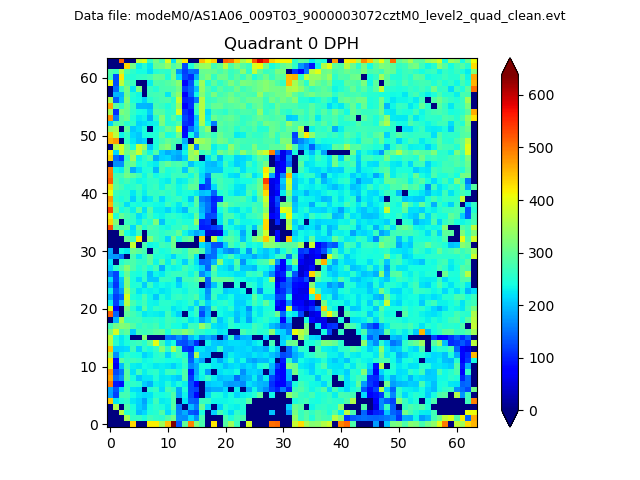 |
 |
Quadrant B |
|---|---|---|---|
| Quadrant D |  |
 |
Quadrant C |
| Plot type | Count rate plots | Images |
|---|---|---|
| Comparison with Poisson distribution Blue bars denote a histogram of data divided into 1 sec bins. Red curve is a Poisson curve with rate = median count rate of data. |
 |
 |
| Quadrant-wise count rates Data is divided into 100 sec bins |
 |
|
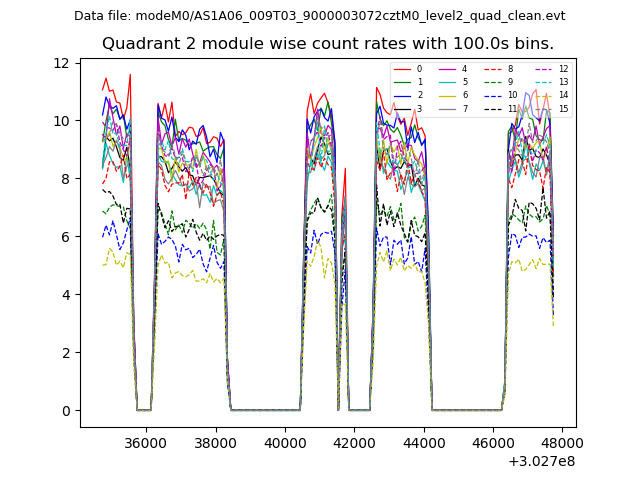
| Module-wise count rates for Quadrant A Data is divided into 100 sec bins |
 |
 |
| Module-wise count rates for Quadrant B Data is divided into 100 sec bins |
 |
 |
| Module-wise count rates for Quadrant C Data is divided into 100 sec bins |
 |
 |
| Module-wise count rates for Quadrant D Data is divided into 100 sec bins |
 |
 |
| Parameter | Plot |
|---|---|
| CZT HV Monitor | 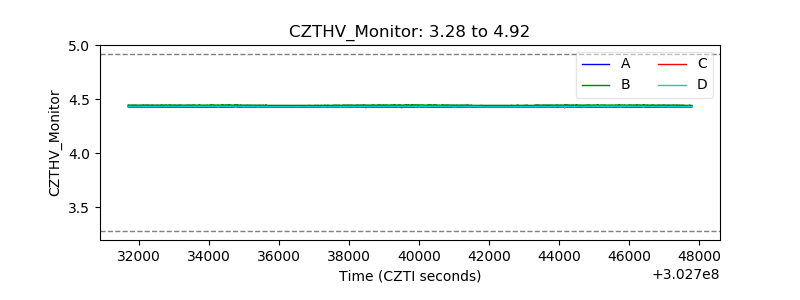 |
| D_VDD | 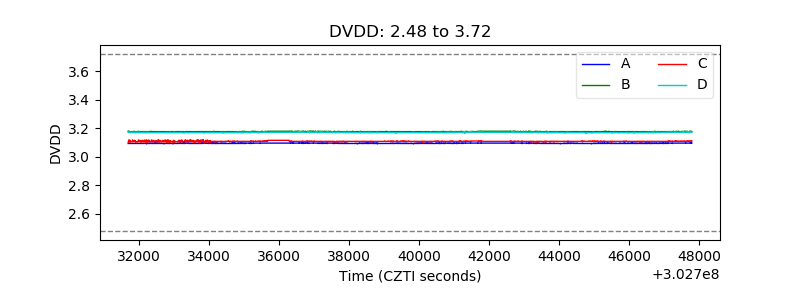 |
| Temperature 1 | 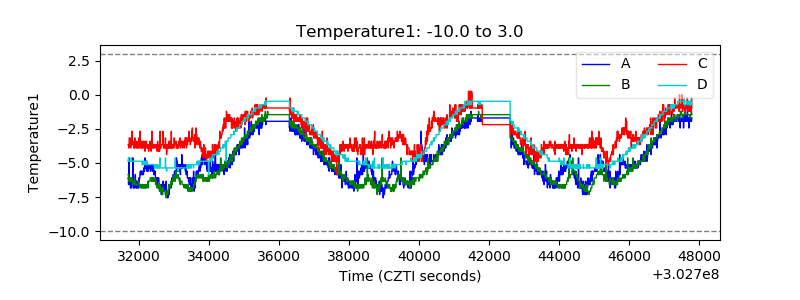 |
| Veto HV Monitor |  |
| Veto LLD | 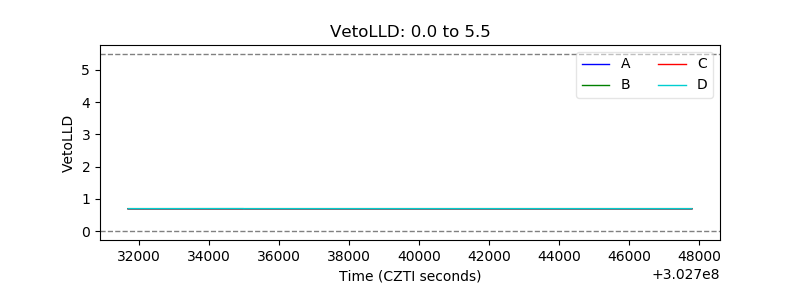 |
| Alpha Counter |  |
| _CPM_Rate | 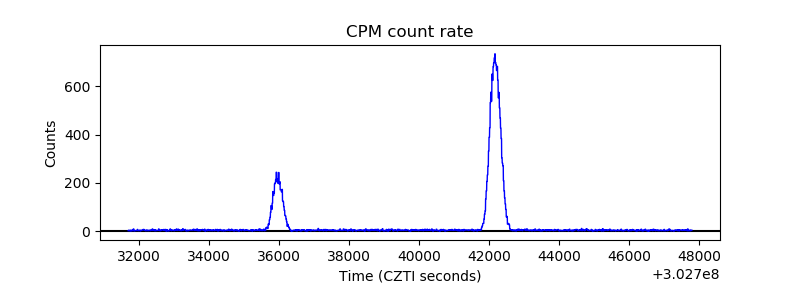 |
| CZT Counter |  |
| +2.5 Volts monitor |  |
| +5 Volts monitor |  |
| _ROLL_ROT |  |
| _Roll_DEC |  |
| _Roll_RA |  |
| Veto Counter |  |