| Param | Original file | Final file |
|---|---|---|
| Filename | modeM0/AS1A06_009T03_9000003072_20837cztM0_level2.evt | modeM0/AS1A06_009T03_9000003072_20837cztM0_level2_quad_clean.evt |
| Size (bytes) | 882,950,400 | 135,120,960 |
| Size | 842.0 MB | 128.9 MB |
| Events in quadrant A | 5,187,878 | 851,461 |
| Events in quadrant B | 5,529,880 | 856,366 |
| Events in quadrant C | 5,366,172 | 833,940 |
| Events in quadrant D | 9,911,293 | 786,995 |
| Mode M9 | |||
|---|---|---|---|
| Quadrant | BADHDUFLAG | Total packets | Discarded packets |
| A | 0 | 14 | 0 |
| B | 0 | 14 | 0 |
| C | 0 | 14 | 0 |
| D | 0 | 14 | 0 |
| Mode SS | |||
|---|---|---|---|
| Quadrant | BADHDUFLAG | Total packets | Discarded packets |
| A | 0 | 224 | 0 |
| B | 0 | 224 | 0 |
| C | 0 | 224 | 0 |
| D | 0 | 224 | 0 |
| Mode M0 | |||
|---|---|---|---|
| Quadrant | BADHDUFLAG | Total packets | Discarded packets |
| A | 0 | 22741 | 3 |
| B | 0 | 23526 | 3 |
| C | 0 | 23001 | 3 |
| D | 0 | 37148 | 3 |
| Quadrant | Total seconds | Saturated seconds | Saturation percentage |
|---|---|---|---|
| A | 11029 | 49 | 0.444283% |
| B | 11029 | 94 | 0.852298% |
| C | 11029 | 101 | 0.915768% |
| D | 11029 | 399 | 3.617735% |
Noise dominated data is calculated using 1-second bins in cleaned event files. If a bin has >2000 counts, and if more than 50% of those come from <1% of pixels, then it is considered to be noise-dominated and hence unusable.
| Quadrant | # 1 sec bins | Bins with >0 counts | Bins with >2000 counts | High rate bins dominated by noise | Noise dominated (total time) | Noise dominated (detector-on time) | Marked lightcurve |
|---|---|---|---|---|---|---|---|
| A | 12454 | 11031 | 4 | 4 | 0.03% | 0.04% |  |
| B | 12454 | 11030 | 17 | 17 | 0.14% | 0.15% |  |
| C | 12454 | 11030 | 12 | 12 | 0.10% | 0.11% |  |
| D | 12454 | 11031 | 211 | 211 | 1.69% | 1.91% |  |
Top three noisy pixels from each quadrant. If the there are fewer than three noisy pixels in the level2.evt file, extra rows are filled as -1
| Pixel properties | Quadrant properties | ||||||
|---|---|---|---|---|---|---|---|
| Quadrant | DetID | PixID | Counts | Sigma | Mean | Median | Sigma |
| A | 5 | 16 | 59140 | 216.41 | 1327 | 1299 | 267.3 |
| A | 2 | 79 | 28343 | 101.19 | 1327 | 1299 | 267.3 |
| A | 0 | 226 | 11564 | 38.41 | 1327 | 1299 | 267.3 |
| B | 7 | 220 | 146305 | 572.23 | 1323 | 1288 | 253.4 |
| B | 0 | 189 | 75974 | 294.71 | 1323 | 1288 | 253.4 |
| B | 3 | 64 | 49565 | 190.5 | 1323 | 1288 | 253.4 |
| C | 14 | 238 | 199172 | 663.3 | 1274 | 1284 | 298.3 |
| C | 9 | 54 | 187650 | 624.68 | 1274 | 1284 | 298.3 |
| C | 13 | 61 | 9173 | 26.44 | 1274 | 1284 | 298.3 |
| D | 1 | 20 | 4138452 | 13338.31 | 1273 | 1236 | 310.2 |
| D | 1 | 52 | 726571 | 2338.47 | 1273 | 1236 | 310.2 |
| D | 9 | 1 | 58136 | 183.44 | 1273 | 1236 | 310.2 |
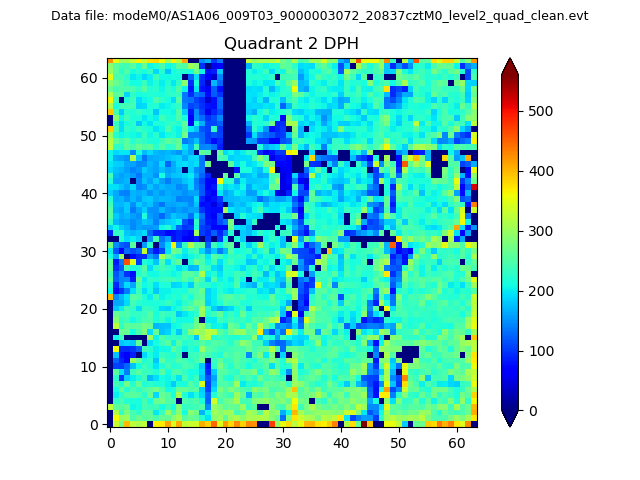
Histogram calculated using DETX and DETY for each event in the final _common_clean file
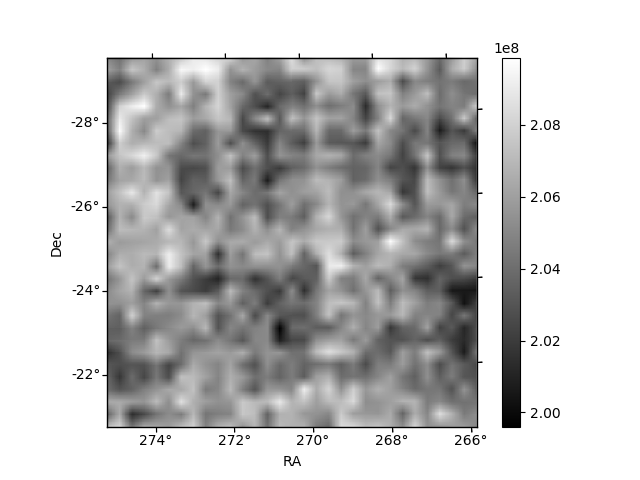
| Quadrant A | 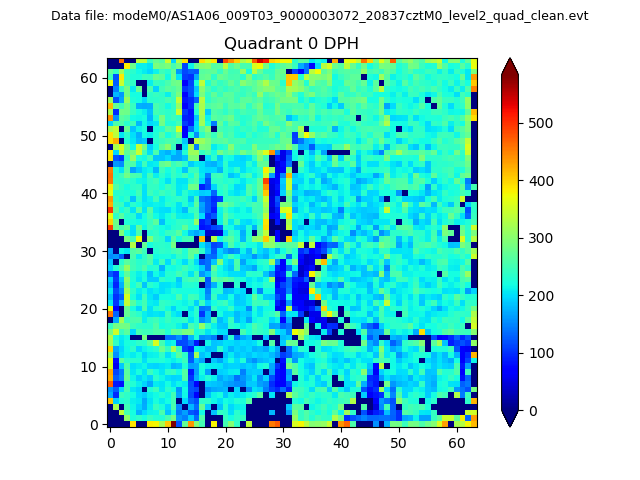 |
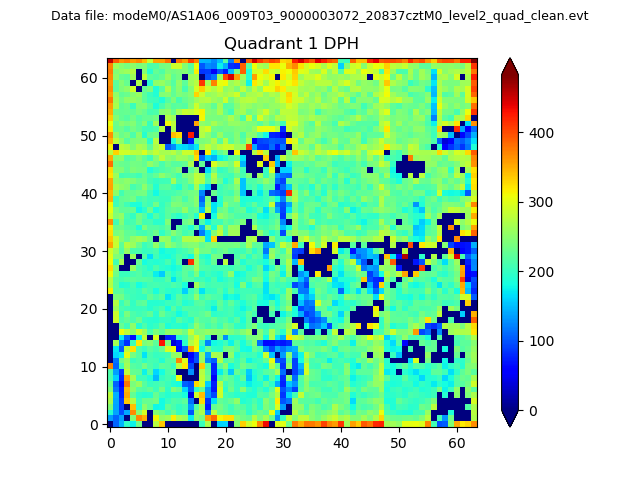 |
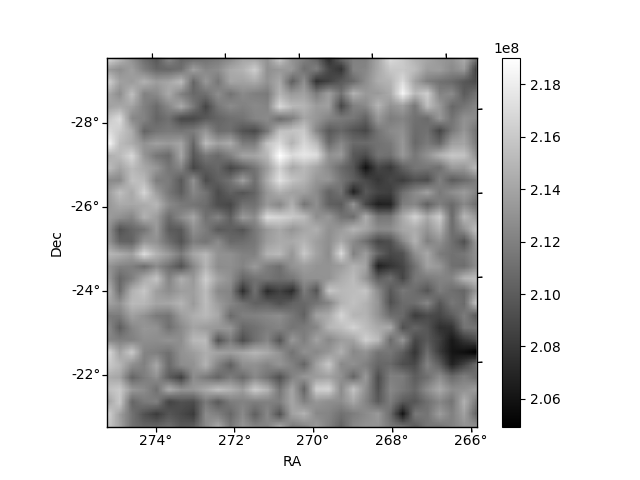
Quadrant B |
|---|---|---|---|
| Quadrant D | 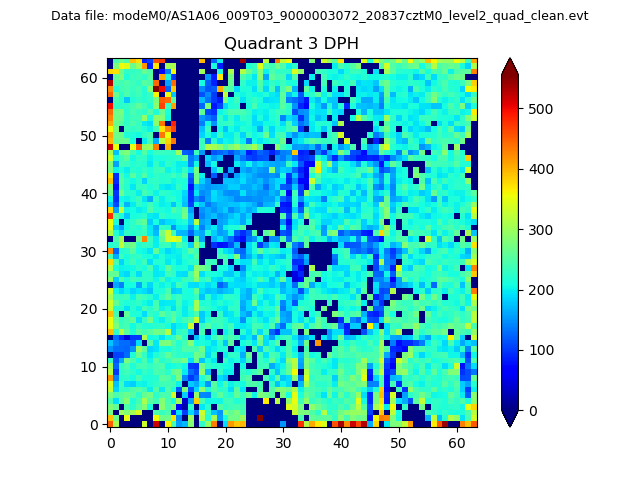 |
 |
Quadrant C |
| Plot type | Count rate plots | Images |
|---|---|---|
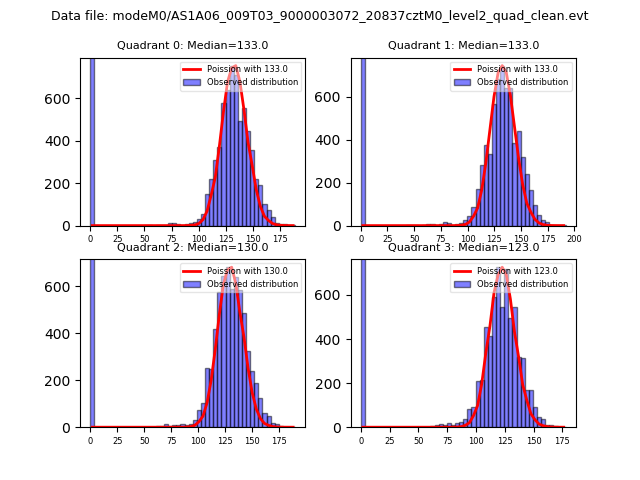
| Comparison with Poisson distribution Blue bars denote a histogram of data divided into 1 sec bins. Red curve is a Poisson curve with rate = median count rate of data. |
 |
 |
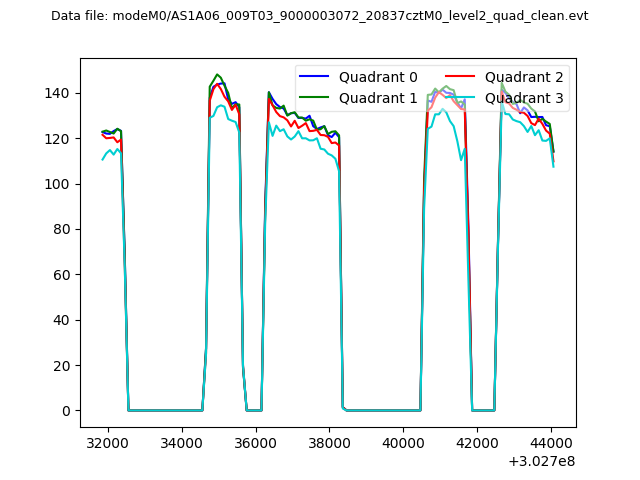
| Quadrant-wise count rates Data is divided into 100 sec bins |
 |
|
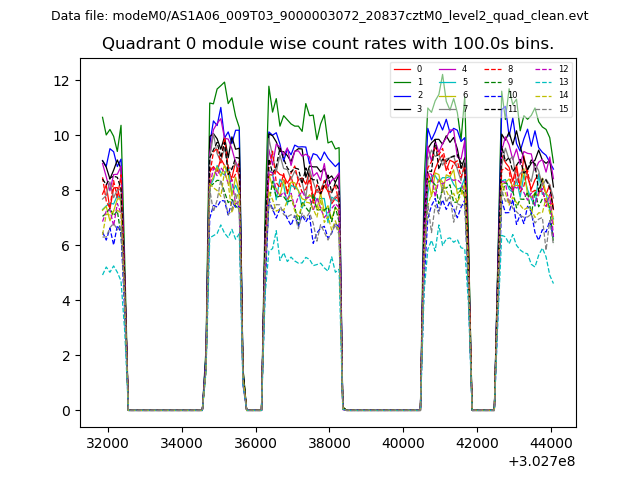
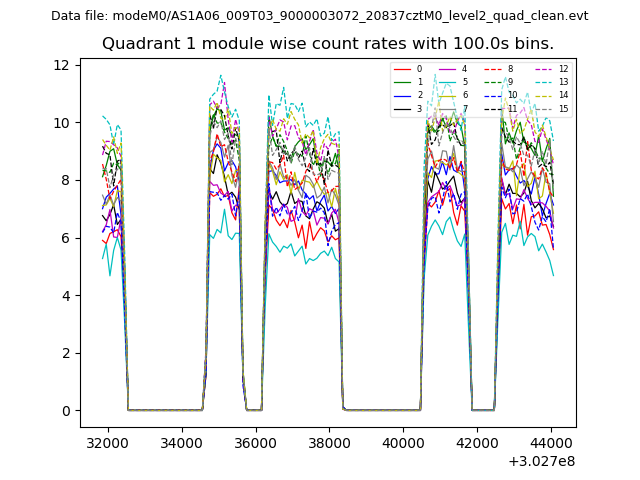
| Module-wise count rates for Quadrant A Data is divided into 100 sec bins |
 |
 |
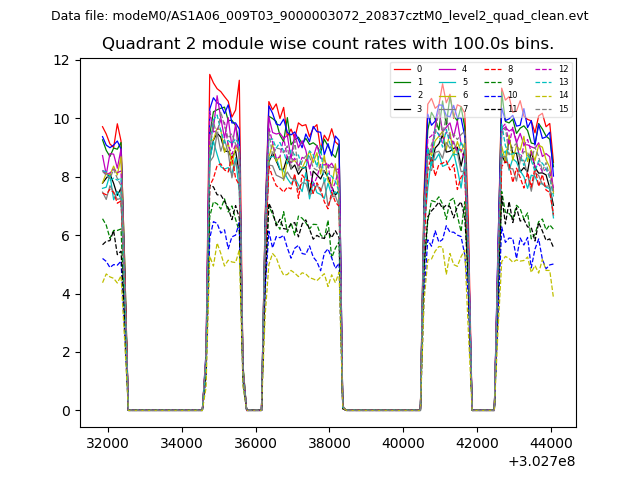
| Module-wise count rates for Quadrant B Data is divided into 100 sec bins |
 |
 |
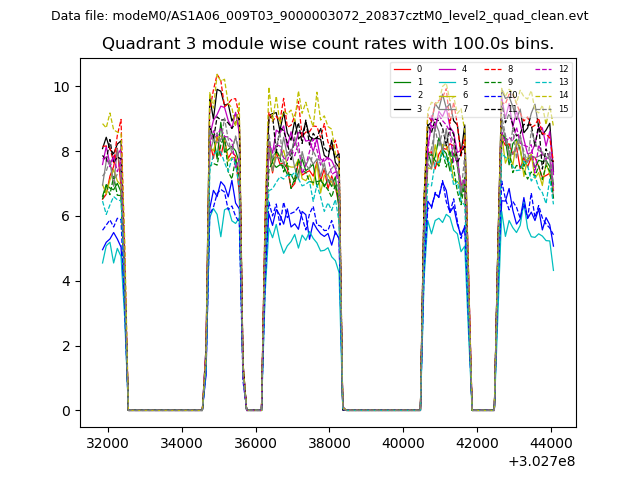
| Module-wise count rates for Quadrant C Data is divided into 100 sec bins |
 |
 |
| Module-wise count rates for Quadrant D Data is divided into 100 sec bins |
 |
 |
| Parameter | Plot |
|---|---|
| CZT HV Monitor | 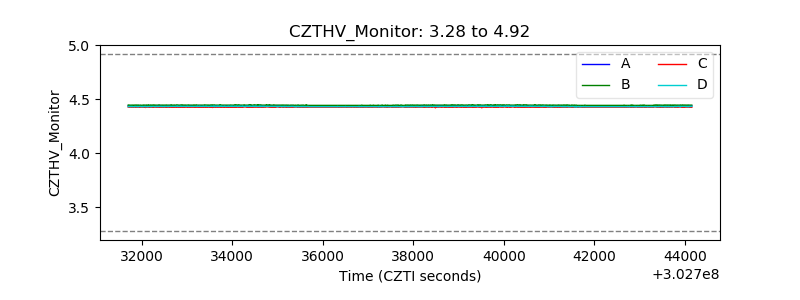 |
| D_VDD | 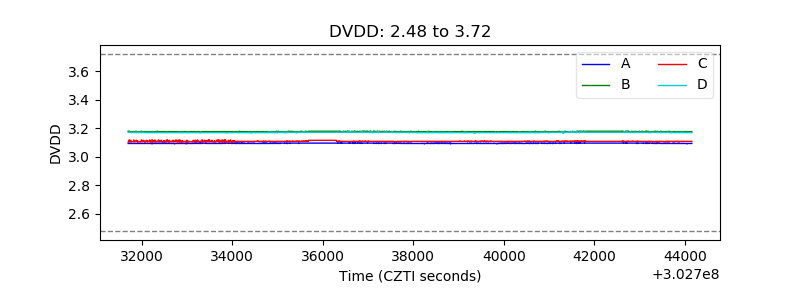 |
| Temperature 1 | 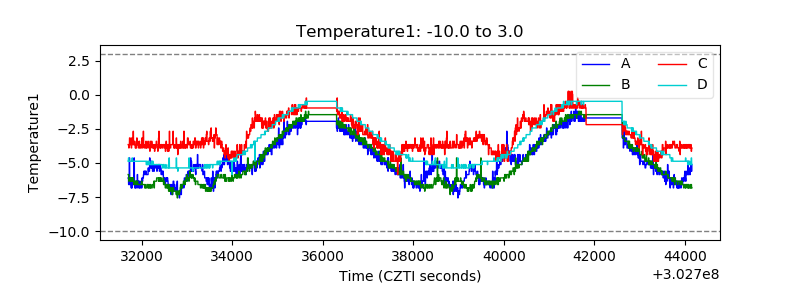 |
| Veto HV Monitor | 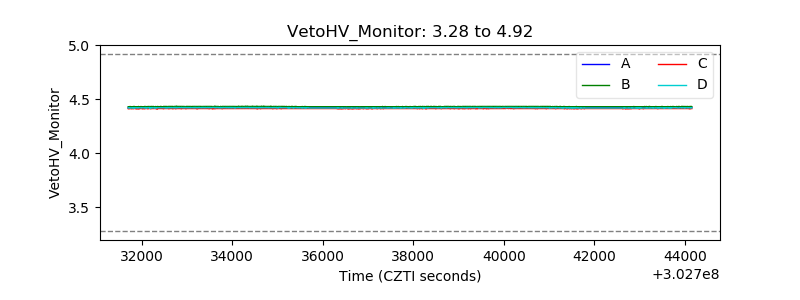 |
| Veto LLD |  |
| Alpha Counter | 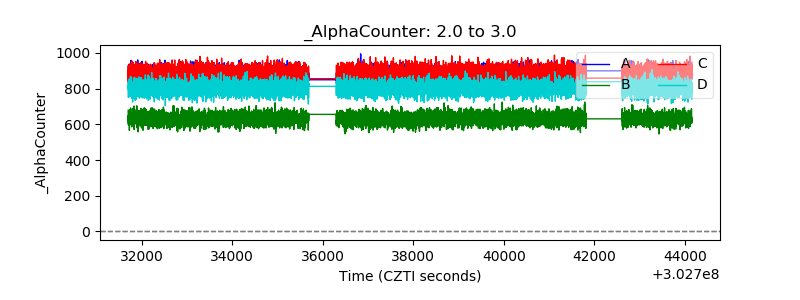 |
| _CPM_Rate | 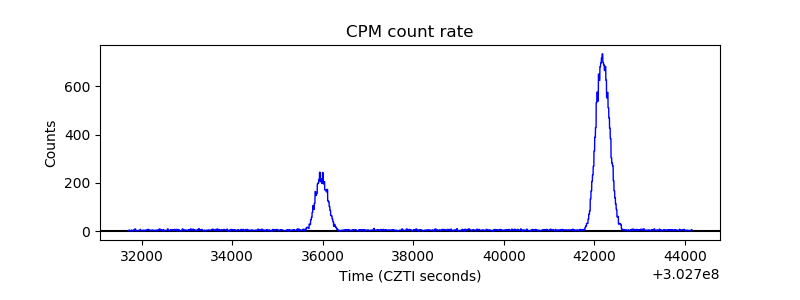 |
| CZT Counter | 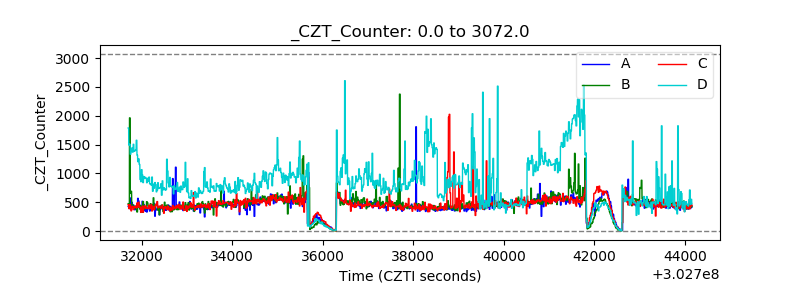 |
| +2.5 Volts monitor |  |
| +5 Volts monitor |  |
| _ROLL_ROT | 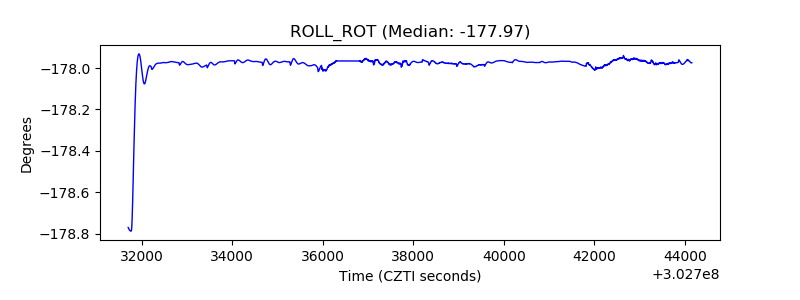 |
| _Roll_DEC | 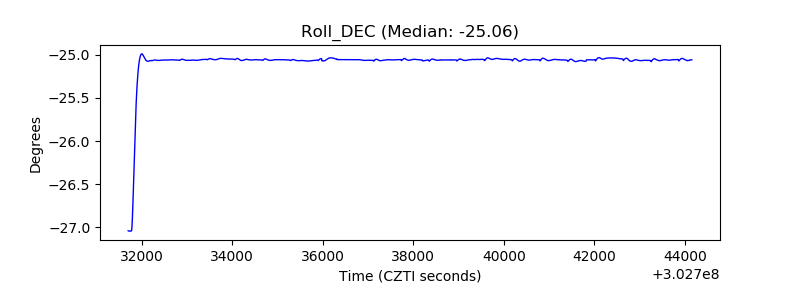 |
| _Roll_RA | 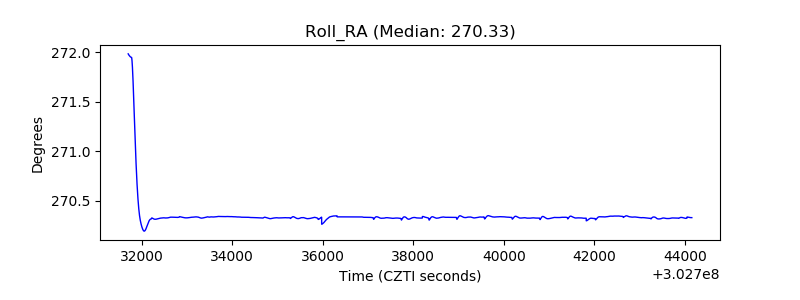 |
| Veto Counter | 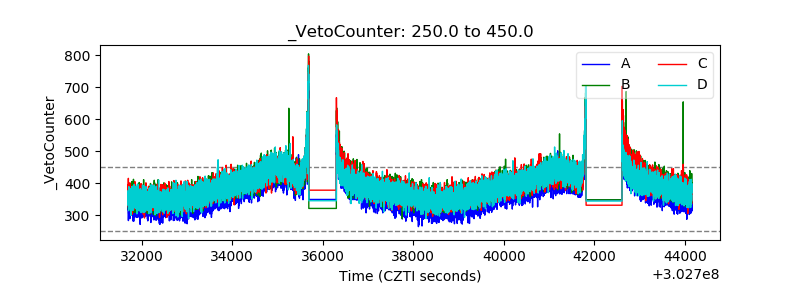 |