| Param | Original file | Final file |
|---|---|---|
| Filename | modeM0/AS1A06_009T03_9000003072_20838cztM0_level2.evt | modeM0/AS1A06_009T03_9000003072_20838cztM0_level2_quad_clean.evt |
| Size (bytes) | 1,120,858,560 | 165,729,600 |
| Size | 1.0 GB | 158.1 MB |
| Events in quadrant A | 6,795,194 | 1,024,861 |
| Events in quadrant B | 7,315,566 | 1,028,449 |
| Events in quadrant C | 6,986,407 | 1,004,836 |
| Events in quadrant D | 11,866,523 | 957,524 |
| Mode M9 | |||
|---|---|---|---|
| Quadrant | BADHDUFLAG | Total packets | Discarded packets |
| A | 0 | 14 | 0 |
| B | 0 | 14 | 0 |
| C | 0 | 14 | 0 |
| D | 0 | 14 | 0 |
| Mode SS | |||
|---|---|---|---|
| Quadrant | BADHDUFLAG | Total packets | Discarded packets |
| A | 0 | 296 | 0 |
| B | 0 | 296 | 0 |
| C | 0 | 296 | 0 |
| D | 0 | 296 | 0 |
| Mode M0 | |||
|---|---|---|---|
| Quadrant | BADHDUFLAG | Total packets | Discarded packets |
| A | 0 | 29813 | 3 |
| B | 0 | 31085 | 3 |
| C | 0 | 30052 | 3 |
| D | 0 | 45307 | 4 |
| Quadrant | Total seconds | Saturated seconds | Saturation percentage |
|---|---|---|---|
| A | 14531 | 55 | 0.378501% |
| B | 14532 | 135 | 0.928984% |
| C | 14532 | 112 | 0.770713% |
| D | 14531 | 486 | 3.344574% |
Noise dominated data is calculated using 1-second bins in cleaned event files. If a bin has >2000 counts, and if more than 50% of those come from <1% of pixels, then it is considered to be noise-dominated and hence unusable.
| Quadrant | # 1 sec bins | Bins with >0 counts | Bins with >2000 counts | High rate bins dominated by noise | Noise dominated (total time) | Noise dominated (detector-on time) | Marked lightcurve |
|---|---|---|---|---|---|---|---|
| A | 16101 | 14534 | 4 | 4 | 0.02% | 0.03% | 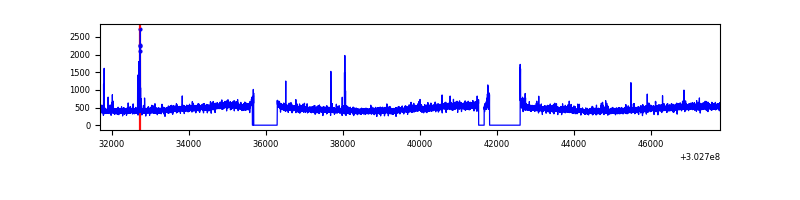 |
| B | 16101 | 14534 | 38 | 38 | 0.24% | 0.26% | 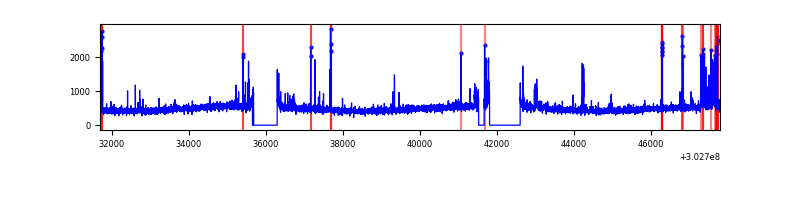 |
| C | 16101 | 14534 | 12 | 12 | 0.07% | 0.08% | 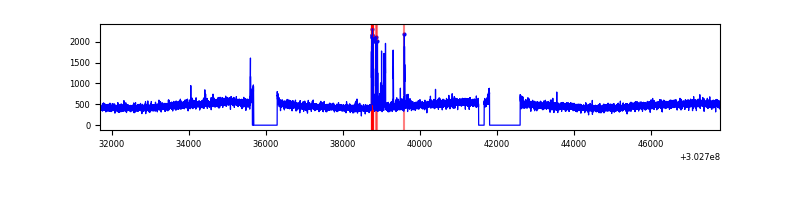 |
| D | 16101 | 14533 | 299 | 299 | 1.86% | 2.06% | 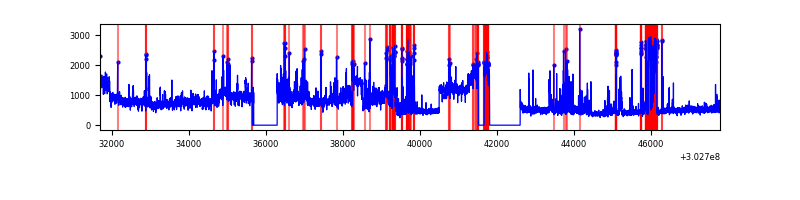 |
Top three noisy pixels from each quadrant. If the there are fewer than three noisy pixels in the level2.evt file, extra rows are filled as -1
| Pixel properties | Quadrant properties | ||||||
|---|---|---|---|---|---|---|---|
| Quadrant | DetID | PixID | Counts | Sigma | Mean | Median | Sigma |
| A | 5 | 16 | 59592 | 165.58 | 1741 | 1706 | 349.6 |
| A | 2 | 79 | 41347 | 113.39 | 1741 | 1706 | 349.6 |
| A | 0 | 226 | 15121 | 38.37 | 1741 | 1706 | 349.6 |
| B | 7 | 220 | 219939 | 658.18 | 1734 | 1688 | 331.6 |
| B | 3 | 64 | 106445 | 315.91 | 1734 | 1688 | 331.6 |
| B | 0 | 189 | 90650 | 268.28 | 1734 | 1688 | 331.6 |
| C | 14 | 238 | 262645 | 667.79 | 1673 | 1685 | 390.8 |
| C | 9 | 54 | 188206 | 477.3 | 1673 | 1685 | 390.8 |
| C | 13 | 61 | 12035 | 26.49 | 1673 | 1685 | 390.8 |
| D | 1 | 20 | 3939130 | 9702.71 | 1667 | 1617 | 405.8 |
| D | 1 | 52 | 861388 | 2118.62 | 1667 | 1617 | 405.8 |
| D | 9 | 1 | 591803 | 1454.32 | 1667 | 1617 | 405.8 |
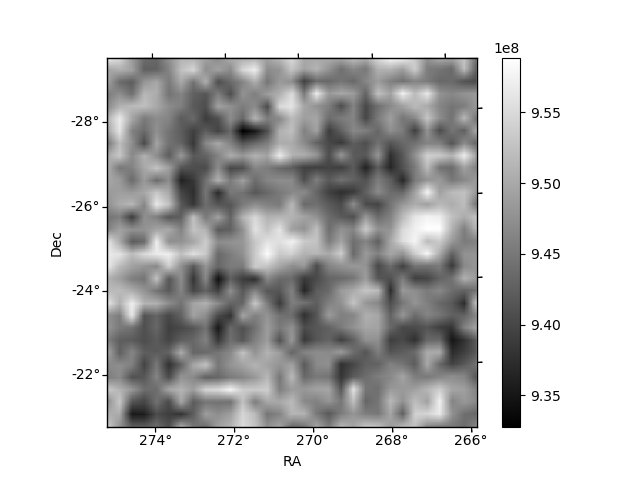
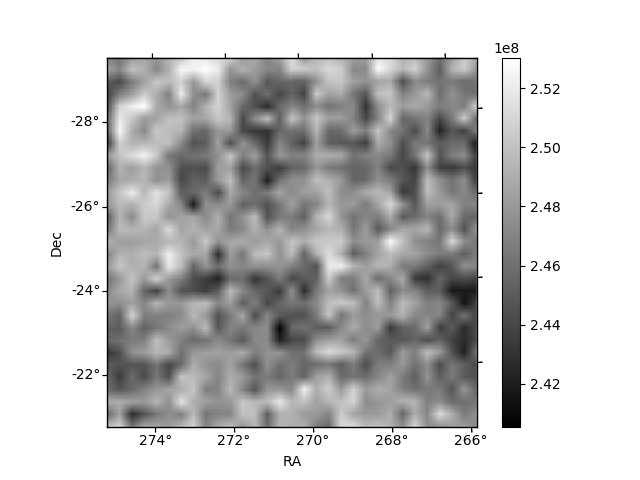
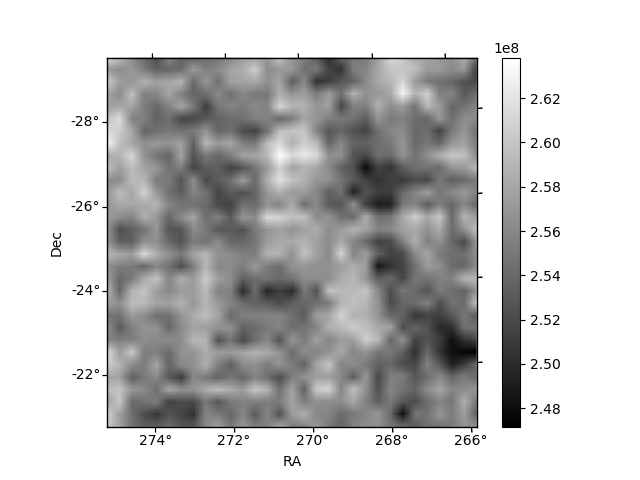
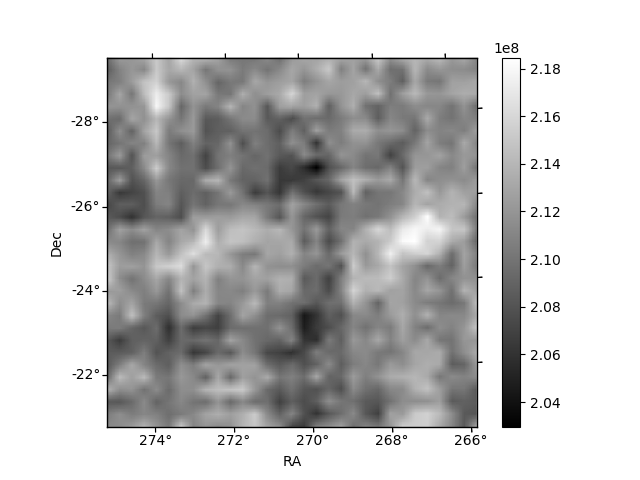
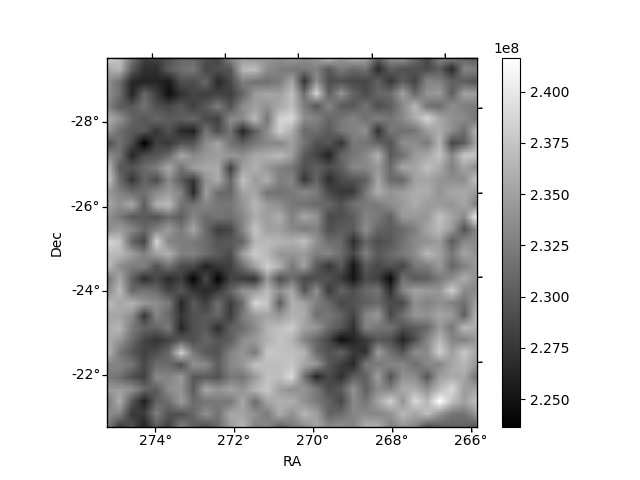
Histogram calculated using DETX and DETY for each event in the final _common_clean file
| Quadrant A | 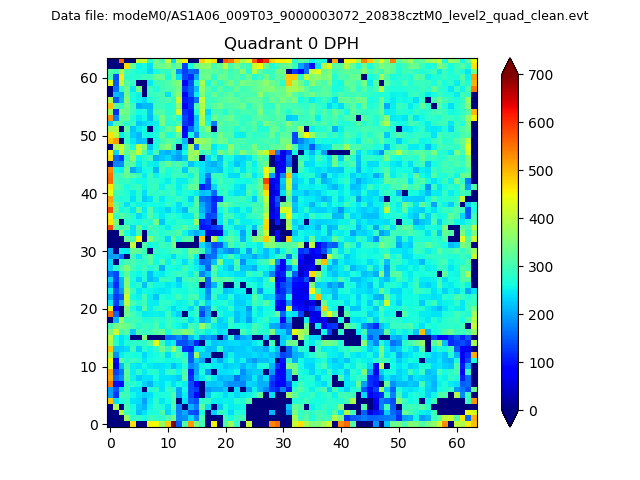 |
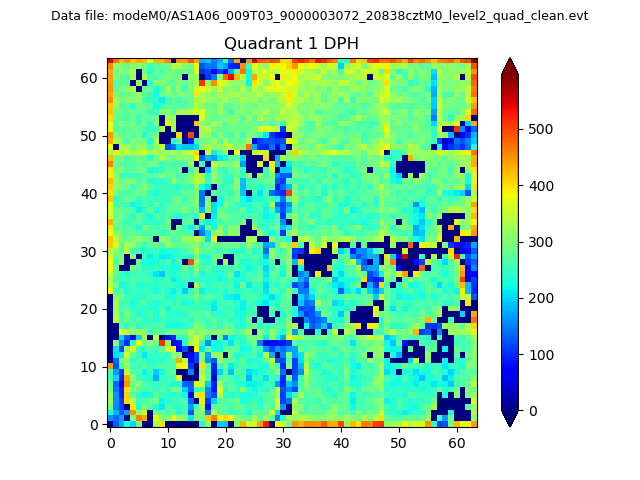 |
Quadrant B |
|---|---|---|---|
| Quadrant D |  |
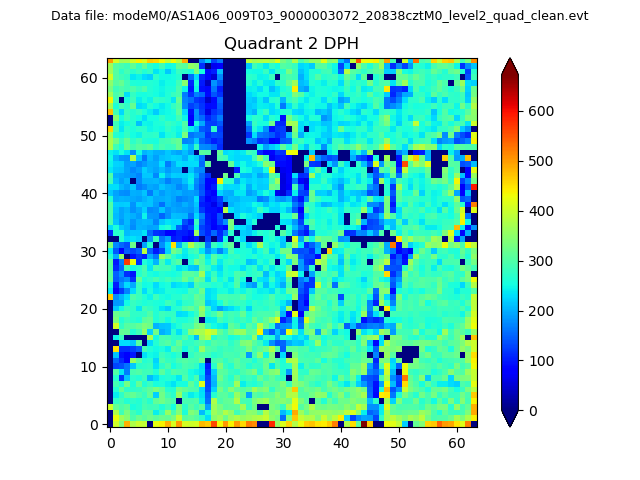 |
Quadrant C |
| Plot type | Count rate plots | Images |
|---|---|---|
| Comparison with Poisson distribution Blue bars denote a histogram of data divided into 1 sec bins. Red curve is a Poisson curve with rate = median count rate of data. |
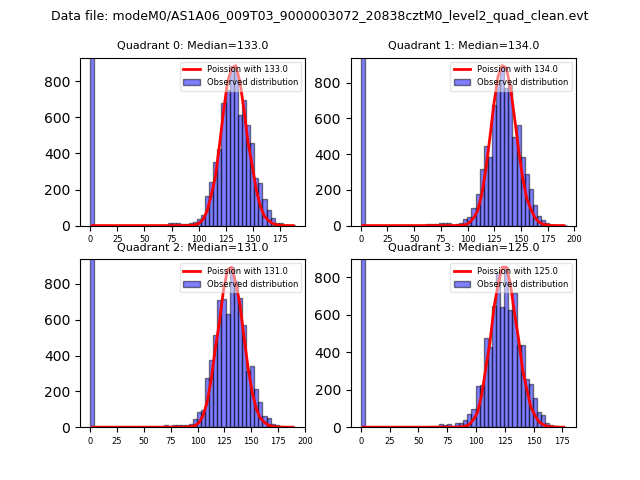 |
 |
| Quadrant-wise count rates Data is divided into 100 sec bins |
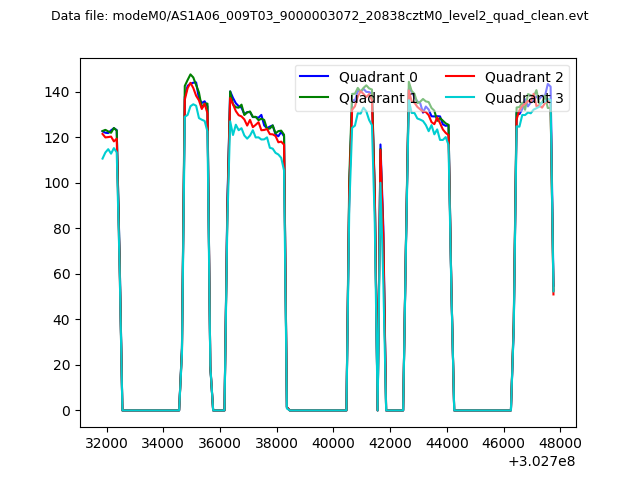 |
|
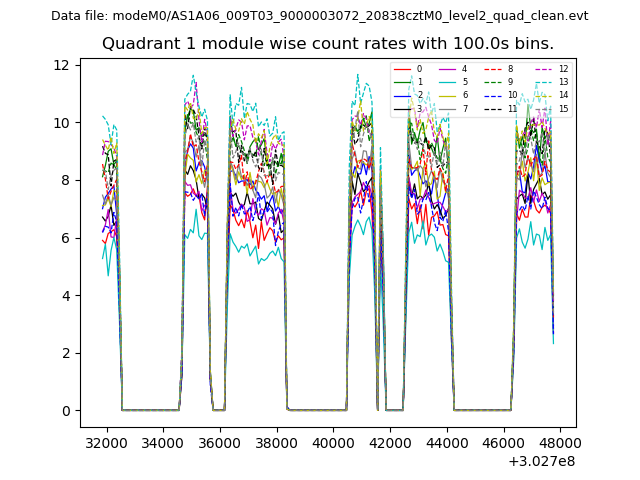
| Module-wise count rates for Quadrant A Data is divided into 100 sec bins |
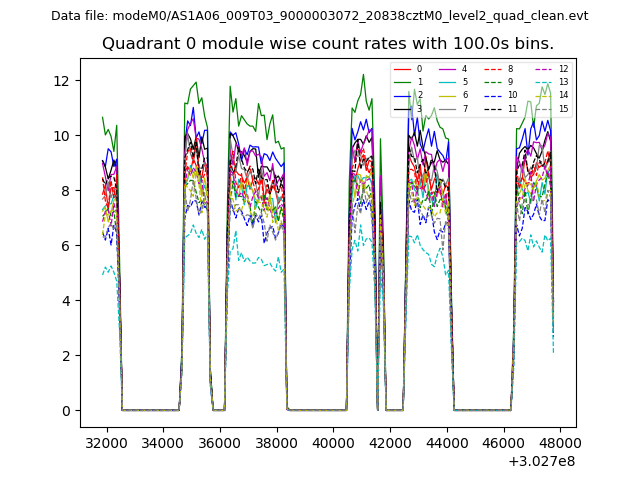 |
 |
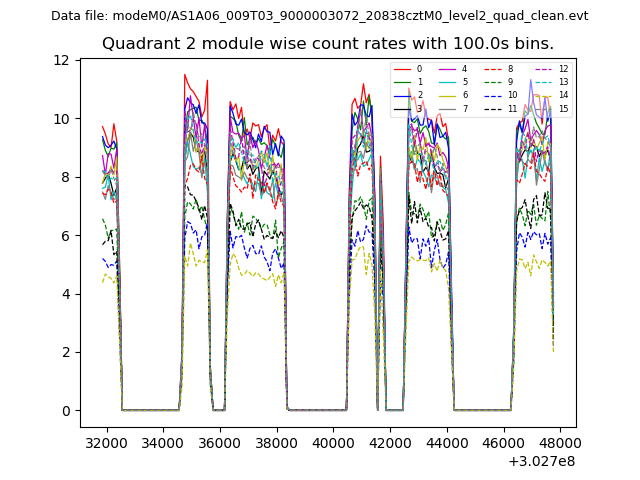
| Module-wise count rates for Quadrant B Data is divided into 100 sec bins |
 |
 |
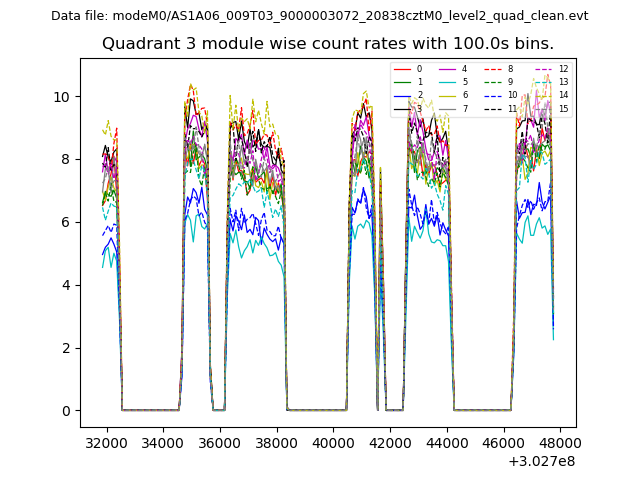
| Module-wise count rates for Quadrant C Data is divided into 100 sec bins |
 |
 |
| Module-wise count rates for Quadrant D Data is divided into 100 sec bins |
 |
 |
| Parameter | Plot |
|---|---|
| CZT HV Monitor | 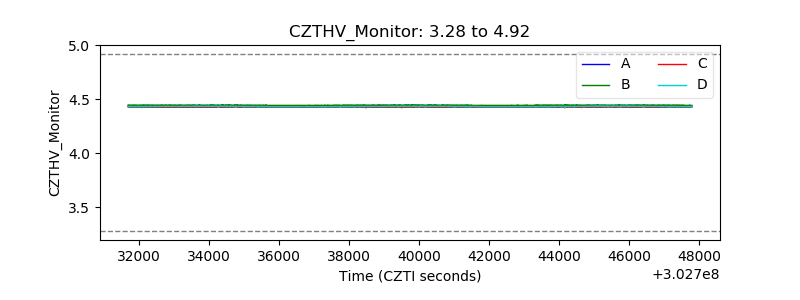 |
| D_VDD |  |
| Temperature 1 | 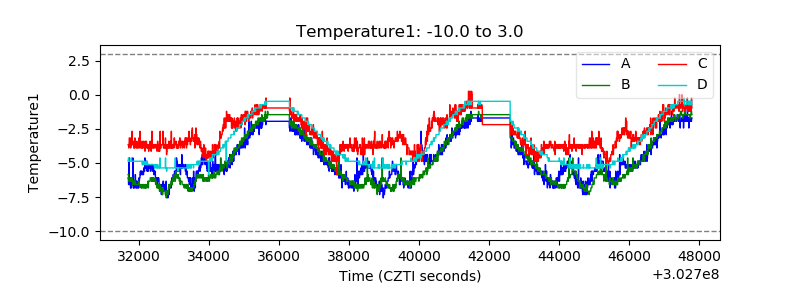 |
| Veto HV Monitor |  |
| Veto LLD | 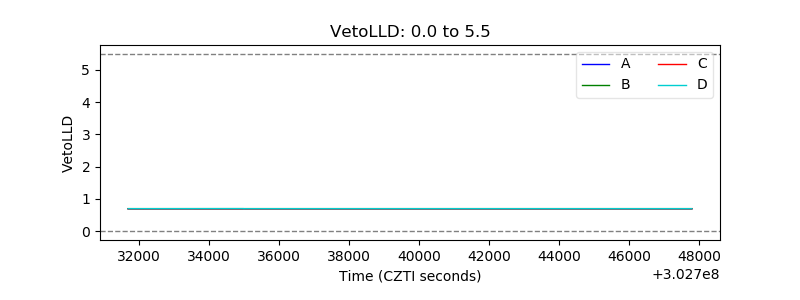 |
| Alpha Counter | 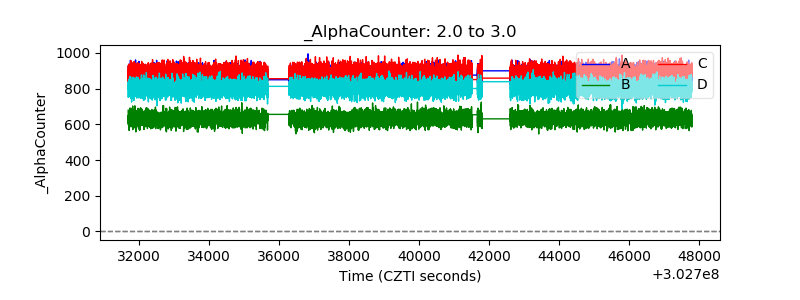 |
| _CPM_Rate | 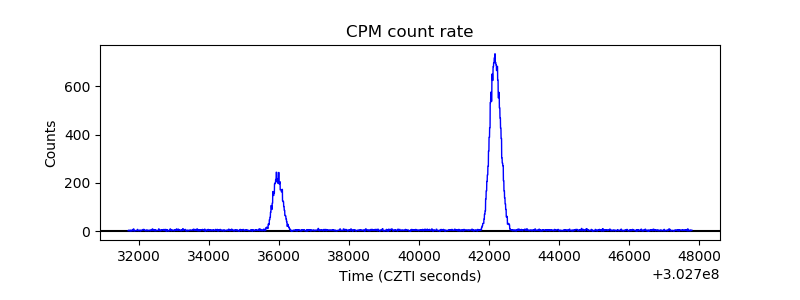 |
| CZT Counter | 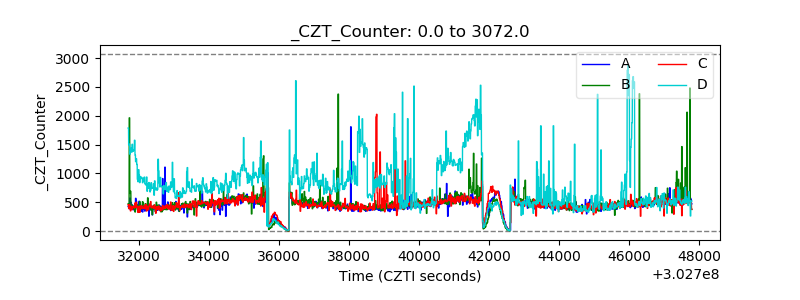 |
| +2.5 Volts monitor |  |
| +5 Volts monitor |  |
| _ROLL_ROT | 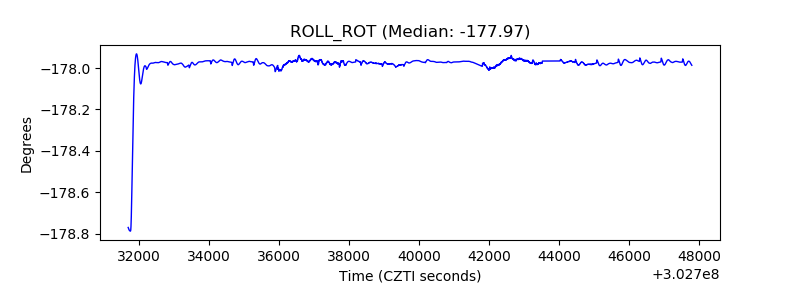 |
| _Roll_DEC | 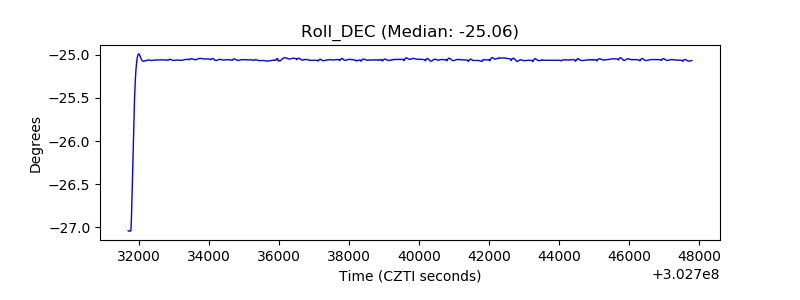 |
| _Roll_RA | 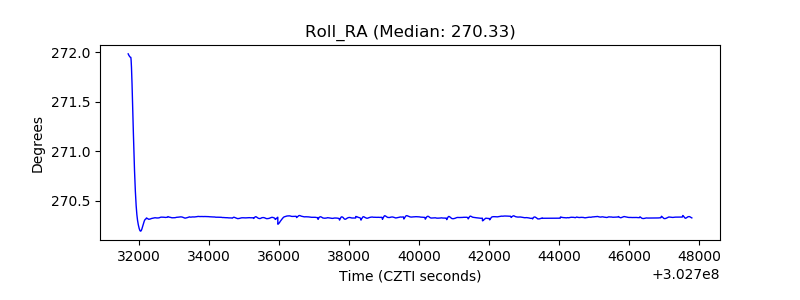 |
| Veto Counter | 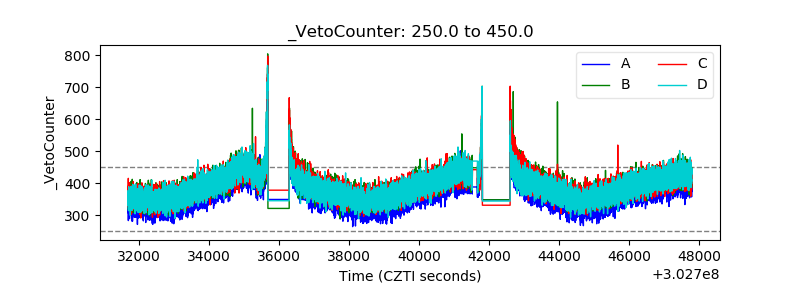 |