| Param | Original file | Final file |
|---|---|---|
| Filename | modeM0/AS1A06_009T02_9000003076cztM0_level2.fits | modeM0/AS1A06_009T02_9000003076cztM0_level2_quad_clean.evt |
| Size (bytes) | 63,313,920 | 72,072,000 |
| Size | 60.4 MB | 68.7 MB |
| Events in quadrant A | 390,020 | 457,737 |
| Events in quadrant B | 373,744 | 456,059 |
| Events in quadrant C | 383,586 | 445,830 |
| Events in quadrant D | 289,394 | 341,951 |
| Mode M0 | |||
|---|---|---|---|
| Quadrant | BADHDUFLAG | Total packets | Discarded packets |
| A | 0 | 14870 | 0 |
| B | 0 | 15354 | 0 |
| C | 0 | 13995 | 0 |
| D | 0 | 33922 | 0 |
| Mode M9 | |||
|---|---|---|---|
| Quadrant | BADHDUFLAG | Total packets | Discarded packets |
| A | 0 | 15 | 0 |
| B | 0 | 15 | 0 |
| C | 0 | 15 | 0 |
| D | 0 | 15 | 0 |
| Mode SS | |||
|---|---|---|---|
| Quadrant | BADHDUFLAG | Total packets | Discarded packets |
| A | 0 | 138 | 0 |
| B | 0 | 138 | 0 |
| C | 0 | 138 | 0 |
| D | 0 | 138 | 0 |
| Quadrant | Total seconds | Saturated seconds | Saturation percentage |
|---|---|---|---|
| A | 6901 | 100 | 1.449065% |
| B | 6901 | 96 | 1.391103% |
| C | 6901 | 44 | 0.637589% |
| D | 6900 | 1482 | 21.478261% |
Noise dominated data is calculated using 1-second bins in cleaned event files. If a bin has >2000 counts, and if more than 50% of those come from <1% of pixels, then it is considered to be noise-dominated and hence unusable.
| Quadrant | # 1 sec bins | Bins with >0 counts | Bins with >2000 counts | High rate bins dominated by noise | Noise dominated (total time) | Noise dominated (detector-on time) | Marked lightcurve |
|---|---|---|---|---|---|---|---|
| A | 7774 | 6890 | 0 | 0 | 0.00% | 0.00% |  |
| B | 7775 | 6899 | 0 | 0 | 0.00% | 0.00% |  |
| C | 7774 | 6899 | 0 | 0 | 0.00% | 0.00% |  |
| D | 7773 | 6894 | 0 | 0 | 0.00% | 0.00% | 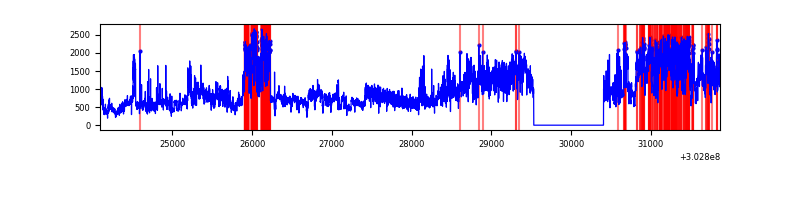 |
Top three noisy pixels from each quadrant. If the there are fewer than three noisy pixels in the level2.evt file, extra rows are filled as -1
| Pixel properties | Quadrant properties | ||||||
|---|---|---|---|---|---|---|---|
| Quadrant | DetID | PixID | Counts | Sigma | Mean | Median | Sigma |
| A | 0 | 29 | 363 | 9.77 | 101 | 95 | 27.4 |
| A | 7 | 110 | 310 | 7.84 | 101 | 95 | 27.4 |
| A | 0 | 30 | 296 | 7.33 | 101 | 95 | 27.4 |
| B | 2 | 9 | 286 | 9.03 | 98 | 94 | 21.3 |
| B | 2 | 8 | 269 | 8.23 | 98 | 94 | 21.3 |
| B | 5 | 128 | 267 | 8.14 | 98 | 94 | 21.3 |
| C | 1 | 80 | 295 | 7.24 | 101 | 94 | 27.8 |
| C | 1 | 81 | 291 | 7.1 | 101 | 94 | 27.8 |
| C | 12 | 249 | 287 | 6.95 | 101 | 94 | 27.8 |
| D | 15 | 46 | 231 | 6.62 | 82 | 74 | 23.7 |
| D | 4 | 246 | 221 | 6.2 | 82 | 74 | 23.7 |
| D | 6 | 67 | 212 | 5.82 | 82 | 74 | 23.7 |
Histogram calculated using DETX and DETY for each event in the final _common_clean file
| Quadrant A |  |
 |
Quadrant B |
|---|---|---|---|
| Quadrant D |  |
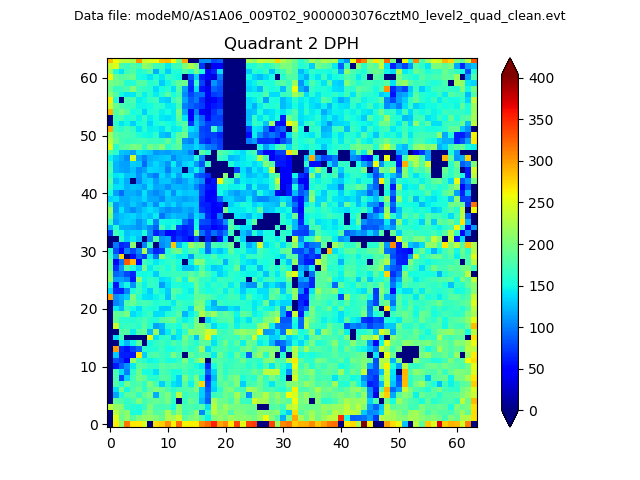 |
Quadrant C |
| Plot type | Count rate plots | Images |
|---|---|---|
| Comparison with Poisson distribution Blue bars denote a histogram of data divided into 1 sec bins. Red curve is a Poisson curve with rate = median count rate of data. |
 |
 |
| Quadrant-wise count rates Data is divided into 100 sec bins |
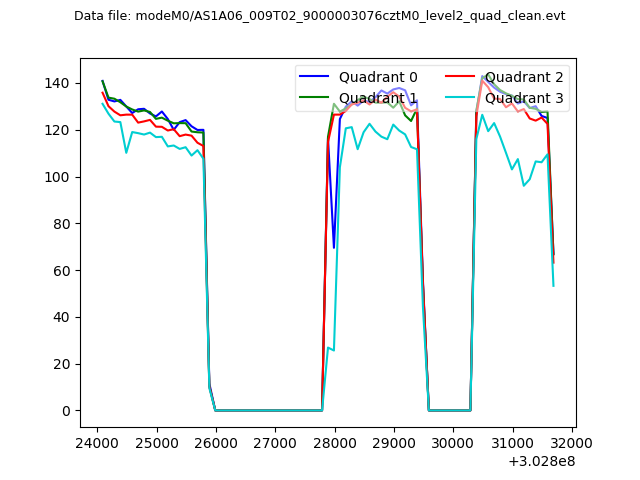 |
|
| Module-wise count rates for Quadrant A Data is divided into 100 sec bins |
 |
 |
| Module-wise count rates for Quadrant B Data is divided into 100 sec bins |
 |
 |
| Module-wise count rates for Quadrant C Data is divided into 100 sec bins |
 |
 |
| Module-wise count rates for Quadrant D Data is divided into 100 sec bins |
 |
 |
| Parameter | Plot |
|---|---|
| CZT HV Monitor |  |
| D_VDD | 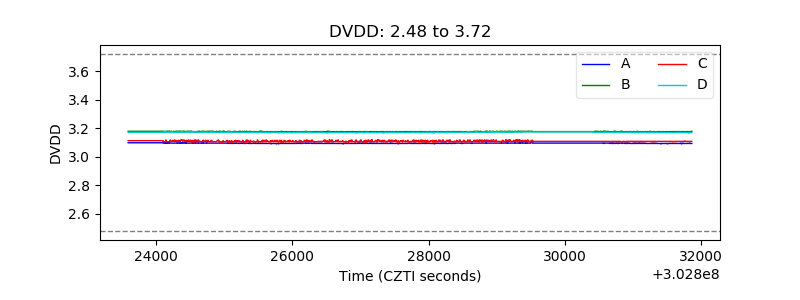 |
| Temperature 1 |  |
| Veto HV Monitor |  |
| Veto LLD |  |
| Alpha Counter | 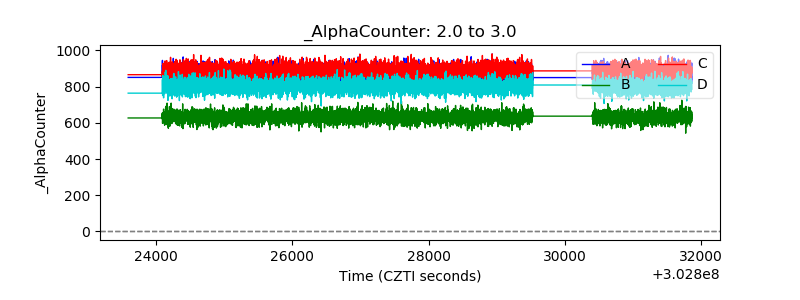 |
| _CPM_Rate |  |
| CZT Counter |  |
| +2.5 Volts monitor |  |
| +5 Volts monitor |  |
| _ROLL_ROT |  |
| _Roll_DEC |  |
| _Roll_RA |  |
| Veto Counter |  |