| Param | Original file | Final file |
|---|---|---|
| Filename | modeM0/AS1A06_009T02_9000003076_20851cztM0_level2.evt | modeM0/AS1A06_009T02_9000003076_20851cztM0_level2_quad_clean.evt |
| Size (bytes) | 114,981,120 | 27,388,800 |
| Size | 109.7 MB | 26.1 MB |
| Events in quadrant A | 662,020 | 185,324 |
| Events in quadrant B | 712,472 | 185,794 |
| Events in quadrant C | 681,269 | 179,253 |
| Events in quadrant D | 1,325,762 | 171,509 |
| Mode M0 | |||
|---|---|---|---|
| Quadrant | BADHDUFLAG | Total packets | Discarded packets |
| A | 0 | 2936 | 1 |
| B | 0 | 3019 | 1 |
| C | 0 | 2945 | 1 |
| D | 0 | 4967 | 1 |
| Mode M9 | |||
|---|---|---|---|
| Quadrant | BADHDUFLAG | Total packets | Discarded packets |
| A | 0 | 6 | 0 |
| B | 0 | 6 | 0 |
| C | 0 | 6 | 0 |
| D | 0 | 6 | 0 |
| Mode SS | |||
|---|---|---|---|
| Quadrant | BADHDUFLAG | Total packets | Discarded packets |
| A | 0 | 28 | 0 |
| B | 0 | 28 | 0 |
| C | 0 | 28 | 0 |
| D | 0 | 28 | 0 |
| Quadrant | Total seconds | Saturated seconds | Saturation percentage |
|---|---|---|---|
| A | 1444 | 3 | 0.207756% |
| B | 1444 | 12 | 0.831025% |
| C | 1444 | 5 | 0.346260% |
| D | 1444 | 31 | 2.146814% |
Noise dominated data is calculated using 1-second bins in cleaned event files. If a bin has >2000 counts, and if more than 50% of those come from <1% of pixels, then it is considered to be noise-dominated and hence unusable.
| Quadrant | # 1 sec bins | Bins with >0 counts | Bins with >2000 counts | High rate bins dominated by noise | Noise dominated (total time) | Noise dominated (detector-on time) | Marked lightcurve |
|---|---|---|---|---|---|---|---|
| A | 1443 | 1443 | 0 | 0 | 0.00% | 0.00% | 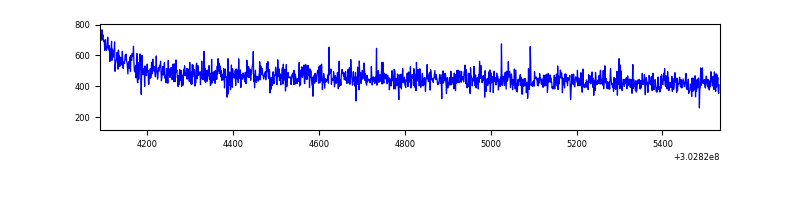 |
| B | 1443 | 1443 | 0 | 0 | 0.00% | 0.00% | 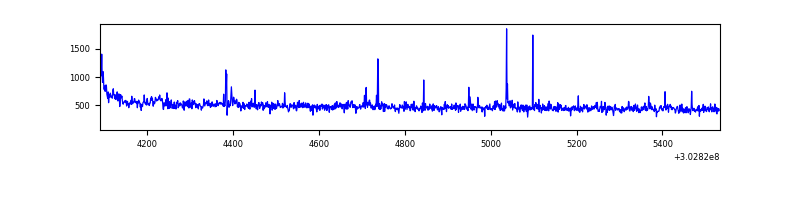 |
| C | 1443 | 1443 | 0 | 0 | 0.00% | 0.00% | 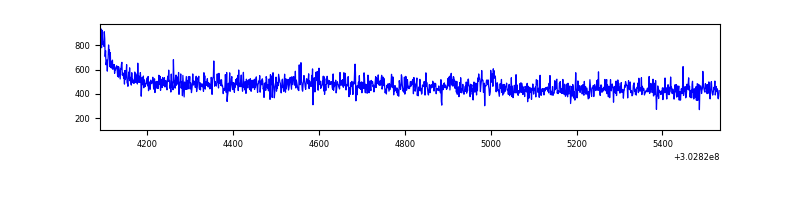 |
| D | 1443 | 1443 | 26 | 26 | 1.80% | 1.80% | 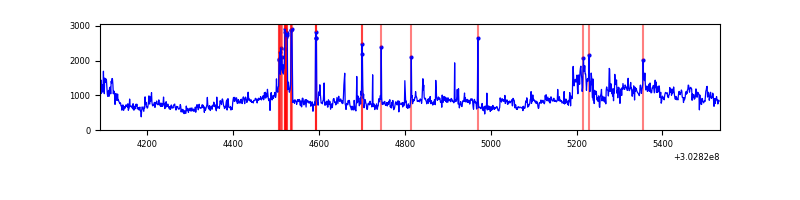 |
Top three noisy pixels from each quadrant. If the there are fewer than three noisy pixels in the level2.evt file, extra rows are filled as -1
| Pixel properties | Quadrant properties | ||||||
|---|---|---|---|---|---|---|---|
| Quadrant | DetID | PixID | Counts | Sigma | Mean | Median | Sigma |
| A | 0 | 226 | 1441 | 34.18 | 172 | 168 | 37.2 |
| A | 3 | 137 | 1394 | 32.92 | 172 | 168 | 37.2 |
| A | 12 | 194 | 1277 | 29.78 | 172 | 168 | 37.2 |
| B | 0 | 190 | 9688 | 264.68 | 173 | 169 | 36.0 |
| B | 0 | 189 | 8661 | 236.12 | 173 | 169 | 36.0 |
| B | 7 | 220 | 4299 | 114.83 | 173 | 169 | 36.0 |
| C | 14 | 238 | 24610 | 602.81 | 162 | 162 | 40.6 |
| C | 3 | 233 | 13161 | 320.51 | 162 | 162 | 40.6 |
| C | 7 | 247 | 5611 | 134.36 | 162 | 162 | 40.6 |
| D | 1 | 239 | 411941 | 9782.24 | 161 | 156 | 42.1 |
| D | 1 | 20 | 219077 | 5200.62 | 161 | 156 | 42.1 |
| D | 13 | 153 | 27692 | 654.14 | 161 | 156 | 42.1 |
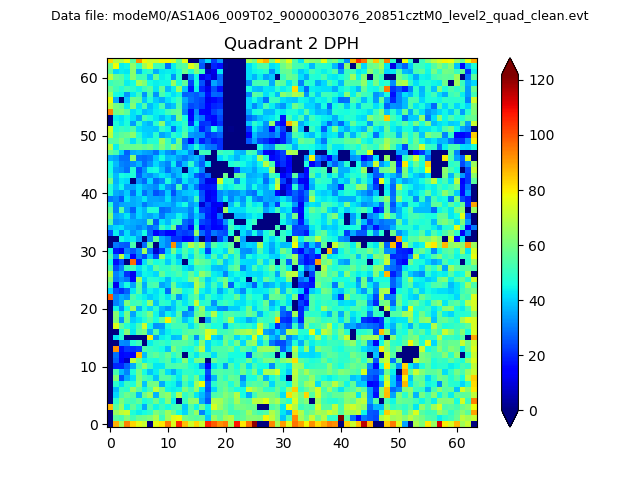
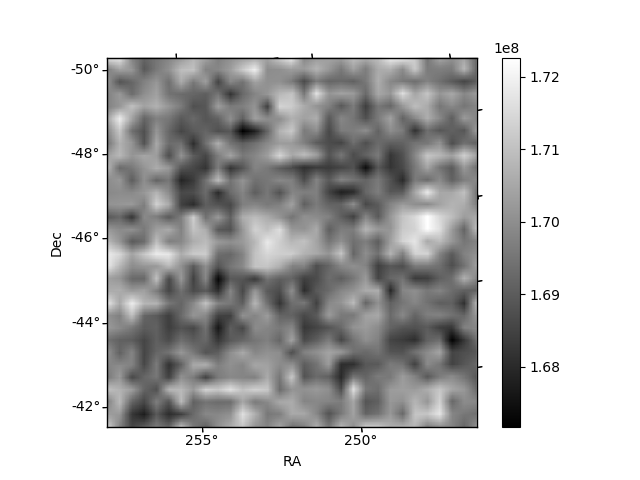
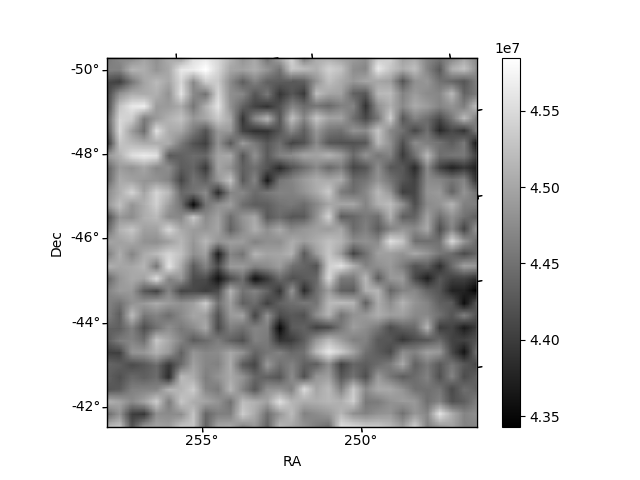
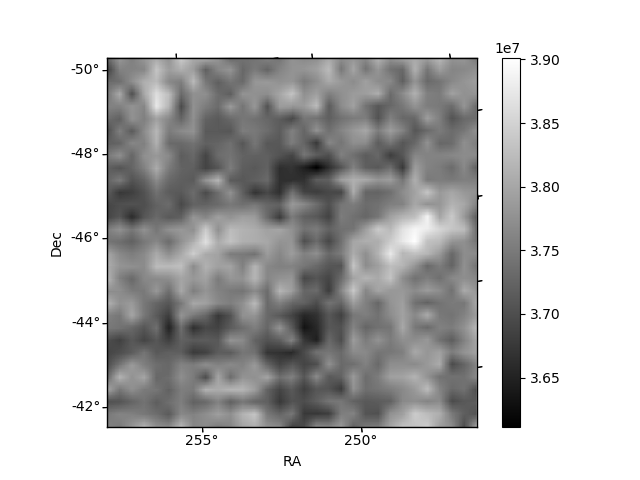
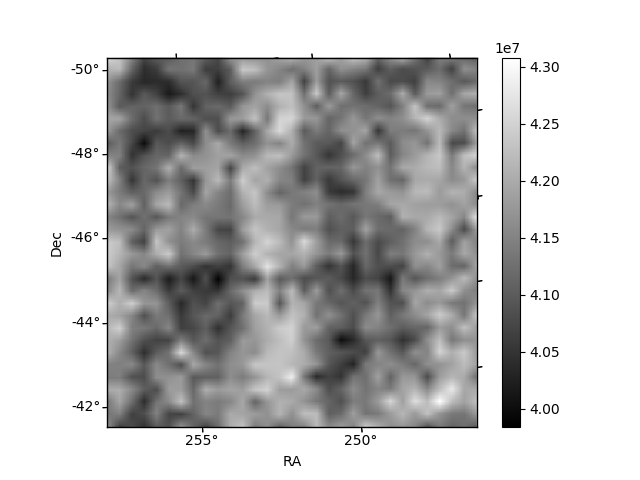
Histogram calculated using DETX and DETY for each event in the final _common_clean file
| Quadrant A | 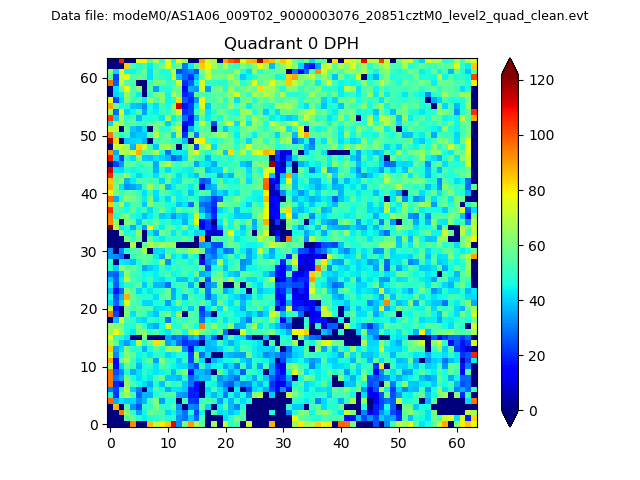 |
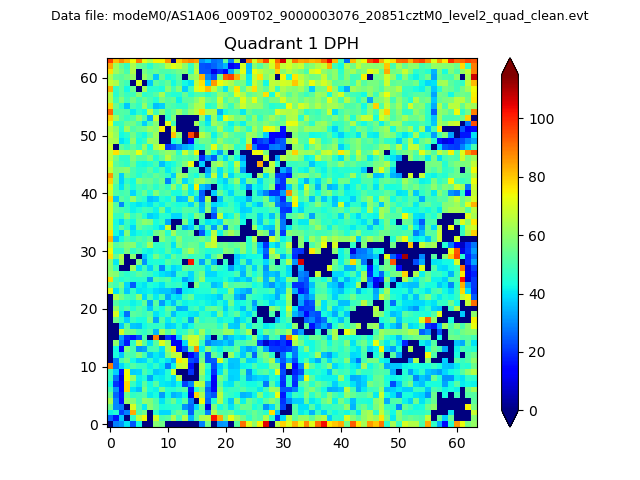 |
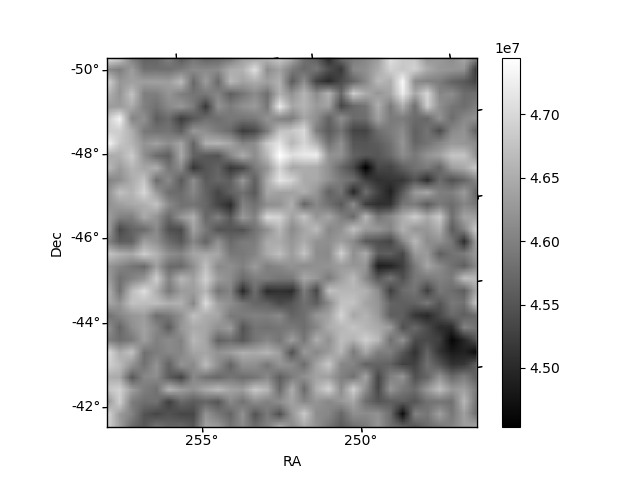
Quadrant B |
|---|---|---|---|
| Quadrant D | 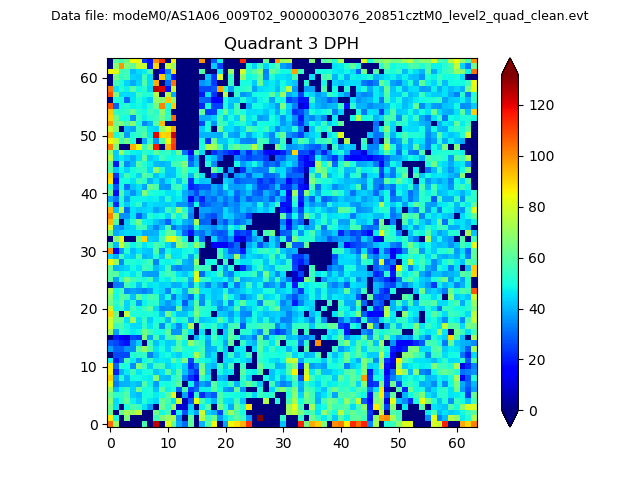 |
 |
Quadrant C |
| Plot type | Count rate plots | Images |
|---|---|---|
| Comparison with Poisson distribution Blue bars denote a histogram of data divided into 1 sec bins. Red curve is a Poisson curve with rate = median count rate of data. |
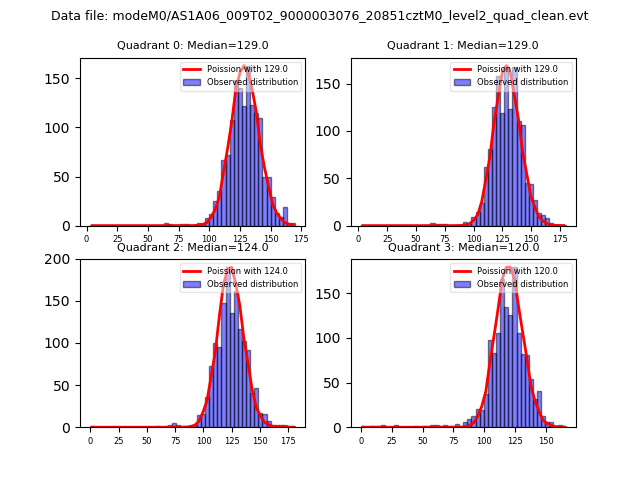 |
 |
| Quadrant-wise count rates Data is divided into 100 sec bins |
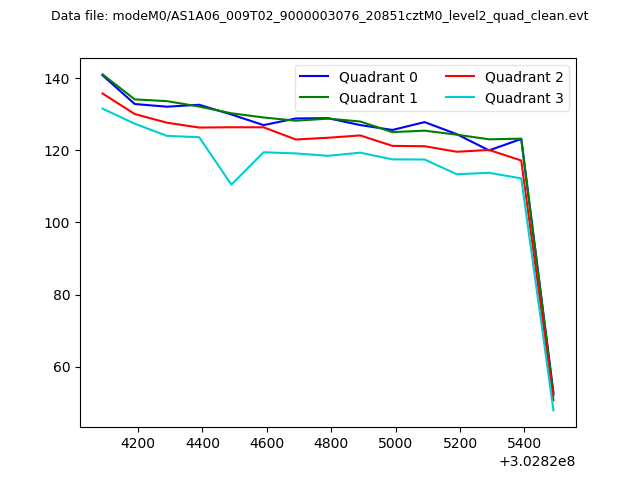 |
|
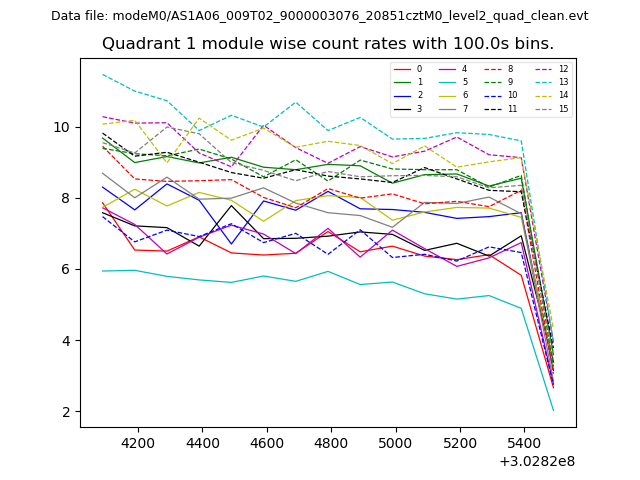
| Module-wise count rates for Quadrant A Data is divided into 100 sec bins |
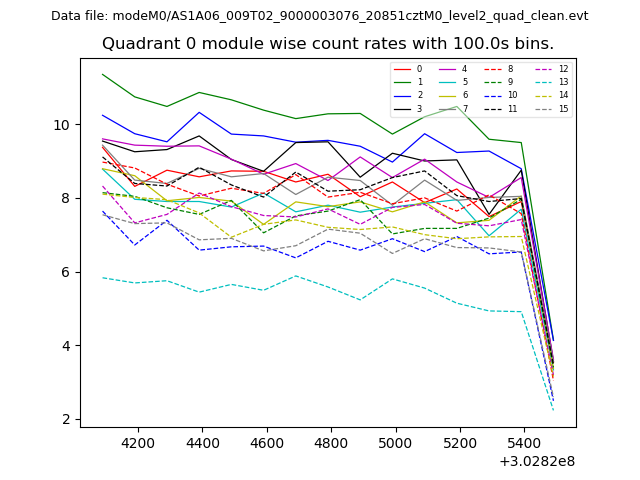 |
 |
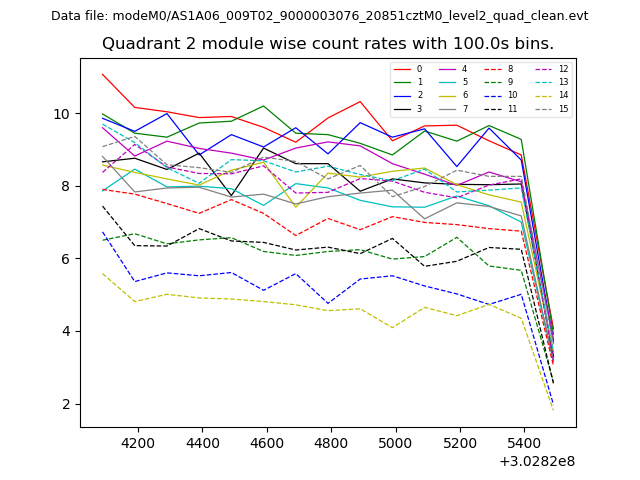
| Module-wise count rates for Quadrant B Data is divided into 100 sec bins |
 |
 |
| Module-wise count rates for Quadrant C Data is divided into 100 sec bins |
 |
 |
| Module-wise count rates for Quadrant D Data is divided into 100 sec bins |
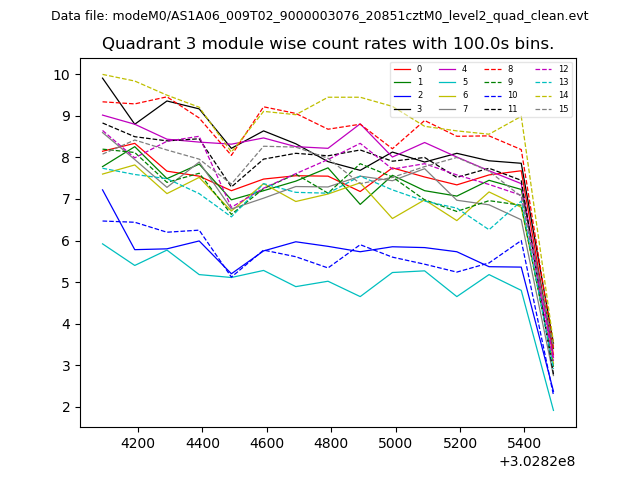 |
 |
| Parameter | Plot |
|---|---|
| CZT HV Monitor | 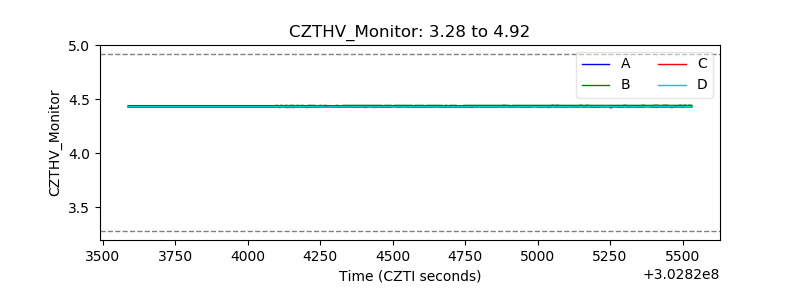 |
| D_VDD | 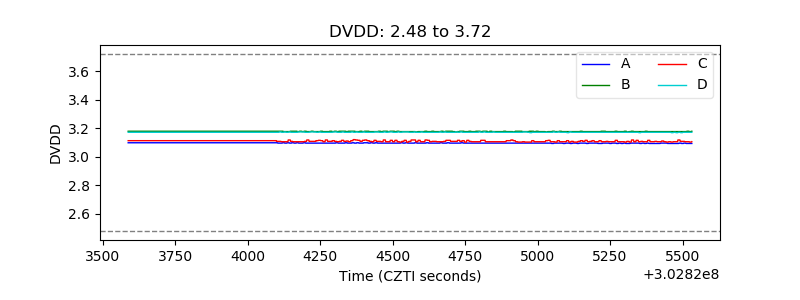 |
| Temperature 1 | 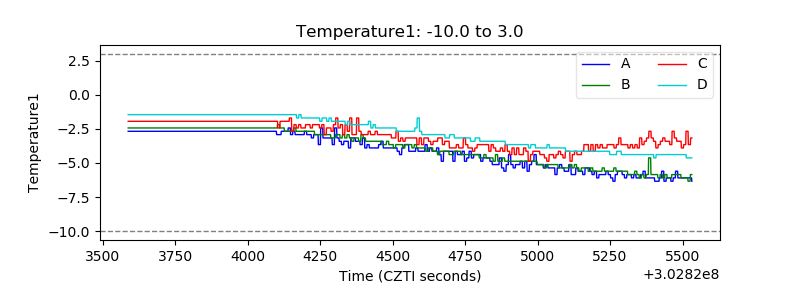 |
| Veto HV Monitor | 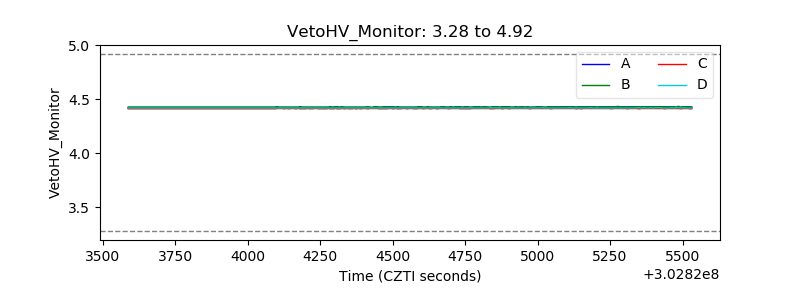 |
| Veto LLD | 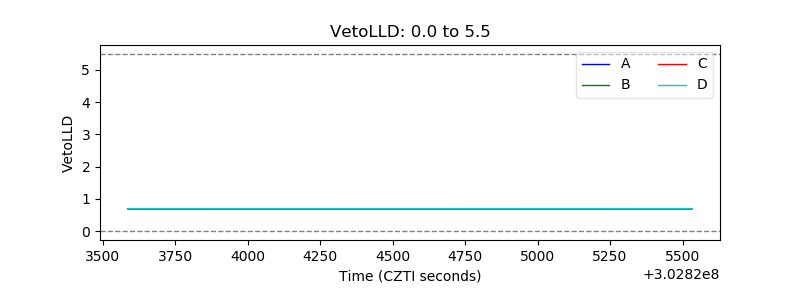 |
| Alpha Counter | 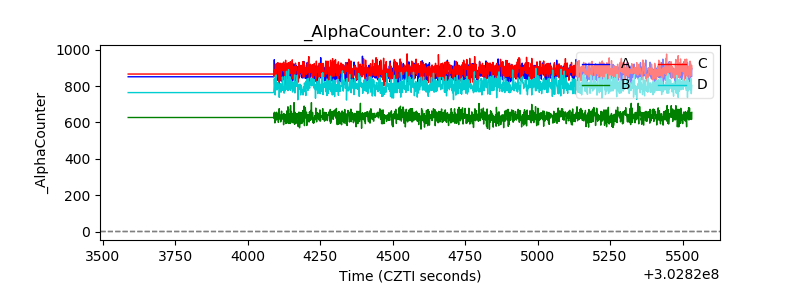 |
| _CPM_Rate | 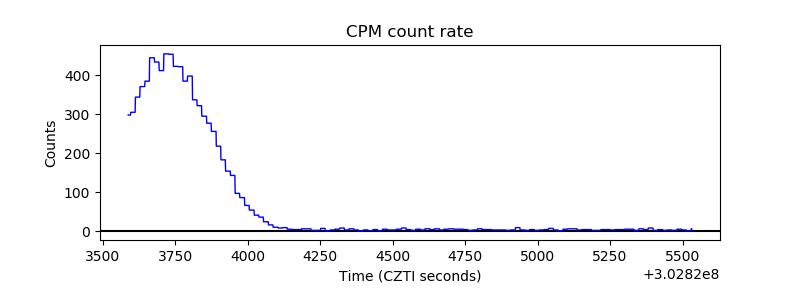 |
| CZT Counter | 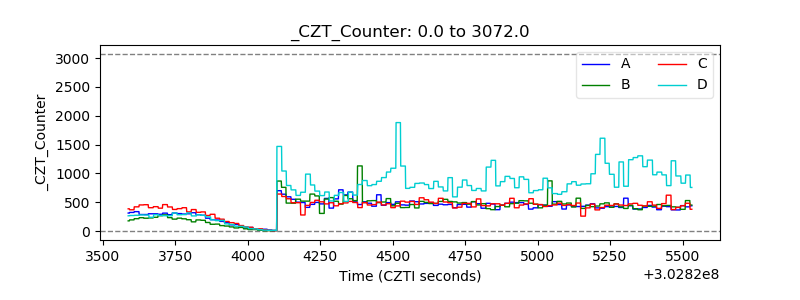 |
| +2.5 Volts monitor | 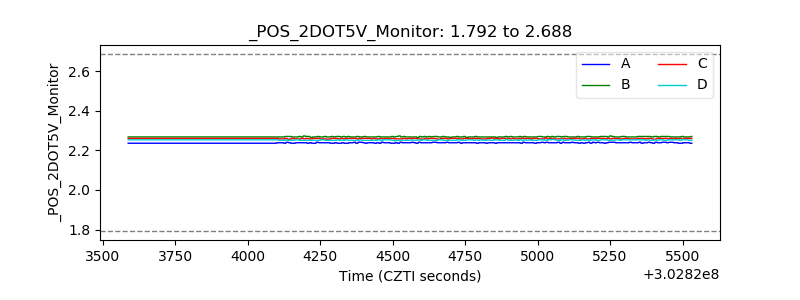 |
| +5 Volts monitor | 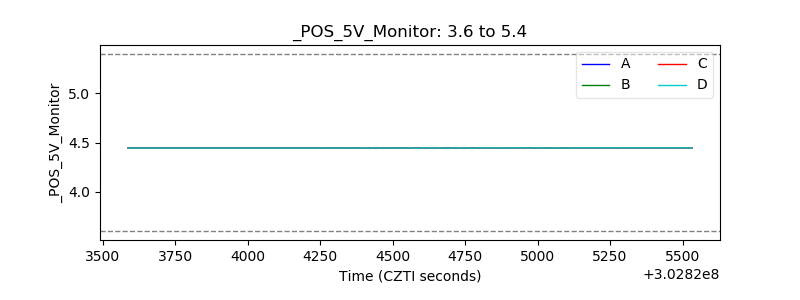 |
| _ROLL_ROT | 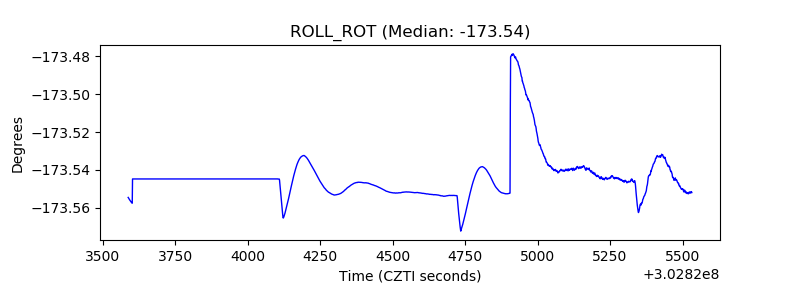 |
| _Roll_DEC | 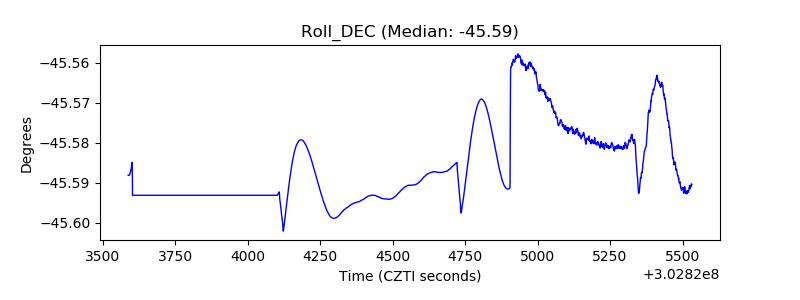 |
| _Roll_RA | 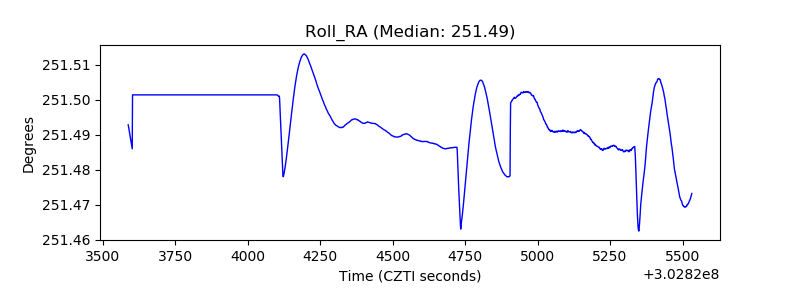 |
| Veto Counter | 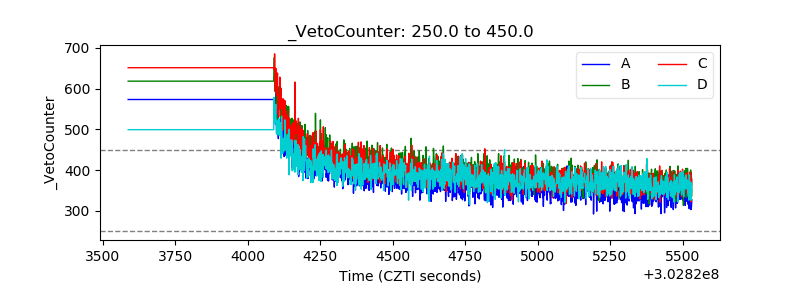 |