| Param | Original file | Final file |
|---|---|---|
| Filename | modeM0/AS1A06_009T02_9000003076_20852cztM0_level2.evt | modeM0/AS1A06_009T02_9000003076_20852cztM0_level2_quad_clean.evt |
| Size (bytes) | 678,467,520 | 94,049,280 |
| Size | 647.0 MB | 89.7 MB |
| Events in quadrant A | 3,461,842 | 615,591 |
| Events in quadrant B | 3,645,671 | 618,483 |
| Events in quadrant C | 3,207,615 | 605,563 |
| Events in quadrant D | 9,768,205 | 529,729 |
| Mode M0 | |||
|---|---|---|---|
| Quadrant | BADHDUFLAG | Total packets | Discarded packets |
| A | 0 | 14792 | 2 |
| B | 0 | 15267 | 2 |
| C | 0 | 13916 | 2 |
| D | 0 | 33812 | 5 |
| Mode M9 | |||
|---|---|---|---|
| Quadrant | BADHDUFLAG | Total packets | Discarded packets |
| A | 0 | 9 | 0 |
| B | 0 | 9 | 0 |
| C | 0 | 9 | 0 |
| D | 0 | 9 | 0 |
| Mode SS | |||
|---|---|---|---|
| Quadrant | BADHDUFLAG | Total packets | Discarded packets |
| A | 0 | 138 | 0 |
| B | 0 | 138 | 0 |
| C | 0 | 138 | 0 |
| D | 0 | 138 | 0 |
| Quadrant | Total seconds | Saturated seconds | Saturation percentage |
|---|---|---|---|
| A | 6873 | 98 | 1.425869% |
| B | 6873 | 86 | 1.251273% |
| C | 6873 | 40 | 0.581987% |
| D | 6873 | 1475 | 21.460789% |
Noise dominated data is calculated using 1-second bins in cleaned event files. If a bin has >2000 counts, and if more than 50% of those come from <1% of pixels, then it is considered to be noise-dominated and hence unusable.
| Quadrant | # 1 sec bins | Bins with >0 counts | Bins with >2000 counts | High rate bins dominated by noise | Noise dominated (total time) | Noise dominated (detector-on time) | Marked lightcurve |
|---|---|---|---|---|---|---|---|
| A | 7748 | 6873 | 70 | 70 | 0.90% | 1.02% | 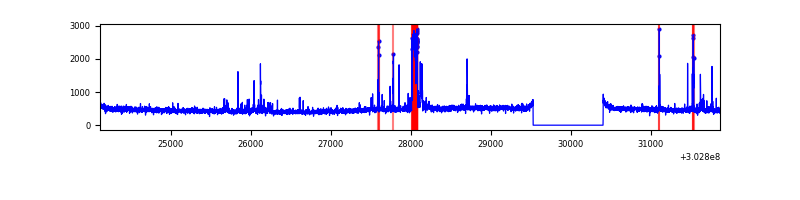 |
| B | 7748 | 6873 | 32 | 32 | 0.41% | 0.47% | 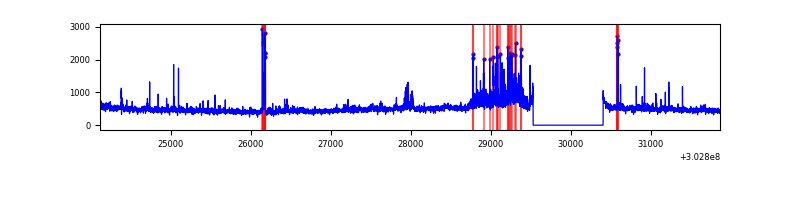 |
| C | 7747 | 6873 | 0 | 0 | 0.00% | 0.00% | 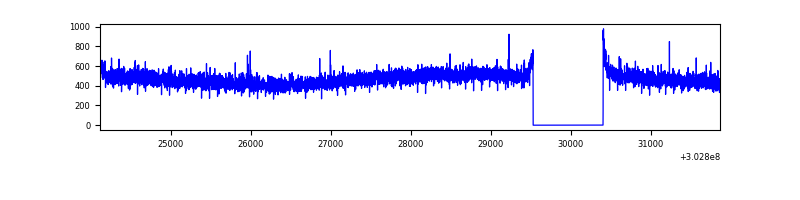 |
| D | 7748 | 6874 | 1533 | 1533 | 19.79% | 22.30% | 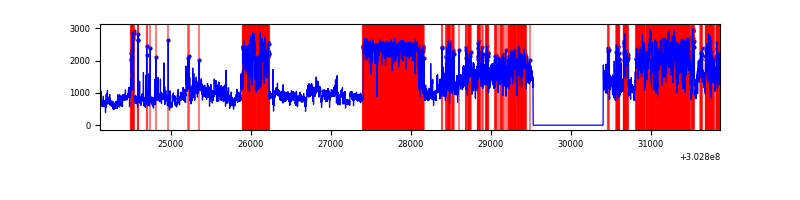 |
Top three noisy pixels from each quadrant. If the there are fewer than three noisy pixels in the level2.evt file, extra rows are filled as -1
| Pixel properties | Quadrant properties | ||||||
|---|---|---|---|---|---|---|---|
| Quadrant | DetID | PixID | Counts | Sigma | Mean | Median | Sigma |
| A | 5 | 16 | 337380 | 2041.52 | 808 | 792 | 164.9 |
| A | 5 | 98 | 15110 | 86.84 | 808 | 792 | 164.9 |
| A | 0 | 226 | 6961 | 37.42 | 808 | 792 | 164.9 |
| B | 7 | 220 | 205864 | 1314.09 | 812 | 792 | 156.1 |
| B | 0 | 189 | 62358 | 394.51 | 812 | 792 | 156.1 |
| B | 0 | 230 | 43094 | 271.07 | 812 | 792 | 156.1 |
| C | 14 | 238 | 120703 | 655.08 | 778 | 783 | 183.1 |
| C | 3 | 233 | 21569 | 113.55 | 778 | 783 | 183.1 |
| C | 7 | 247 | 12074 | 61.68 | 778 | 783 | 183.1 |
| D | 1 | 239 | 2386199 | 13795.77 | 708 | 686 | 172.9 |
| D | 1 | 52 | 2039650 | 11791.63 | 708 | 686 | 172.9 |
| D | 1 | 20 | 1708081 | 9874.12 | 708 | 686 | 172.9 |
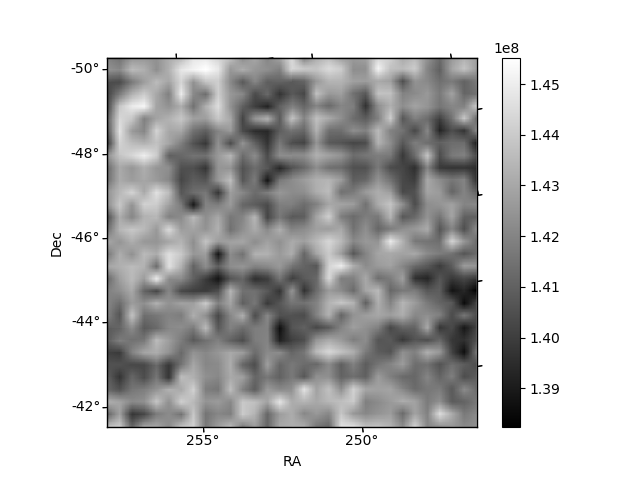
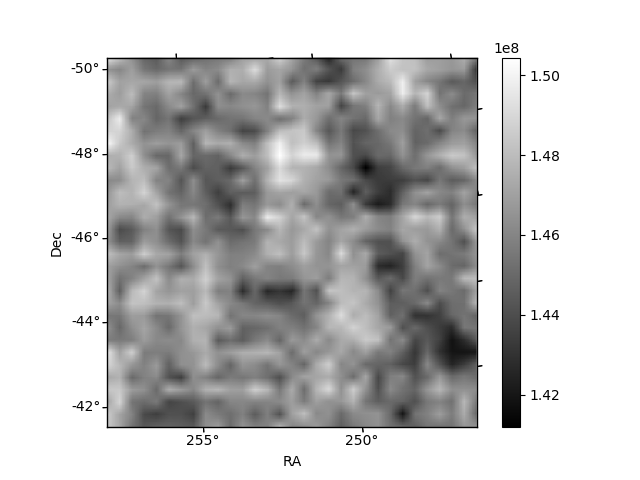
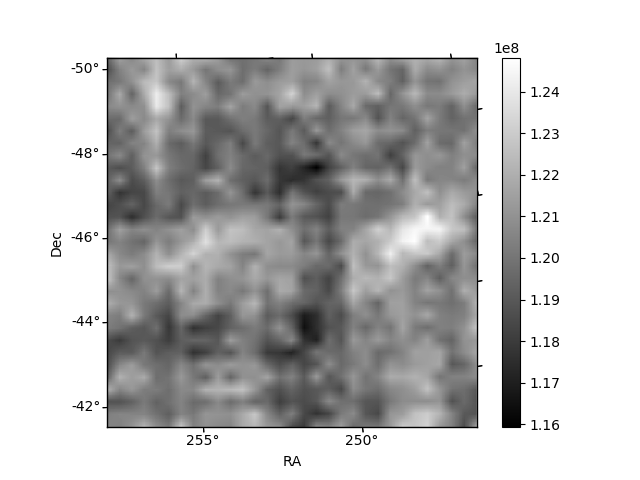
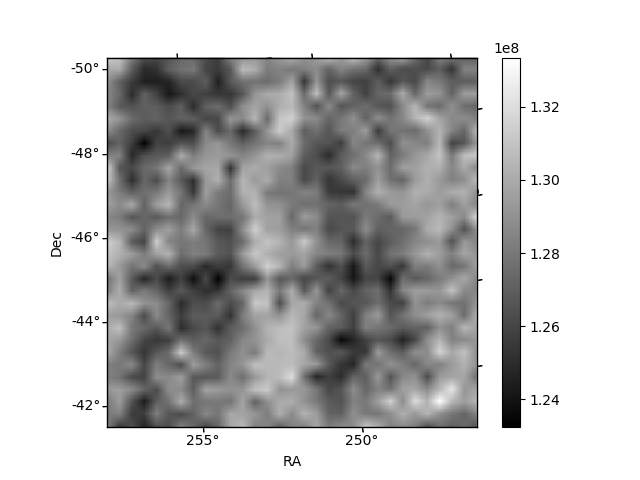
Histogram calculated using DETX and DETY for each event in the final _common_clean file
| Quadrant A | 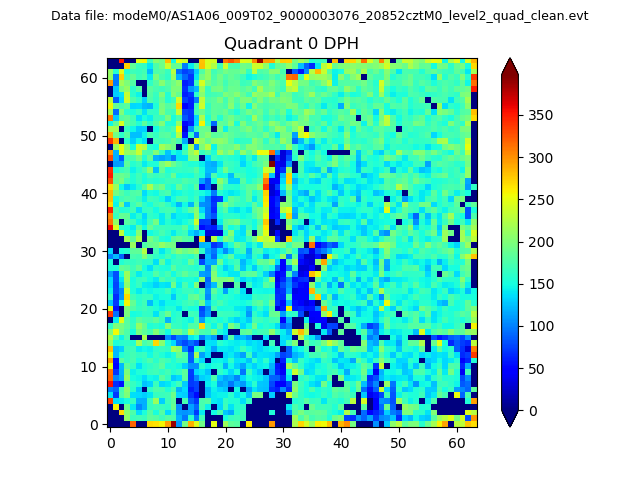 |
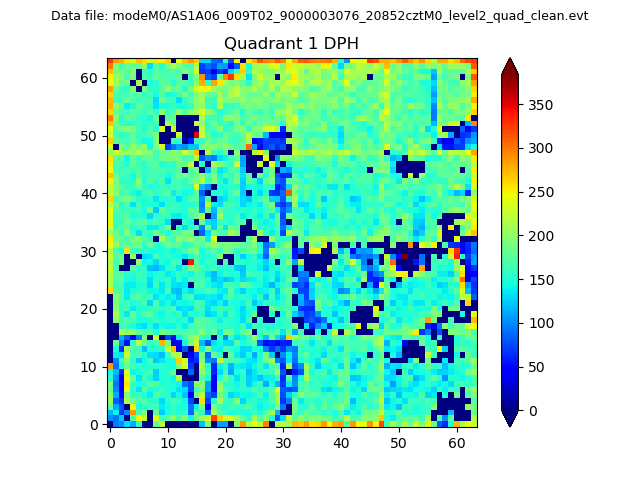 |
Quadrant B |
|---|---|---|---|
| Quadrant D |  |
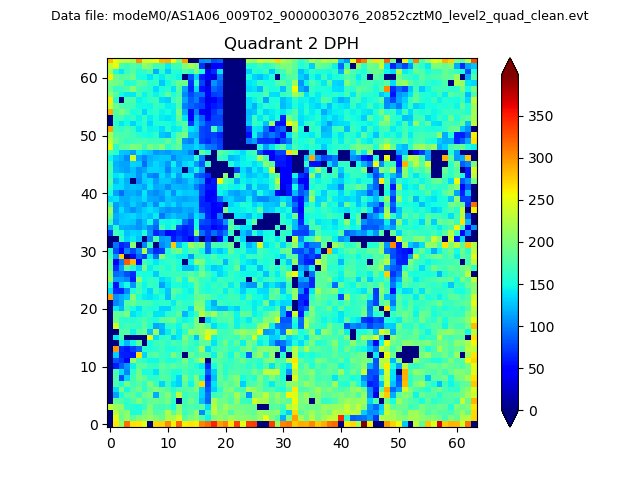 |
Quadrant C |
| Plot type | Count rate plots | Images |
|---|---|---|
| Comparison with Poisson distribution Blue bars denote a histogram of data divided into 1 sec bins. Red curve is a Poisson curve with rate = median count rate of data. |
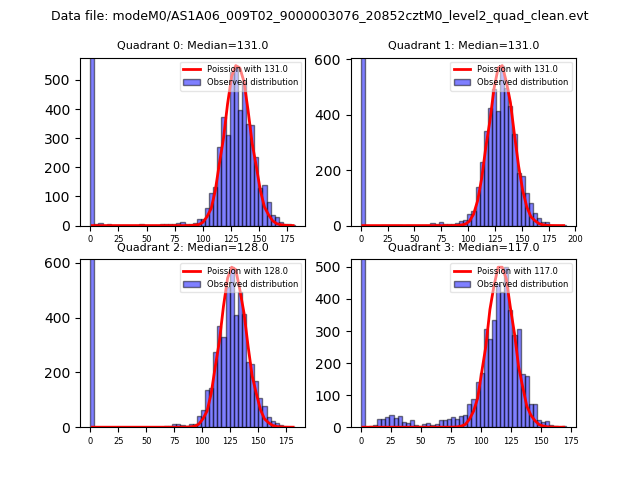 |
 |
| Quadrant-wise count rates Data is divided into 100 sec bins |
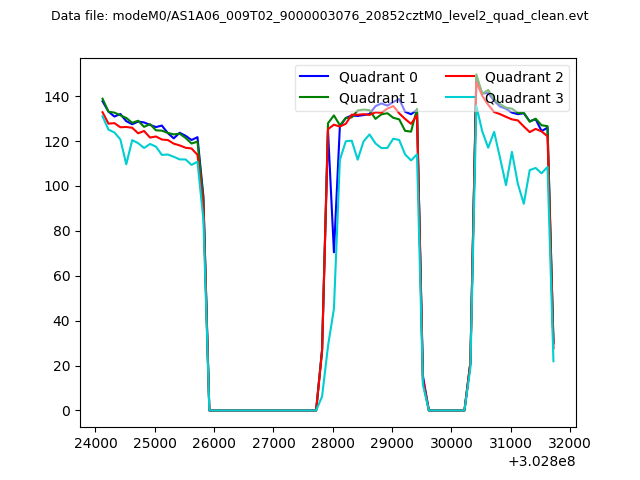 |
|
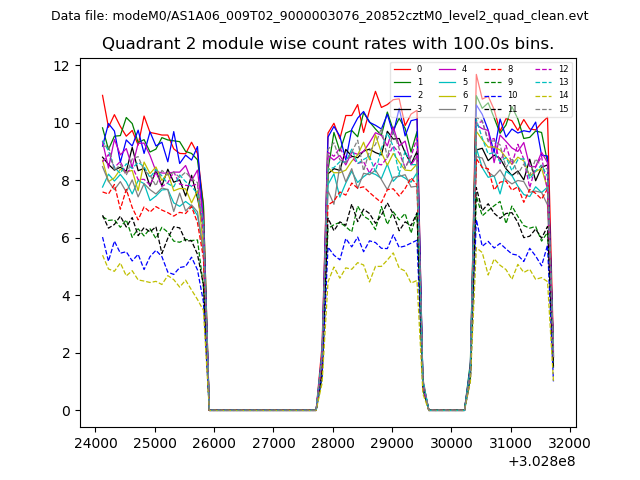
| Module-wise count rates for Quadrant A Data is divided into 100 sec bins |
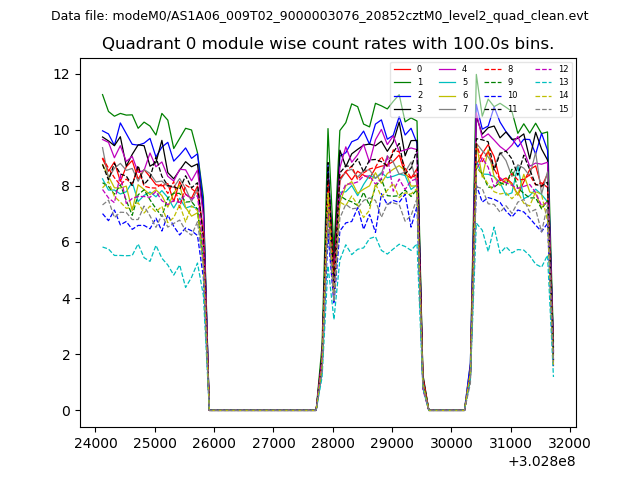 |
 |
| Module-wise count rates for Quadrant B Data is divided into 100 sec bins |
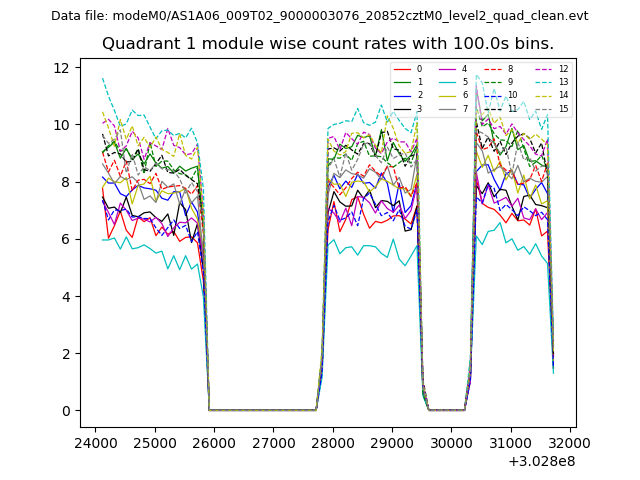 |
 |
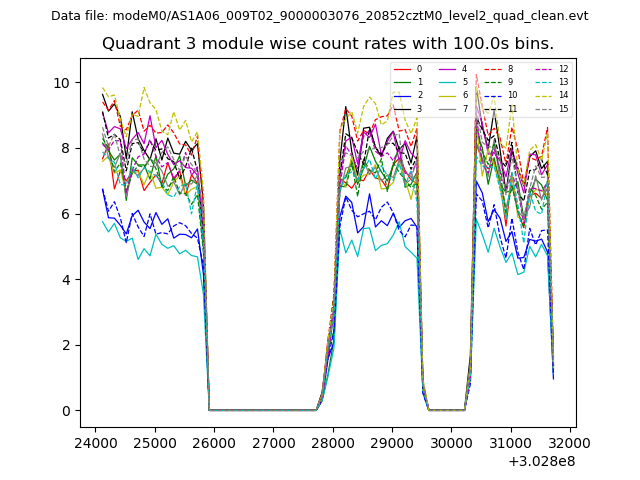
| Module-wise count rates for Quadrant C Data is divided into 100 sec bins |
 |
 |
| Module-wise count rates for Quadrant D Data is divided into 100 sec bins |
 |
 |
| Parameter | Plot |
|---|---|
| CZT HV Monitor | 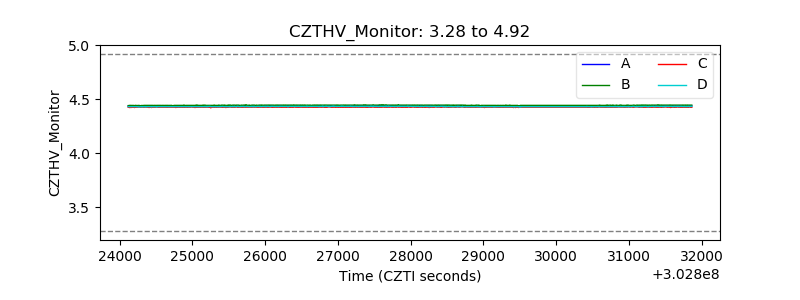 |
| D_VDD | 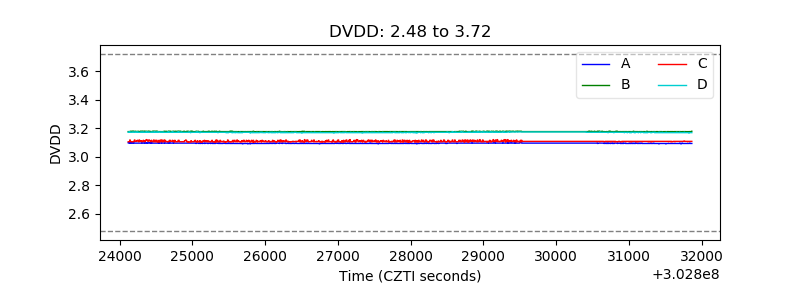 |
| Temperature 1 | 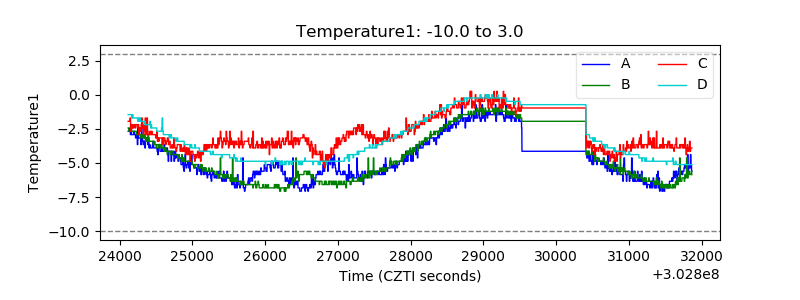 |
| Veto HV Monitor |  |
| Veto LLD | 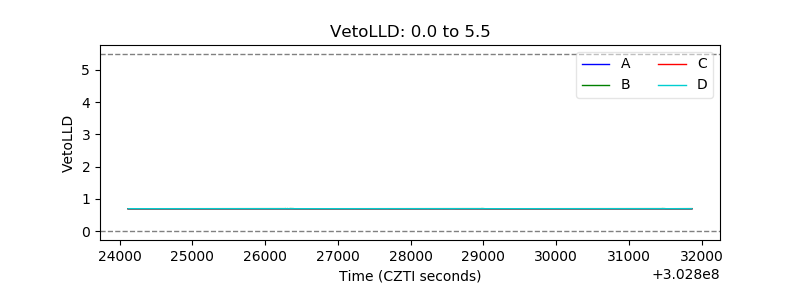 |
| Alpha Counter | 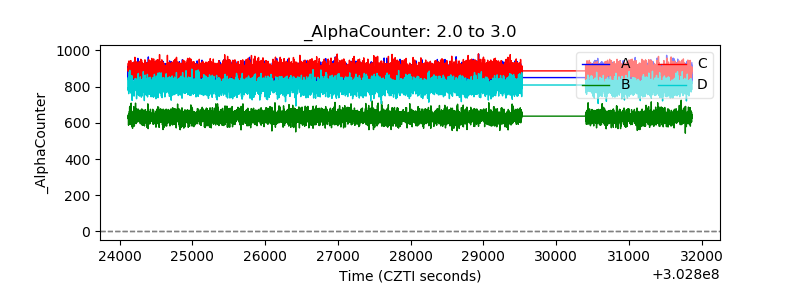 |
| _CPM_Rate | 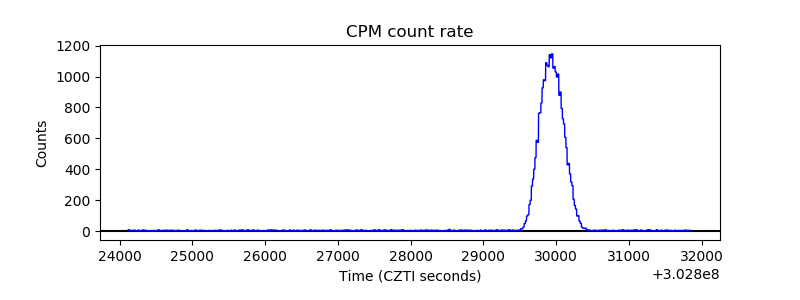 |
| CZT Counter |  |
| +2.5 Volts monitor |  |
| +5 Volts monitor | 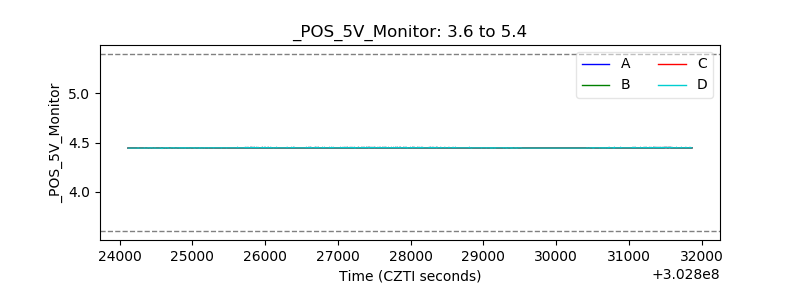 |
| _ROLL_ROT | 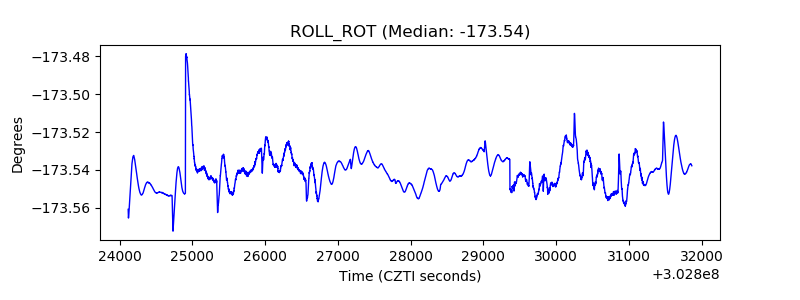 |
| _Roll_DEC | 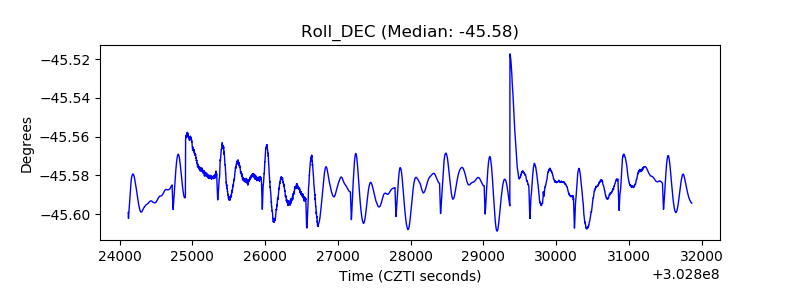 |
| _Roll_RA | 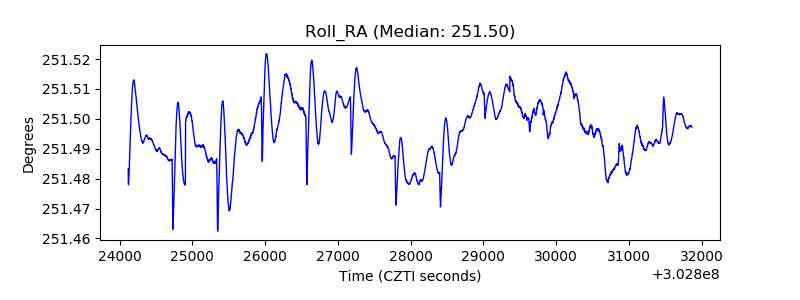 |
| Veto Counter | 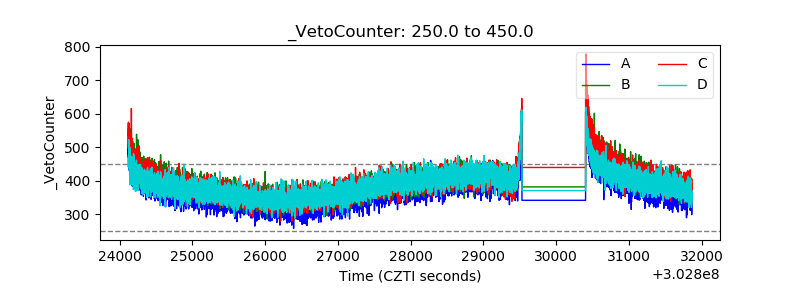 |