| Param | Original file | Final file |
|---|---|---|
| Filename | modeM0/AS1C04_001T01_9000003074cztM0_level2.fits | modeM0/AS1C04_001T01_9000003074cztM0_level2_quad_clean.evt |
| Size (bytes) | 621,276,480 | 647,959,680 |
| Size | 592.5 MB | 617.9 MB |
| Events in quadrant A | 3,929,804 | 4,200,348 |
| Events in quadrant B | 3,674,126 | 4,026,062 |
| Events in quadrant C | 3,734,254 | 3,851,408 |
| Events in quadrant D | 3,106,168 | 3,178,173 |
| Mode M0 | |||
|---|---|---|---|
| Quadrant | BADHDUFLAG | Total packets | Discarded packets |
| A | 0 | 133604 | 0 |
| B | 0 | 146755 | 0 |
| C | 0 | 132132 | 0 |
| D | 0 | 230334 | 0 |
| Mode M9 | |||
|---|---|---|---|
| Quadrant | BADHDUFLAG | Total packets | Discarded packets |
| A | 0 | 99 | 0 |
| B | 0 | 99 | 0 |
| C | 0 | 99 | 0 |
| D | 0 | 99 | 0 |
| Mode SS | |||
|---|---|---|---|
| Quadrant | BADHDUFLAG | Total packets | Discarded packets |
| A | 0 | 1292 | 0 |
| B | 0 | 1290 | 0 |
| C | 0 | 1292 | 0 |
| D | 0 | 1292 | 0 |
| Quadrant | Total seconds | Saturated seconds | Saturation percentage |
|---|---|---|---|
| A | 63686 | 672 | 1.055177% |
| B | 63684 | 1382 | 2.170090% |
| C | 63685 | 997 | 1.565518% |
| D | 63685 | 9005 | 14.139907% |
Noise dominated data is calculated using 1-second bins in cleaned event files. If a bin has >2000 counts, and if more than 50% of those come from <1% of pixels, then it is considered to be noise-dominated and hence unusable.
| Quadrant | # 1 sec bins | Bins with >0 counts | Bins with >2000 counts | High rate bins dominated by noise | Noise dominated (total time) | Noise dominated (detector-on time) | Marked lightcurve |
|---|---|---|---|---|---|---|---|
| A | 73449 | 63676 | 0 | 0 | 0.00% | 0.00% | 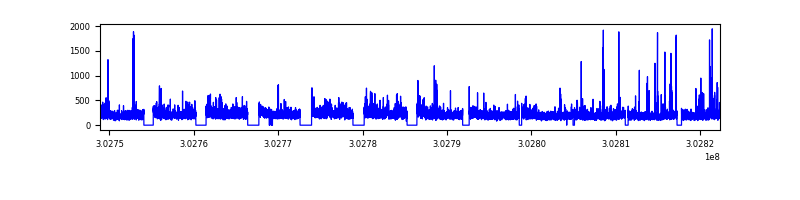 |
| B | 73449 | 63673 | 0 | 0 | 0.00% | 0.00% | 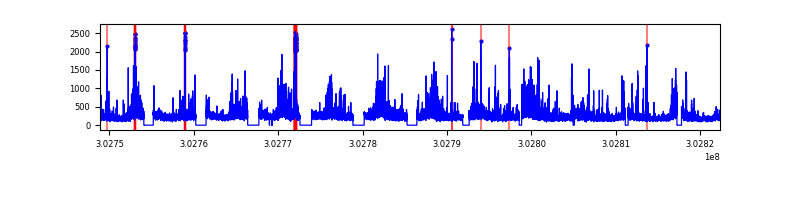 |
| C | 73449 | 63676 | 0 | 0 | 0.00% | 0.00% | 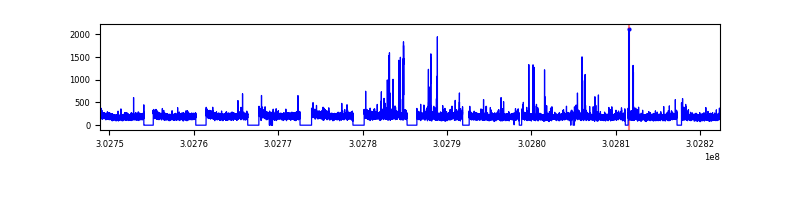 |
| D | 73449 | 63022 | 0 | 0 | 0.00% | 0.00% | 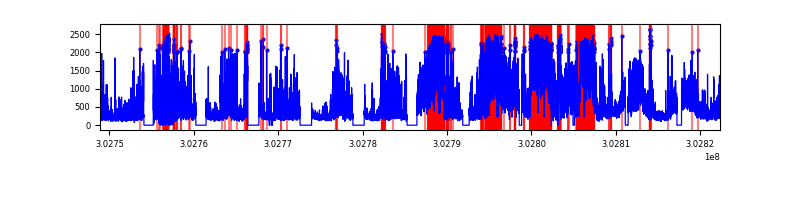 |
Top three noisy pixels from each quadrant. If the there are fewer than three noisy pixels in the level2.evt file, extra rows are filled as -1
| Pixel properties | Quadrant properties | ||||||
|---|---|---|---|---|---|---|---|
| Quadrant | DetID | PixID | Counts | Sigma | Mean | Median | Sigma |
| A | 0 | 29 | 3817 | 11.39 | 1024 | 968 | 250.1 |
| A | 7 | 110 | 3242 | 9.09 | 1024 | 968 | 250.1 |
| A | 0 | 30 | 3034 | 8.26 | 1024 | 968 | 250.1 |
| B | 2 | 9 | 2898 | 10.21 | 974 | 934 | 192.3 |
| B | 2 | 8 | 2503 | 8.16 | 974 | 934 | 192.3 |
| B | 3 | 17 | 2491 | 8.1 | 974 | 934 | 192.3 |
| C | 12 | 241 | 2615 | 6.76 | 985 | 924 | 250.2 |
| C | 12 | 250 | 2530 | 6.42 | 985 | 924 | 250.2 |
| C | 3 | 126 | 2518 | 6.37 | 985 | 924 | 250.2 |
| D | 3 | 14 | 2229 | 5.97 | 888 | 811 | 237.6 |
| D | 10 | 189 | 2228 | 5.96 | 888 | 811 | 237.6 |
| D | 7 | 3 | 2213 | 5.9 | 888 | 811 | 237.6 |
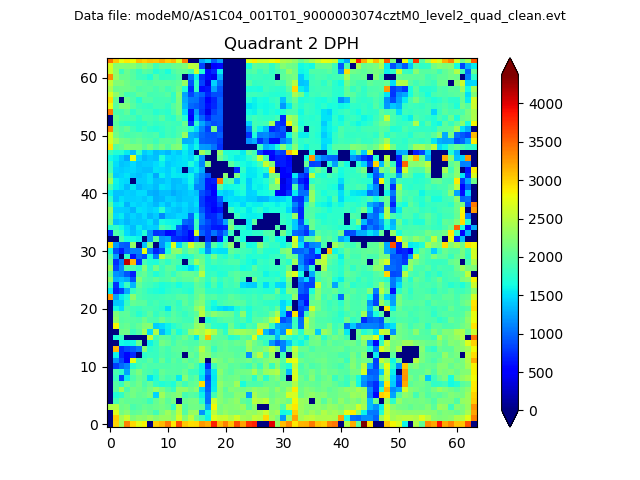
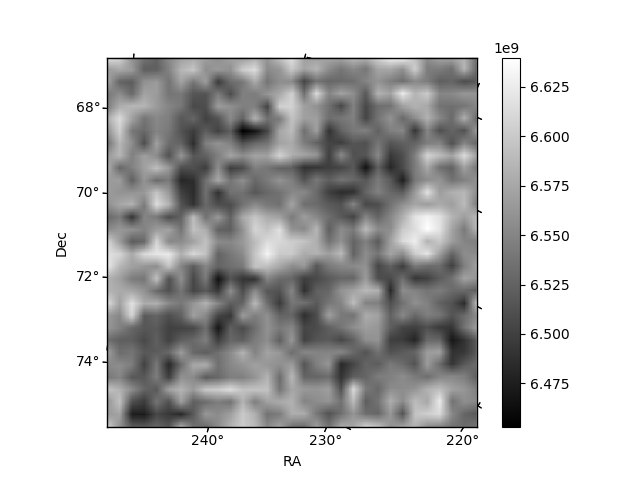
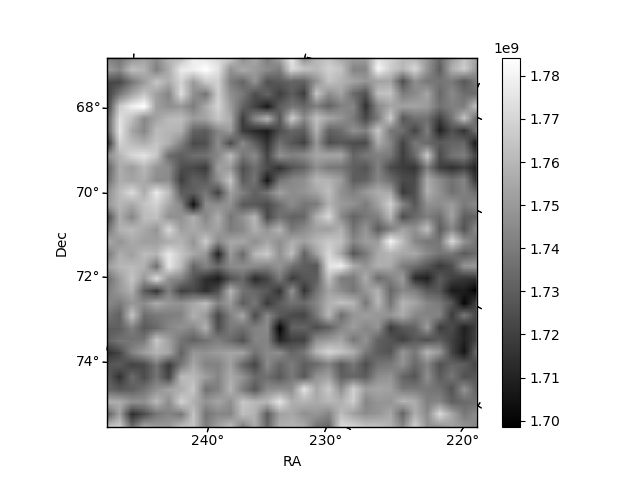
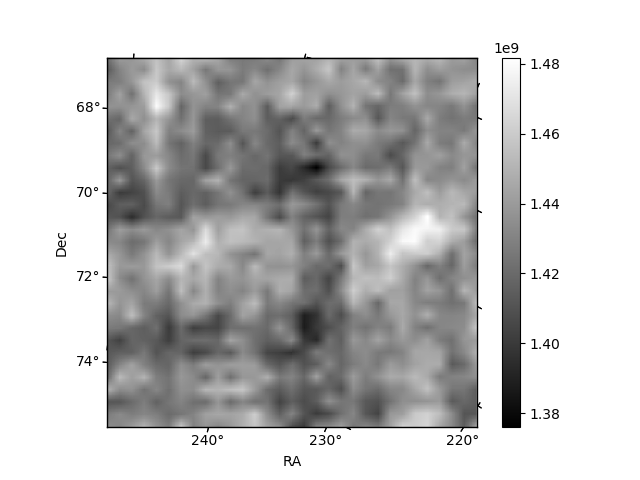
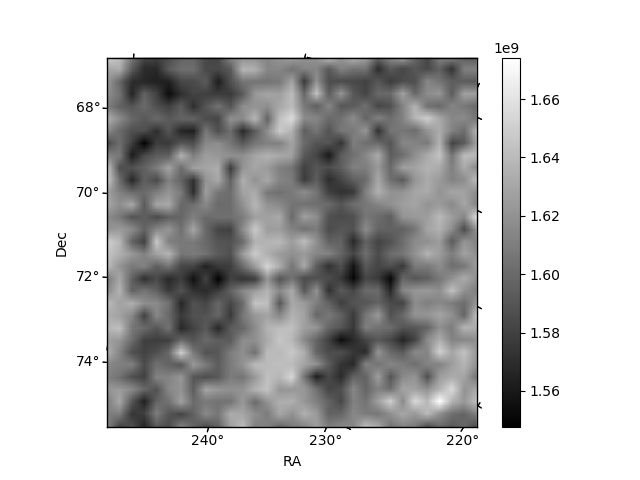
Histogram calculated using DETX and DETY for each event in the final _common_clean file
| Quadrant A | 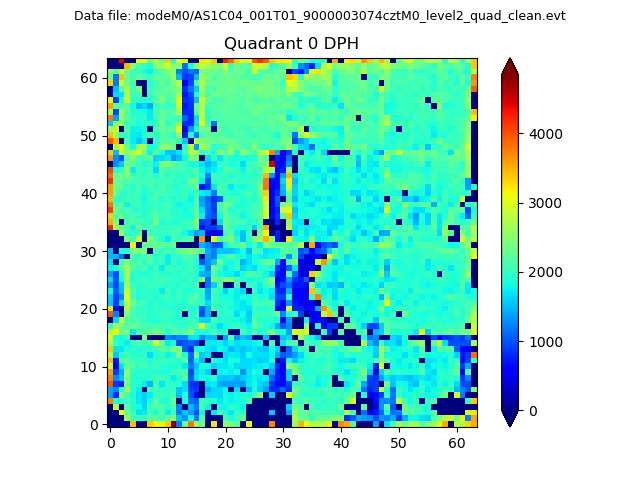 |
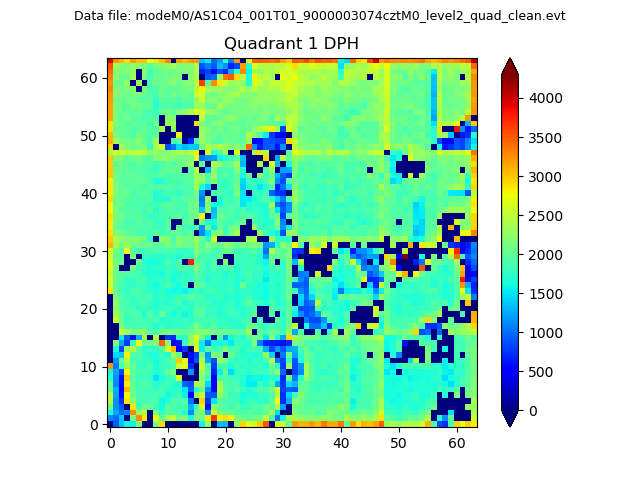 |
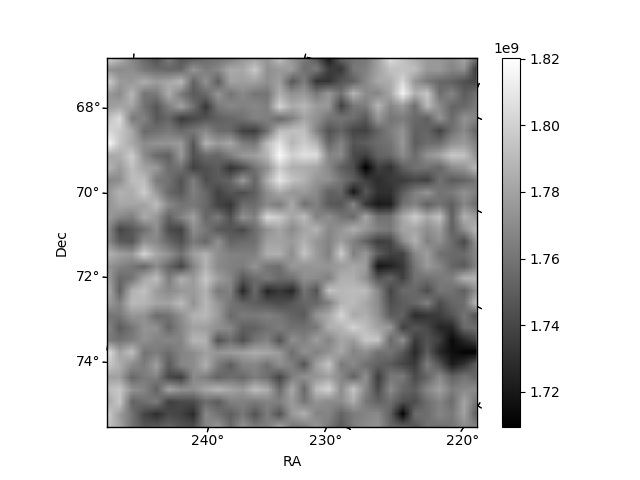
Quadrant B |
|---|---|---|---|
| Quadrant D | 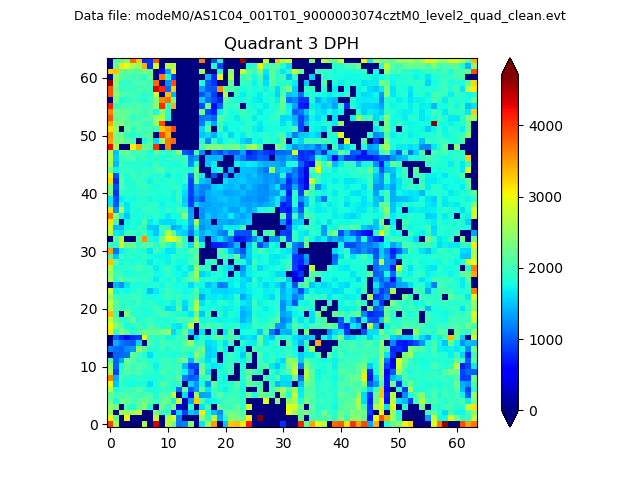 |
 |
Quadrant C |
| Plot type | Count rate plots | Images |
|---|---|---|
| Comparison with Poisson distribution Blue bars denote a histogram of data divided into 1 sec bins. Red curve is a Poisson curve with rate = median count rate of data. |
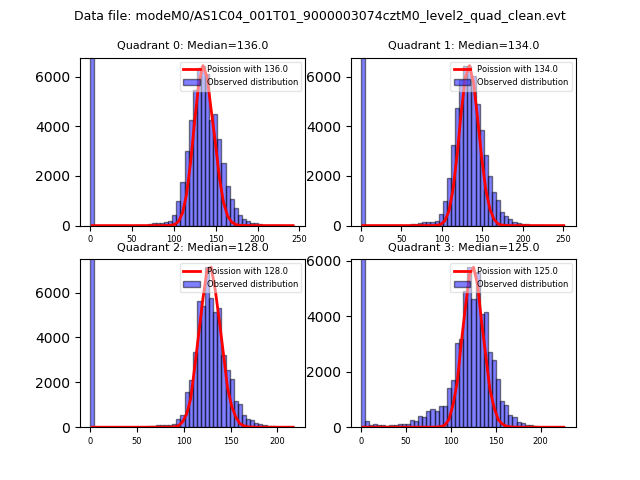 |
 |
| Quadrant-wise count rates Data is divided into 100 sec bins |
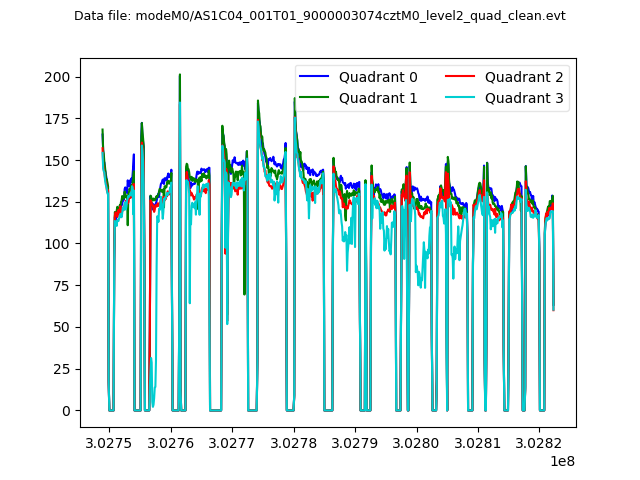 |
|
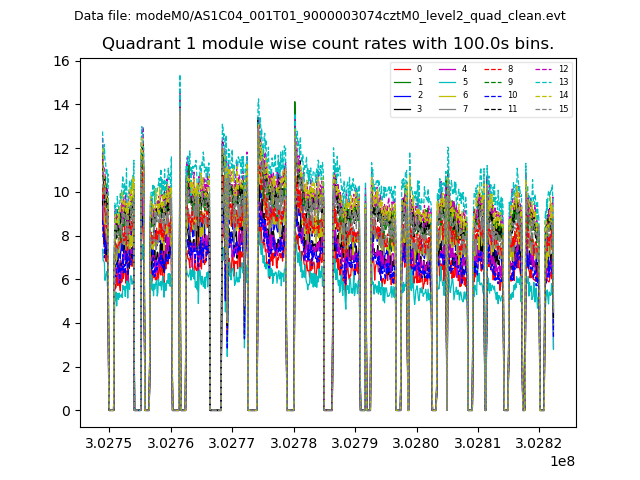
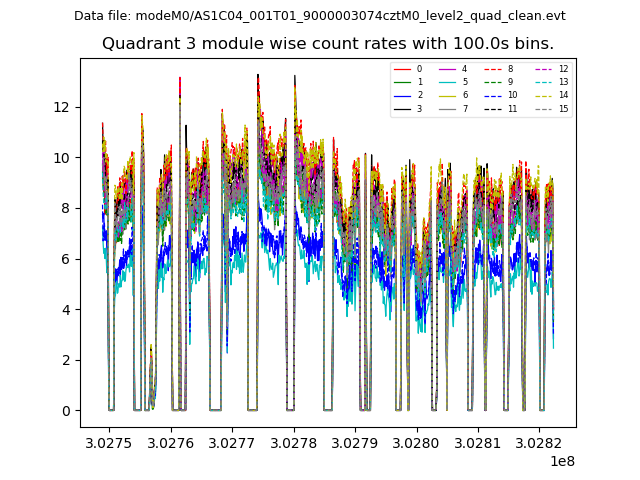
| Module-wise count rates for Quadrant A Data is divided into 100 sec bins |
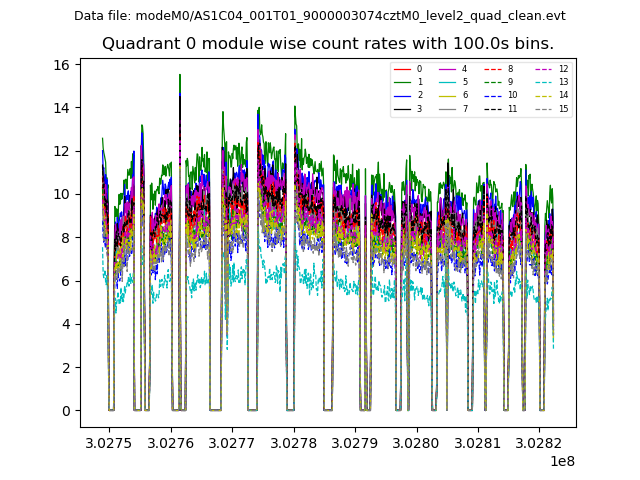 |
 |
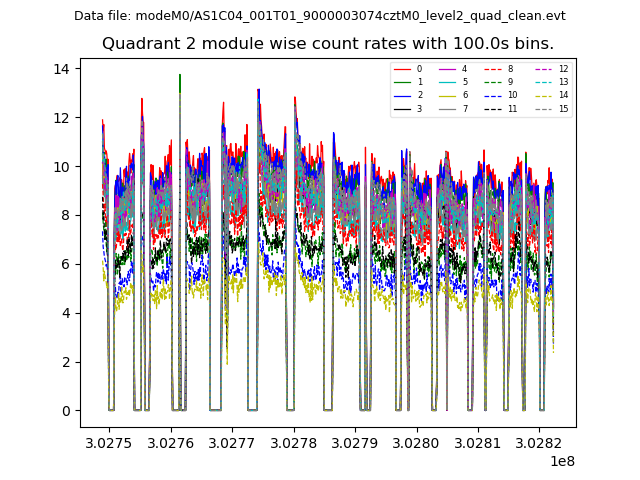
| Module-wise count rates for Quadrant B Data is divided into 100 sec bins |
 |
 |
| Module-wise count rates for Quadrant C Data is divided into 100 sec bins |
 |
 |
| Module-wise count rates for Quadrant D Data is divided into 100 sec bins |
 |
 |
| Parameter | Plot |
|---|---|
| CZT HV Monitor | 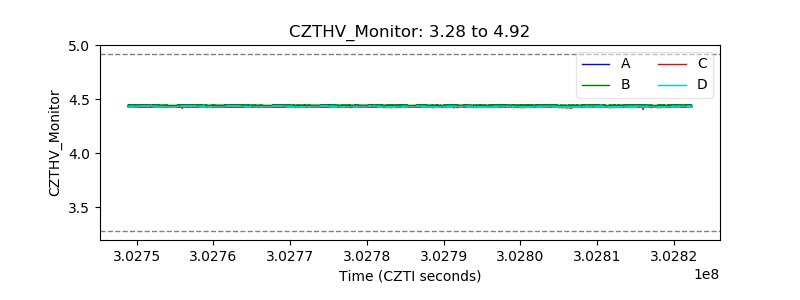 |
| D_VDD | 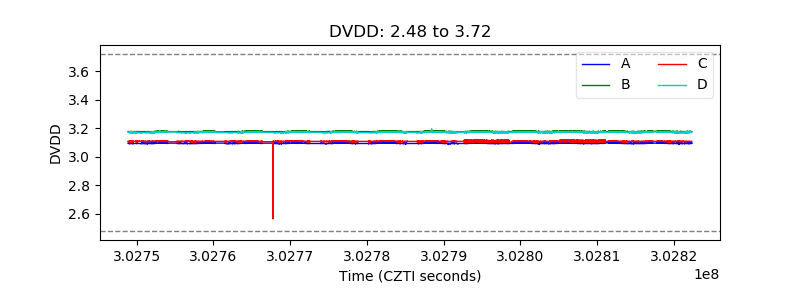 |
| Temperature 1 | 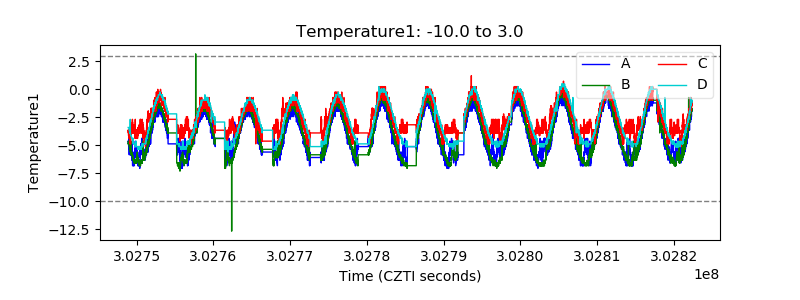 |
| Veto HV Monitor | 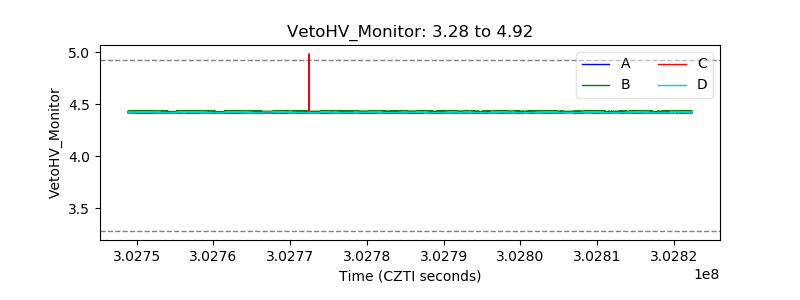 |
| Veto LLD | 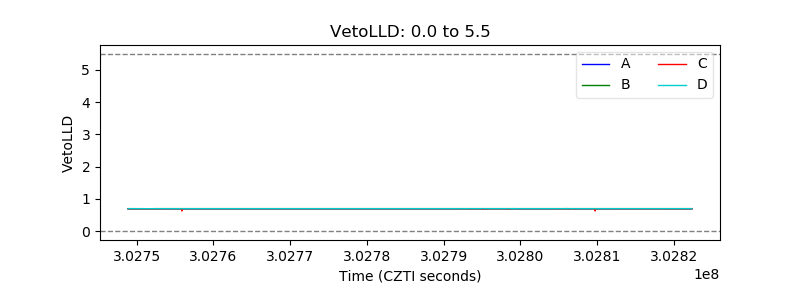 |
| Alpha Counter | 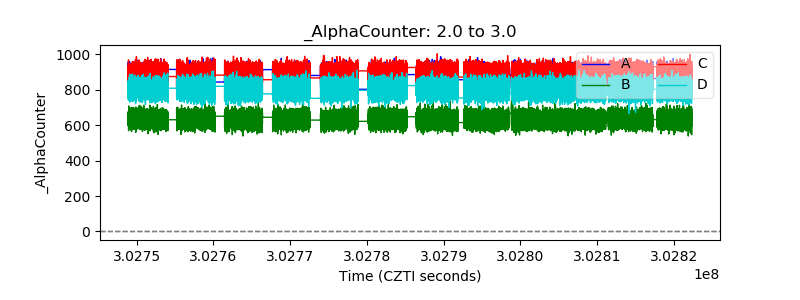 |
| _CPM_Rate | 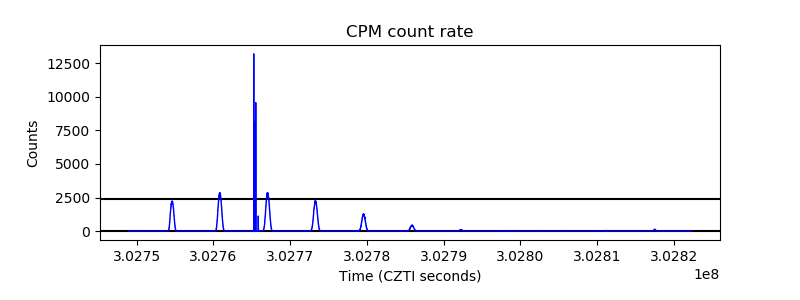 |
| CZT Counter | 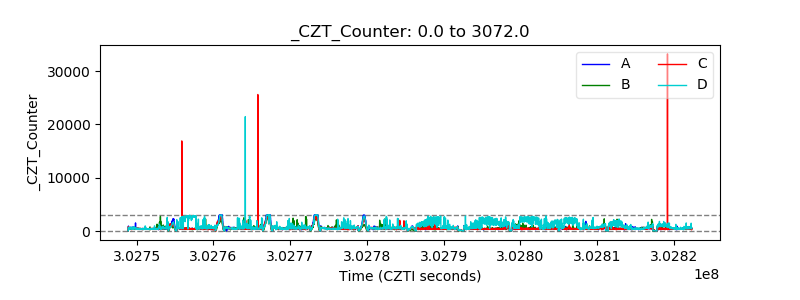 |
| +2.5 Volts monitor | 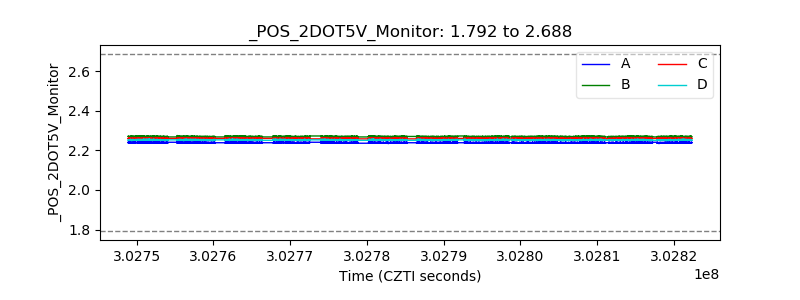 |
| +5 Volts monitor | 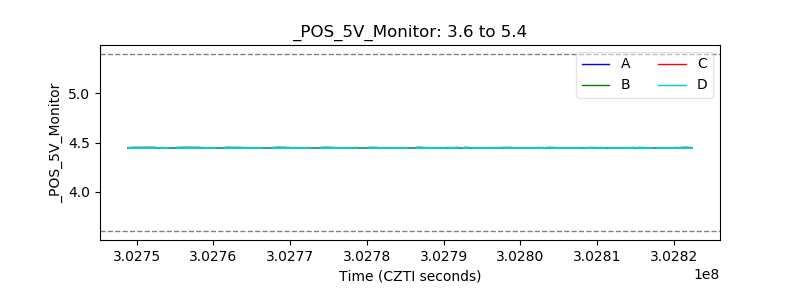 |
| _ROLL_ROT | 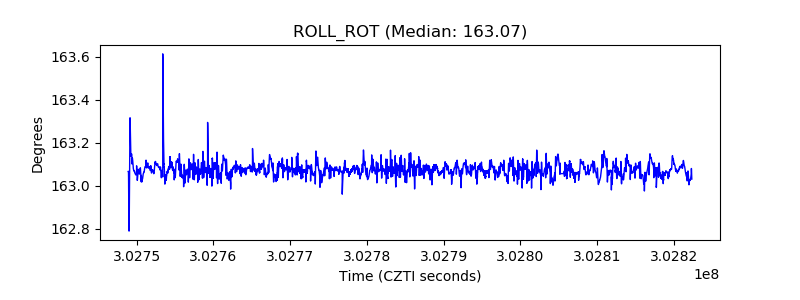 |
| _Roll_DEC | 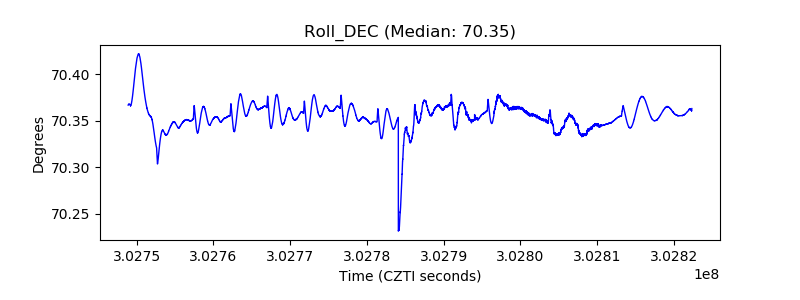 |
| _Roll_RA | 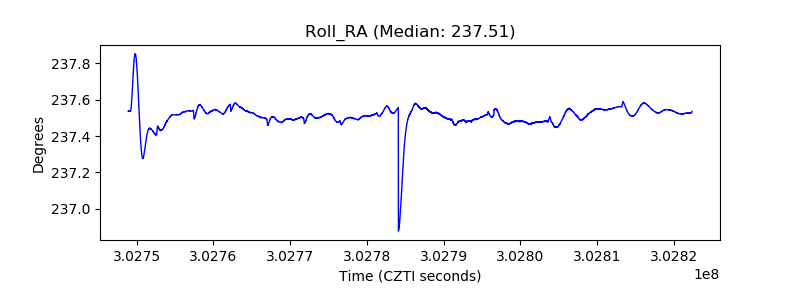 |
| Veto Counter | 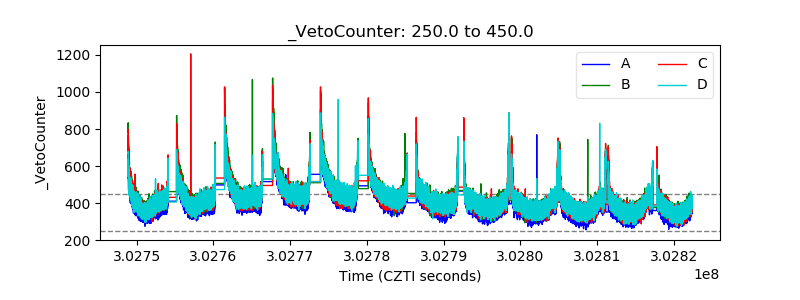 |