| Param | Original file | Final file |
|---|---|---|
| Filename | modeM0/AS1C04_001T01_9000003074_20838cztM0_level2.evt | modeM0/AS1C04_001T01_9000003074_20838cztM0_level2_quad_clean.evt |
| Size (bytes) | 108,901,440 | 22,930,560 |
| Size | 103.9 MB | 21.9 MB |
| Events in quadrant A | 806,823 | 146,658 |
| Events in quadrant B | 810,130 | 148,771 |
| Events in quadrant C | 779,628 | 141,953 |
| Events in quadrant D | 792,271 | 140,935 |
| Mode M0 | |||
|---|---|---|---|
| Quadrant | BADHDUFLAG | Total packets | Discarded packets |
| A | 0 | 3395 | 1 |
| B | 0 | 3381 | 1 |
| C | 0 | 3252 | 1 |
| D | 0 | 3369 | 2 |
| Mode M9 | |||
|---|---|---|---|
| Quadrant | BADHDUFLAG | Total packets | Discarded packets |
| A | 0 | 1 | 0 |
| B | 0 | 1 | 0 |
| C | 0 | 1 | 0 |
| D | 0 | 1 | 0 |
| Mode SS | |||
|---|---|---|---|
| Quadrant | BADHDUFLAG | Total packets | Discarded packets |
| A | 0 | 30 | 0 |
| B | 0 | 30 | 0 |
| C | 0 | 30 | 0 |
| D | 0 | 30 | 0 |
| Quadrant | Total seconds | Saturated seconds | Saturation percentage |
|---|---|---|---|
| A | 1569 | 3 | 0.191205% |
| B | 1569 | 10 | 0.637349% |
| C | 1569 | 13 | 0.828553% |
| D | 1568 | 8 | 0.510204% |
Noise dominated data is calculated using 1-second bins in cleaned event files. If a bin has >2000 counts, and if more than 50% of those come from <1% of pixels, then it is considered to be noise-dominated and hence unusable.
| Quadrant | # 1 sec bins | Bins with >0 counts | Bins with >2000 counts | High rate bins dominated by noise | Noise dominated (total time) | Noise dominated (detector-on time) | Marked lightcurve |
|---|---|---|---|---|---|---|---|
| A | 1569 | 1569 | 0 | 0 | 0.00% | 0.00% | 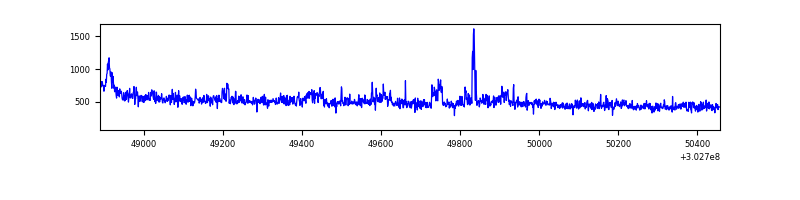 |
| B | 1569 | 1569 | 2 | 2 | 0.13% | 0.13% | 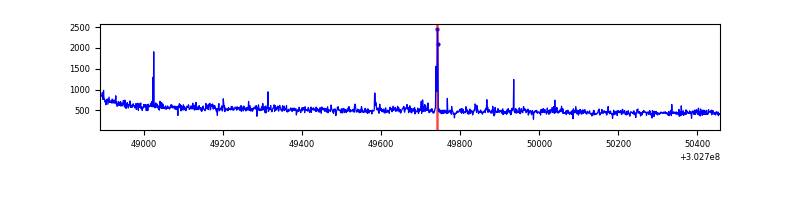 |
| C | 1569 | 1569 | 0 | 0 | 0.00% | 0.00% | 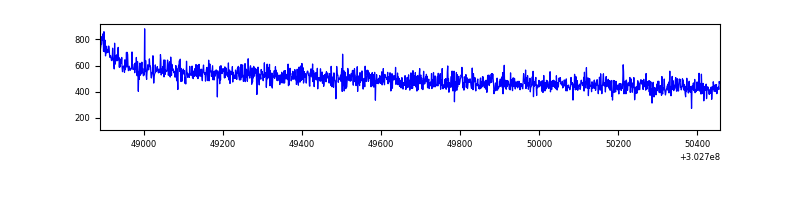 |
| D | 1568 | 1568 | 3 | 3 | 0.19% | 0.19% | 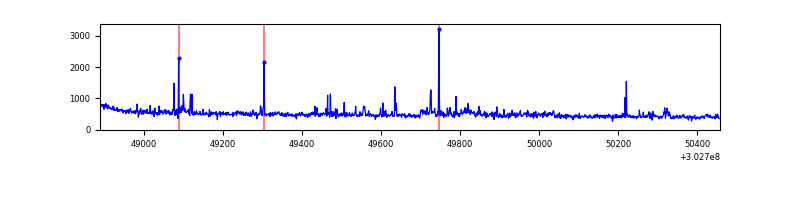 |
Top three noisy pixels from each quadrant. If the there are fewer than three noisy pixels in the level2.evt file, extra rows are filled as -1
| Pixel properties | Quadrant properties | ||||||
|---|---|---|---|---|---|---|---|
| Quadrant | DetID | PixID | Counts | Sigma | Mean | Median | Sigma |
| A | 2 | 79 | 28255 | 687.86 | 195 | 191 | 40.8 |
| A | 5 | 16 | 21203 | 515.01 | 195 | 191 | 40.8 |
| A | 6 | 16 | 3906 | 91.06 | 195 | 191 | 40.8 |
| B | 3 | 64 | 10281 | 253.89 | 199 | 194 | 39.7 |
| B | 0 | 189 | 9282 | 228.75 | 199 | 194 | 39.7 |
| B | 12 | 111 | 4466 | 107.53 | 199 | 194 | 39.7 |
| C | 14 | 238 | 29854 | 642.79 | 192 | 193 | 46.1 |
| C | 13 | 61 | 1317 | 24.36 | 192 | 193 | 46.1 |
| C | 9 | 54 | 729 | 11.62 | 192 | 193 | 46.1 |
| D | 1 | 52 | 30771 | 643.49 | 190 | 185 | 47.5 |
| D | 2 | 153 | 10053 | 207.61 | 190 | 185 | 47.5 |
| D | 1 | 20 | 8965 | 184.72 | 190 | 185 | 47.5 |
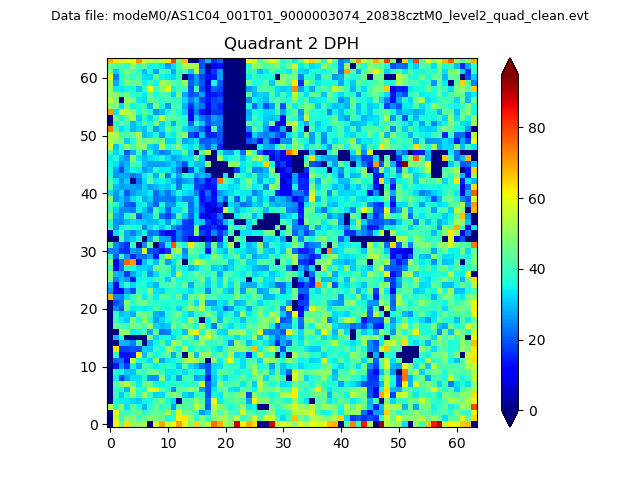
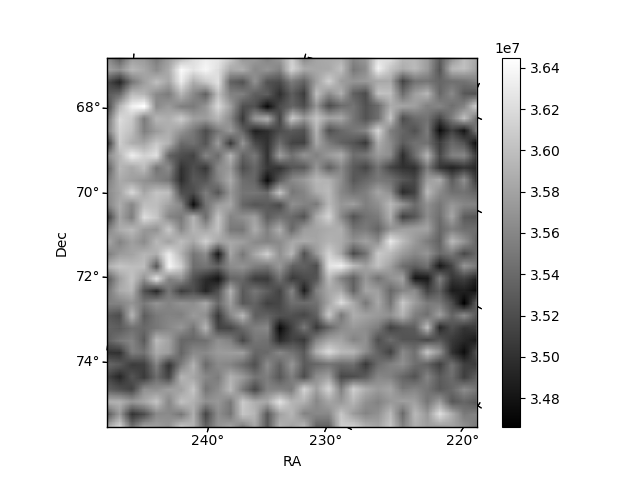
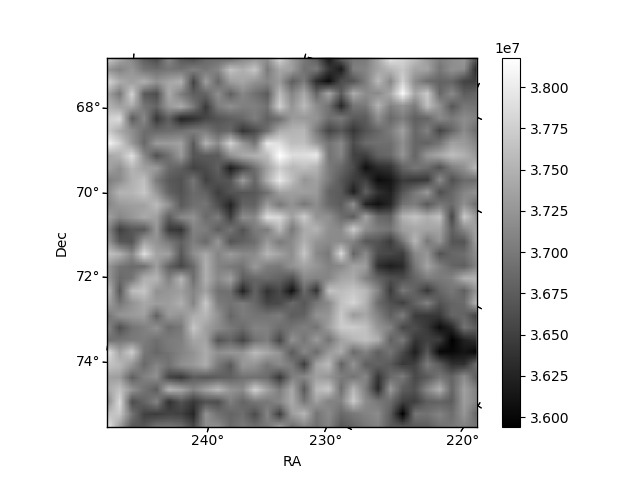
Histogram calculated using DETX and DETY for each event in the final _common_clean file
| Quadrant A | 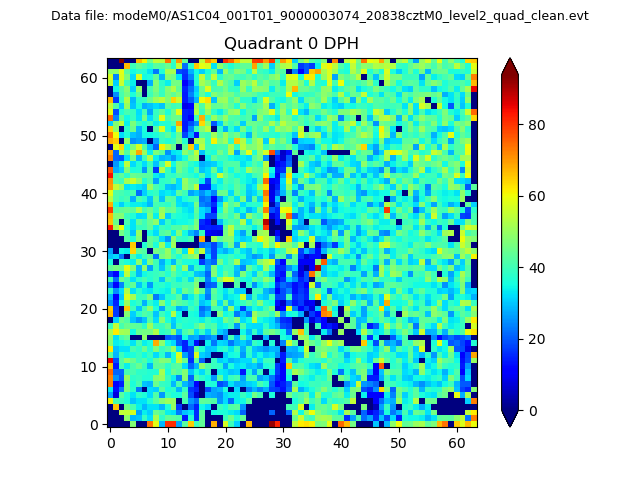 |
 |
Quadrant B |
|---|---|---|---|
| Quadrant D | 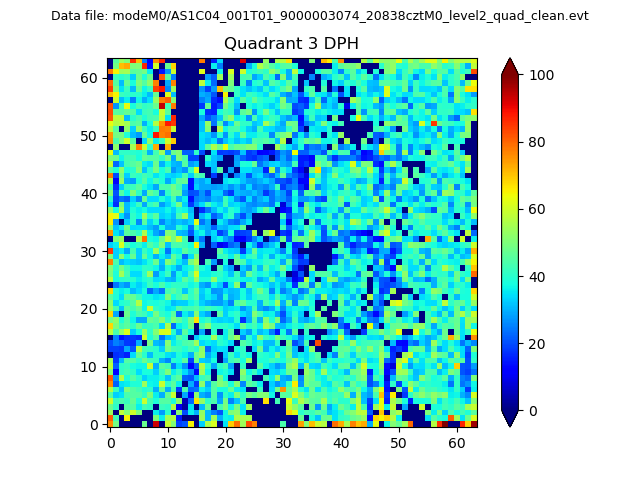 |
 |
Quadrant C |
| Plot type | Count rate plots | Images |
|---|---|---|
| Comparison with Poisson distribution Blue bars denote a histogram of data divided into 1 sec bins. Red curve is a Poisson curve with rate = median count rate of data. |
 |
 |
| Quadrant-wise count rates Data is divided into 100 sec bins |
 |
|
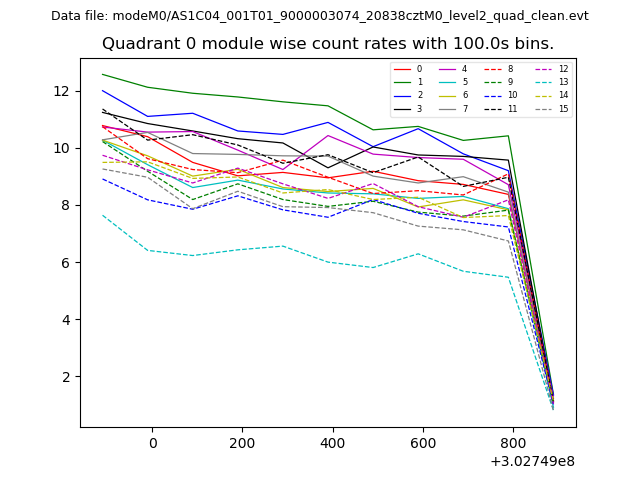
| Module-wise count rates for Quadrant A Data is divided into 100 sec bins |
 |
 |
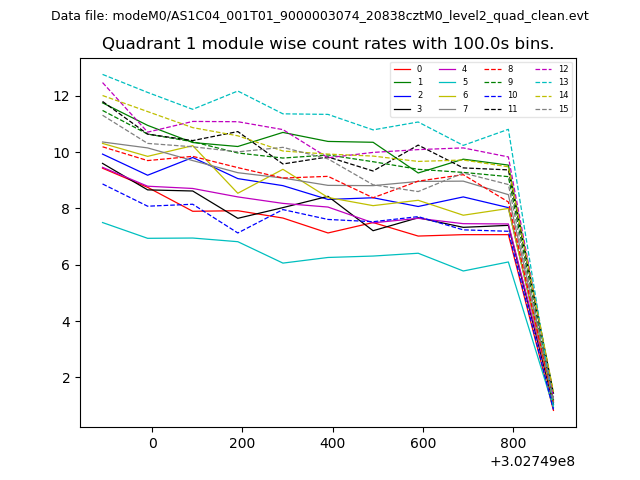
| Module-wise count rates for Quadrant B Data is divided into 100 sec bins |
 |
 |
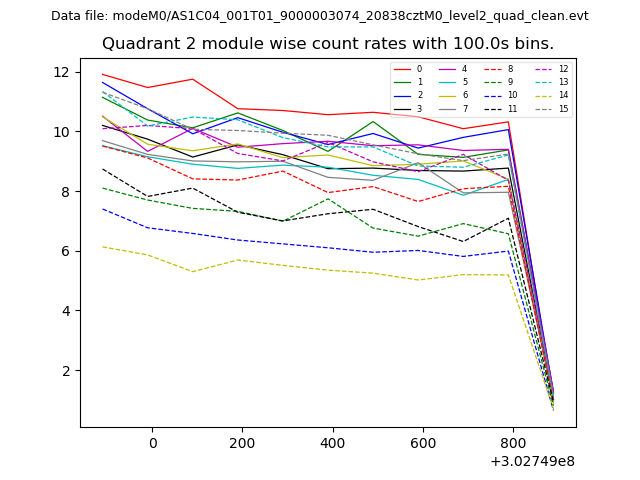
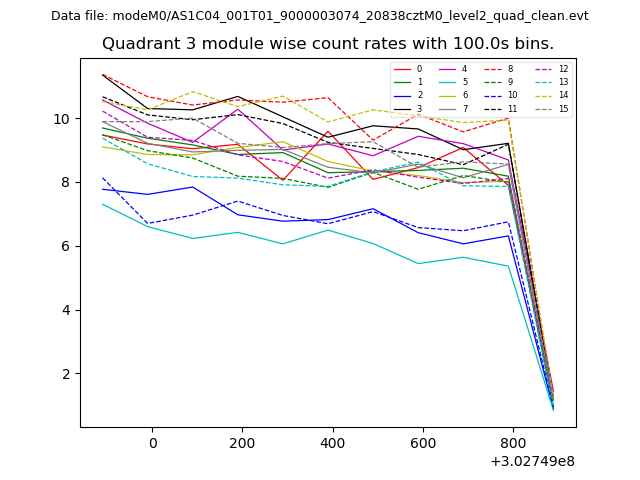
| Module-wise count rates for Quadrant C Data is divided into 100 sec bins |
 |
 |
| Module-wise count rates for Quadrant D Data is divided into 100 sec bins |
 |
 |
| Parameter | Plot |
|---|---|
| CZT HV Monitor | 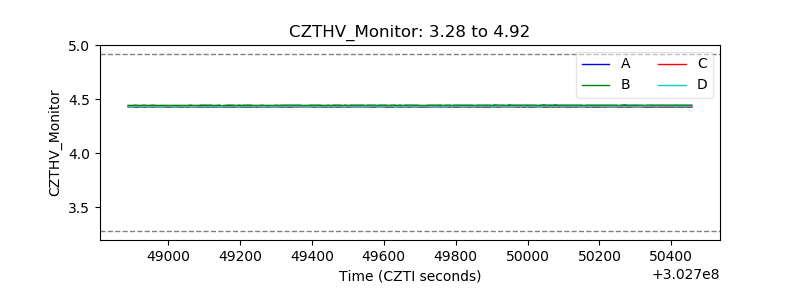 |
| D_VDD | 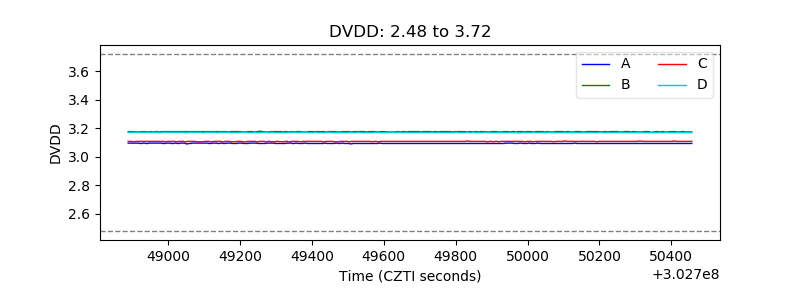 |
| Temperature 1 | 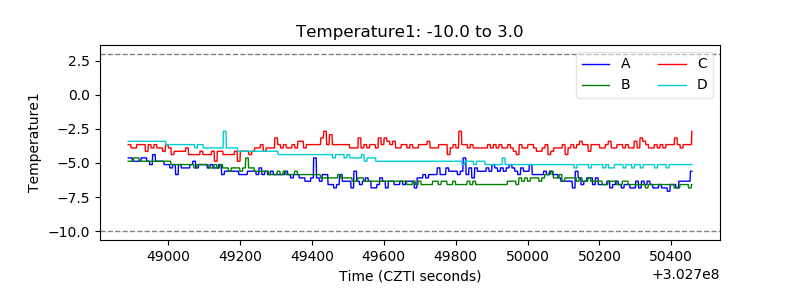 |
| Veto HV Monitor | 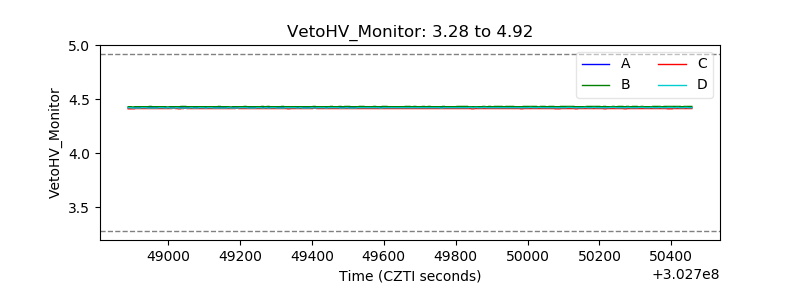 |
| Veto LLD | 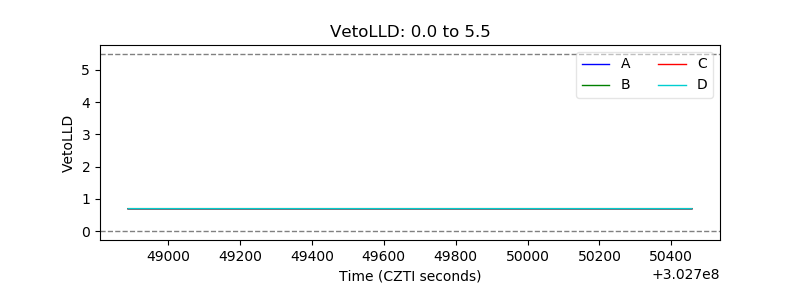 |
| Alpha Counter |  |
| _CPM_Rate |  |
| CZT Counter | 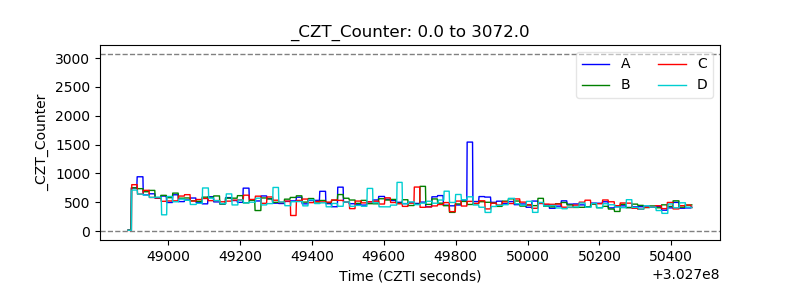 |
| +2.5 Volts monitor |  |
| +5 Volts monitor |  |
| _ROLL_ROT | 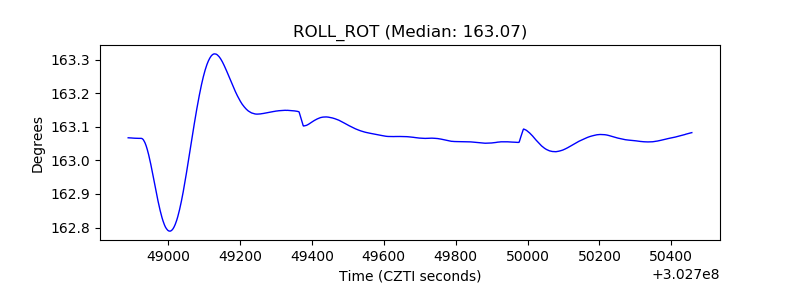 |
| _Roll_DEC | 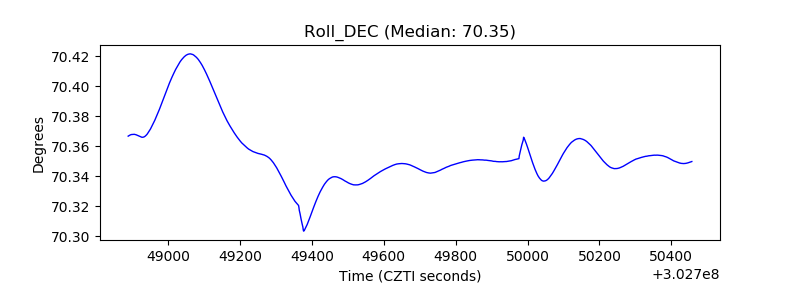 |
| _Roll_RA | 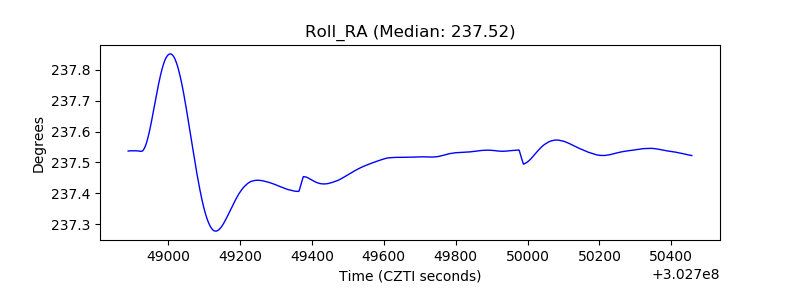 |
| Veto Counter | 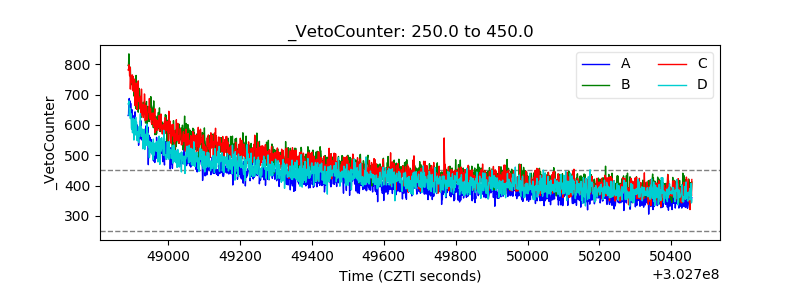 |