| Param | Original file | Final file |
|---|---|---|
| Filename | modeM0/AS1C04_001T01_9000003074_20840cztM0_level2.evt | modeM0/AS1C04_001T01_9000003074_20840cztM0_level2_quad_clean.evt |
| Size (bytes) | 516,064,320 | 100,180,800 |
| Size | 492.2 MB | 95.5 MB |
| Events in quadrant A | 3,224,939 | 659,472 |
| Events in quadrant B | 3,647,663 | 656,577 |
| Events in quadrant C | 3,147,882 | 634,771 |
| Events in quadrant D | 5,157,244 | 619,839 |
| Mode M0 | |||
|---|---|---|---|
| Quadrant | BADHDUFLAG | Total packets | Discarded packets |
| A | 0 | 13924 | 2 |
| B | 0 | 15255 | 2 |
| C | 0 | 13677 | 2 |
| D | 0 | 19804 | 5 |
| Mode M9 | |||
|---|---|---|---|
| Quadrant | BADHDUFLAG | Total packets | Discarded packets |
| A | 0 | 13 | 0 |
| B | 0 | 13 | 0 |
| C | 0 | 13 | 0 |
| D | 0 | 13 | 0 |
| Mode SS | |||
|---|---|---|---|
| Quadrant | BADHDUFLAG | Total packets | Discarded packets |
| A | 0 | 132 | 0 |
| B | 0 | 132 | 0 |
| C | 0 | 132 | 0 |
| D | 0 | 132 | 0 |
| Quadrant | Total seconds | Saturated seconds | Saturation percentage |
|---|---|---|---|
| A | 6655 | 24 | 0.360631% |
| B | 6655 | 80 | 1.202104% |
| C | 6655 | 44 | 0.661157% |
| D | 6654 | 886 | 13.315299% |
Noise dominated data is calculated using 1-second bins in cleaned event files. If a bin has >2000 counts, and if more than 50% of those come from <1% of pixels, then it is considered to be noise-dominated and hence unusable.
| Quadrant | # 1 sec bins | Bins with >0 counts | Bins with >2000 counts | High rate bins dominated by noise | Noise dominated (total time) | Noise dominated (detector-on time) | Marked lightcurve |
|---|---|---|---|---|---|---|---|
| A | 7770 | 6655 | 6 | 6 | 0.08% | 0.09% | 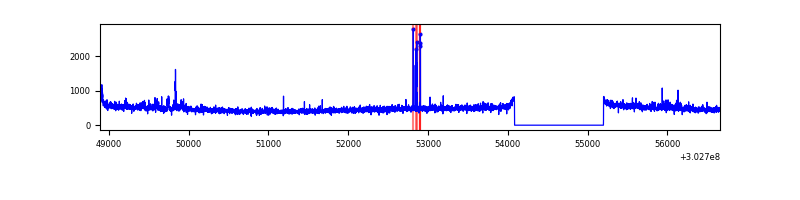 |
| B | 7770 | 6655 | 32 | 32 | 0.41% | 0.48% | 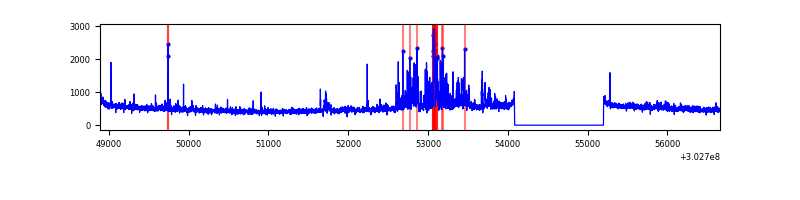 |
| C | 7770 | 6655 | 0 | 0 | 0.00% | 0.00% | 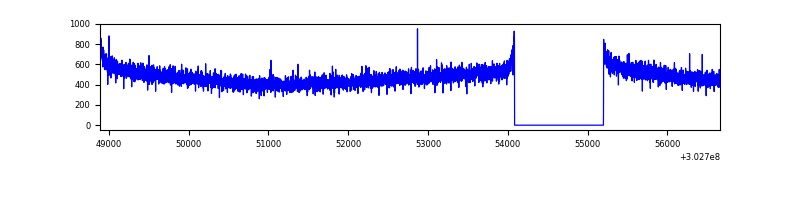 |
| D | 7768 | 6653 | 808 | 808 | 10.40% | 12.14% | 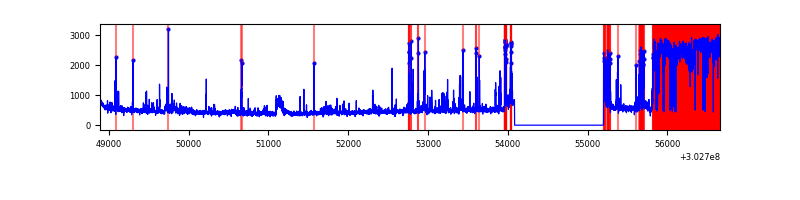 |
Top three noisy pixels from each quadrant. If the there are fewer than three noisy pixels in the level2.evt file, extra rows are filled as -1
| Pixel properties | Quadrant properties | ||||||
|---|---|---|---|---|---|---|---|
| Quadrant | DetID | PixID | Counts | Sigma | Mean | Median | Sigma |
| A | 5 | 16 | 47073 | 286.18 | 810 | 794 | 161.7 |
| A | 2 | 79 | 45519 | 276.57 | 810 | 794 | 161.7 |
| A | 6 | 16 | 16662 | 98.12 | 810 | 794 | 161.7 |
| B | 7 | 220 | 194169 | 1285.45 | 805 | 788 | 150.4 |
| B | 5 | 172 | 60001 | 393.6 | 805 | 788 | 150.4 |
| B | 0 | 189 | 57130 | 374.52 | 805 | 788 | 150.4 |
| C | 14 | 238 | 122575 | 680.67 | 775 | 779 | 178.9 |
| C | 13 | 61 | 5381 | 25.72 | 775 | 779 | 178.9 |
| C | 3 | 233 | 2581 | 10.07 | 775 | 779 | 178.9 |
| D | 1 | 52 | 2288836 | 13455.7 | 707 | 686 | 170.1 |
| D | 1 | 20 | 58244 | 338.48 | 707 | 686 | 170.1 |
| D | 13 | 153 | 47212 | 273.6 | 707 | 686 | 170.1 |
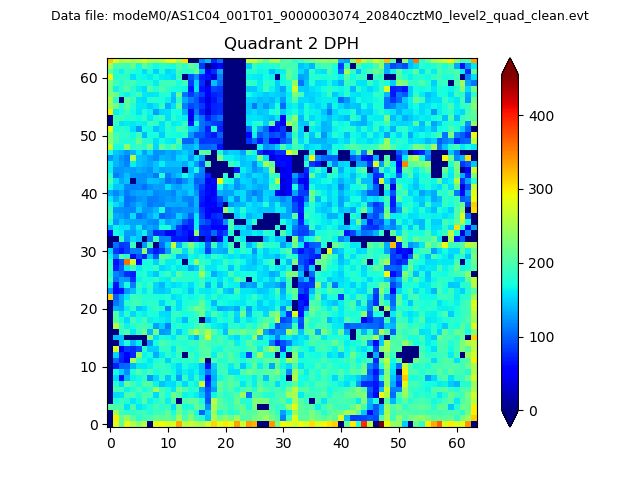
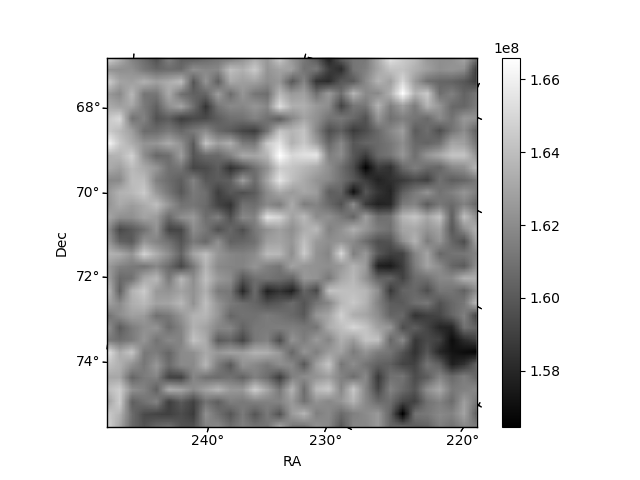
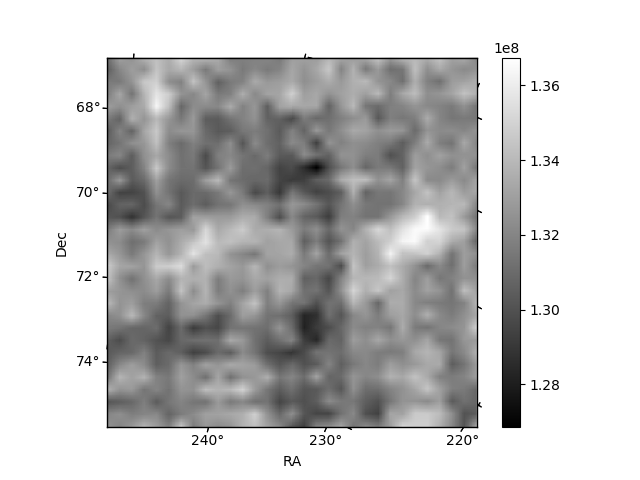
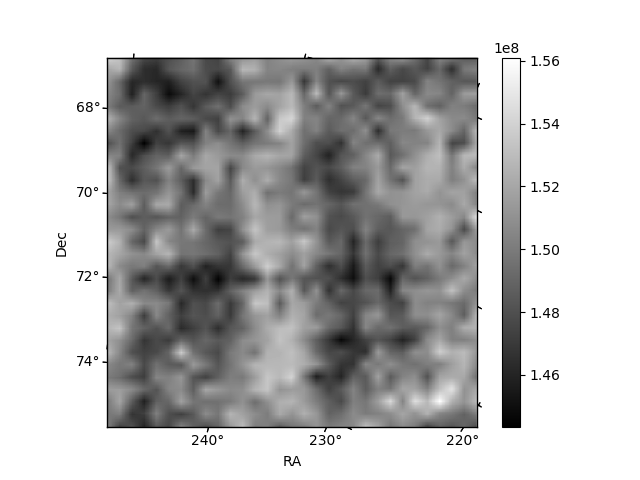
Histogram calculated using DETX and DETY for each event in the final _common_clean file
| Quadrant A | 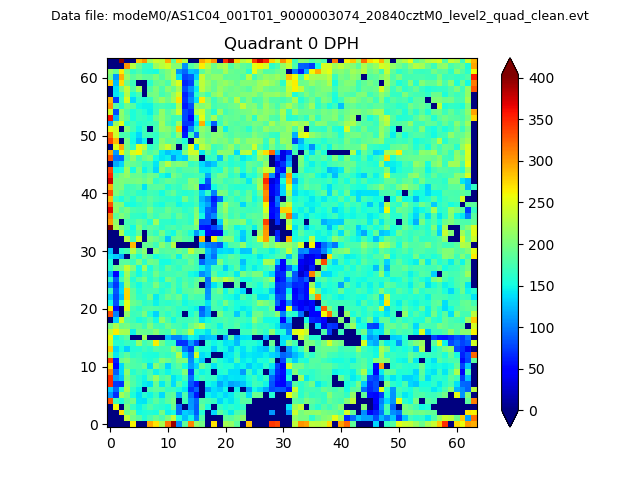 |
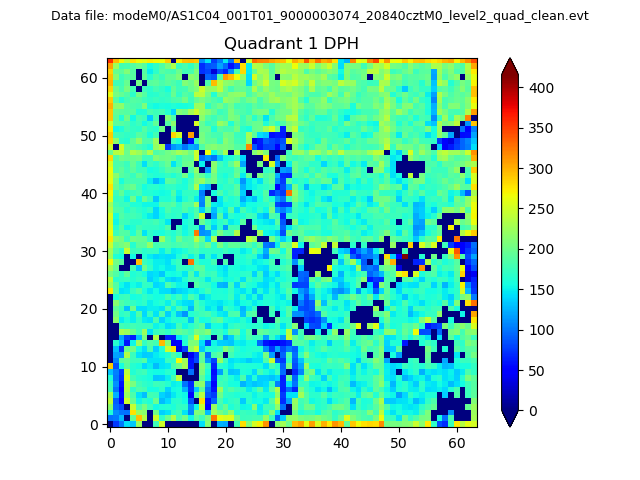 |
Quadrant B |
|---|---|---|---|
| Quadrant D | 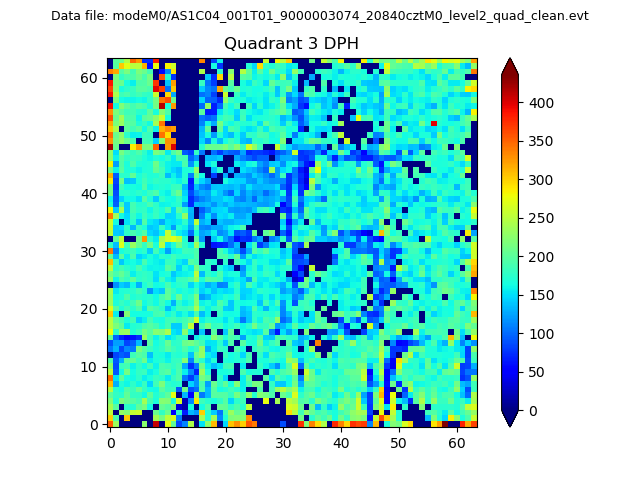 |
 |
Quadrant C |
| Plot type | Count rate plots | Images |
|---|---|---|
| Comparison with Poisson distribution Blue bars denote a histogram of data divided into 1 sec bins. Red curve is a Poisson curve with rate = median count rate of data. |
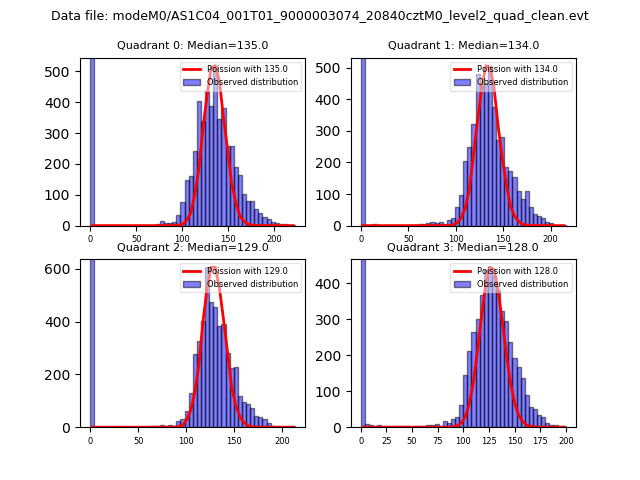 |
 |
| Quadrant-wise count rates Data is divided into 100 sec bins |
 |
|
| Module-wise count rates for Quadrant A Data is divided into 100 sec bins |
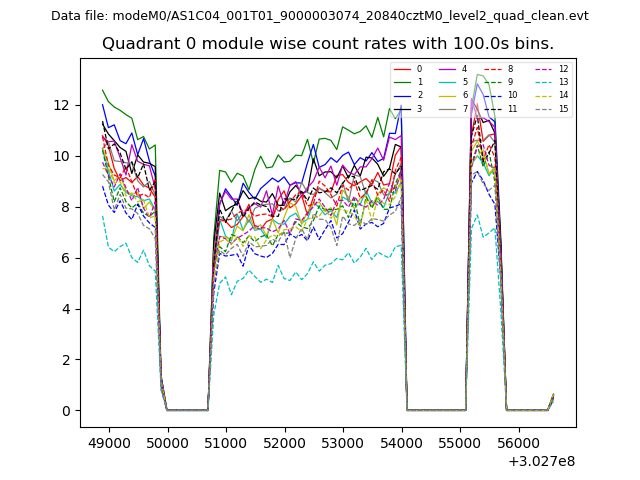 |
 |
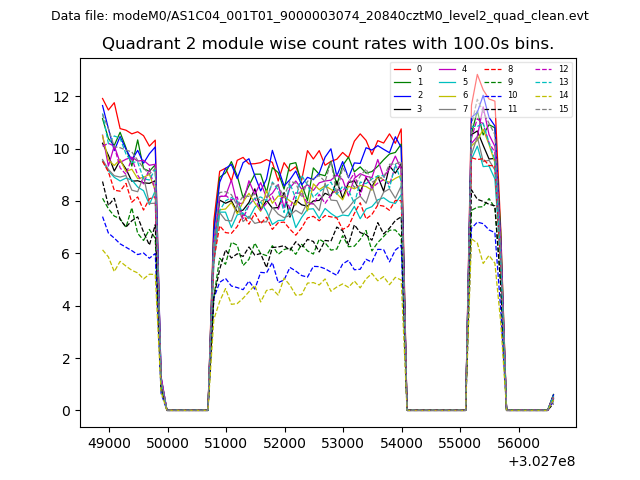
| Module-wise count rates for Quadrant B Data is divided into 100 sec bins |
 |
 |
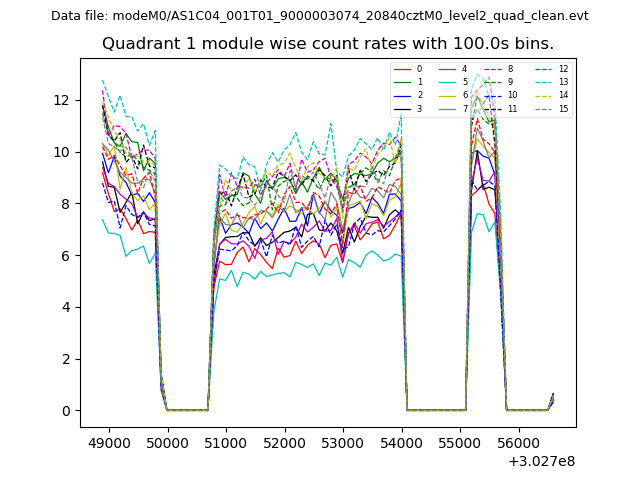
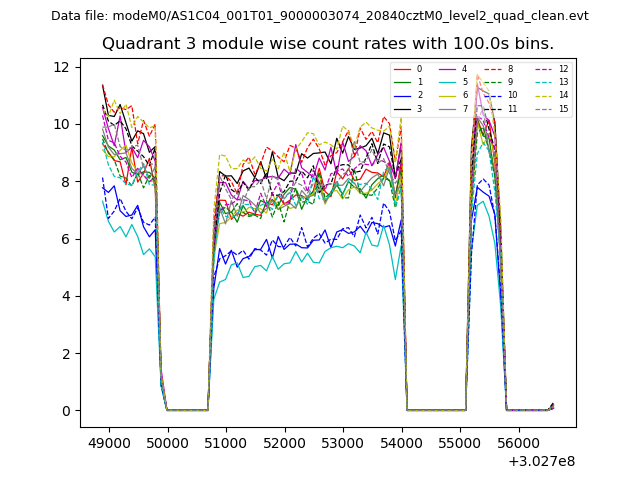
| Module-wise count rates for Quadrant C Data is divided into 100 sec bins |
 |
 |
| Module-wise count rates for Quadrant D Data is divided into 100 sec bins |
 |
 |
| Parameter | Plot |
|---|---|
| CZT HV Monitor | 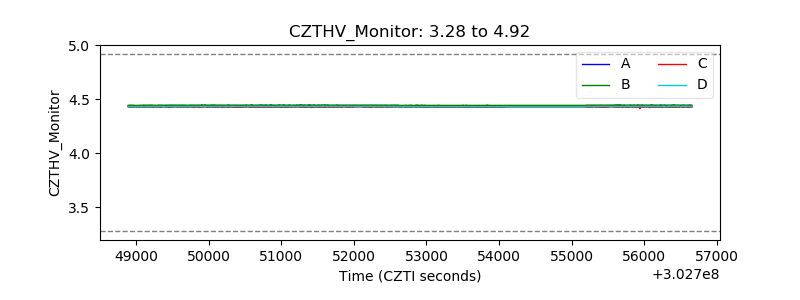 |
| D_VDD | 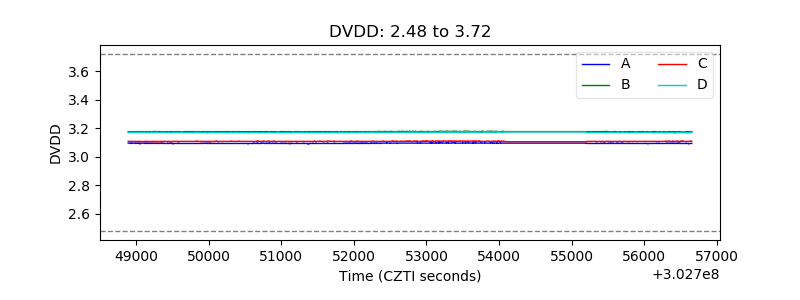 |
| Temperature 1 | 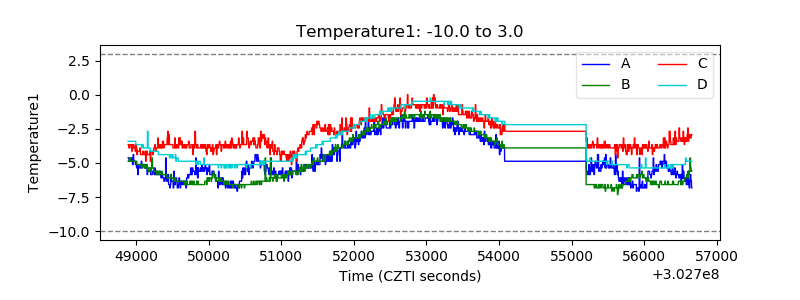 |
| Veto HV Monitor | 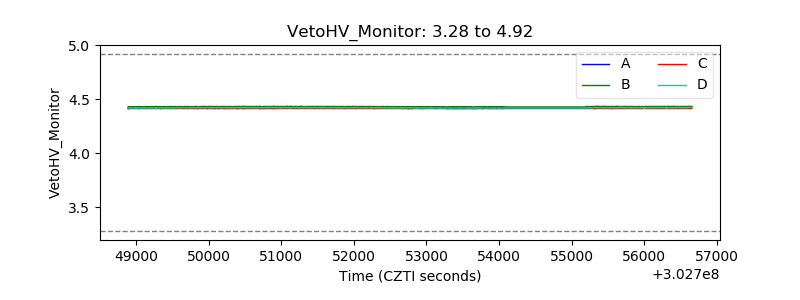 |
| Veto LLD |  |
| Alpha Counter | 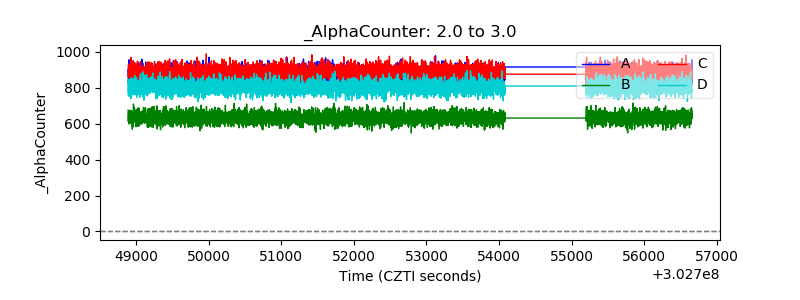 |
| _CPM_Rate |  |
| CZT Counter | 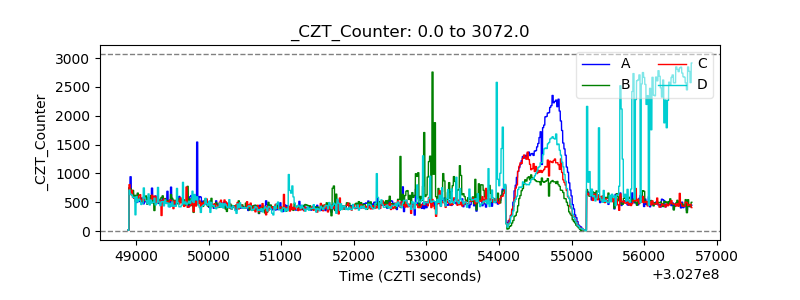 |
| +2.5 Volts monitor | 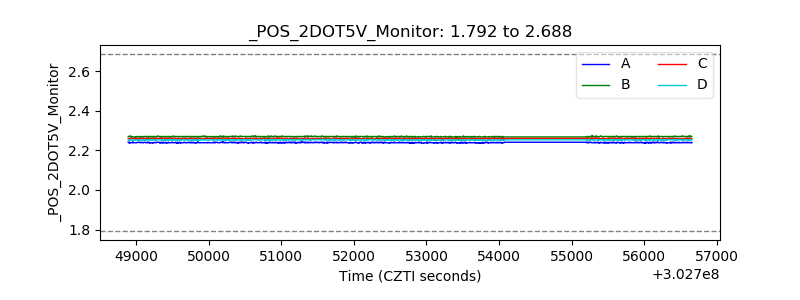 |
| +5 Volts monitor |  |
| _ROLL_ROT | 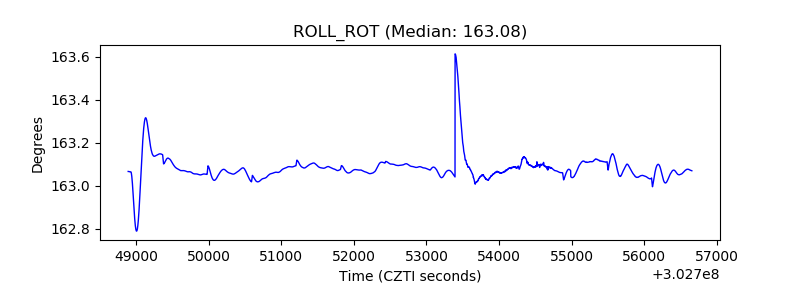 |
| _Roll_DEC | 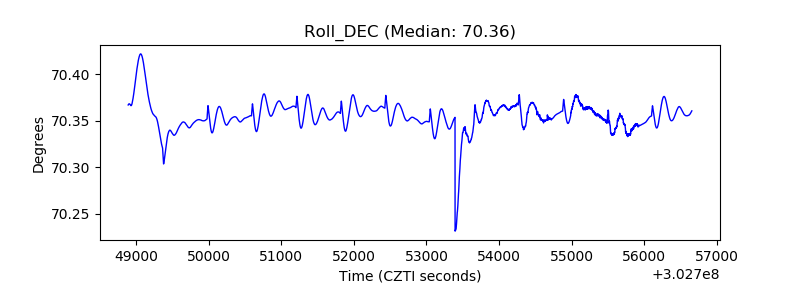 |
| _Roll_RA | 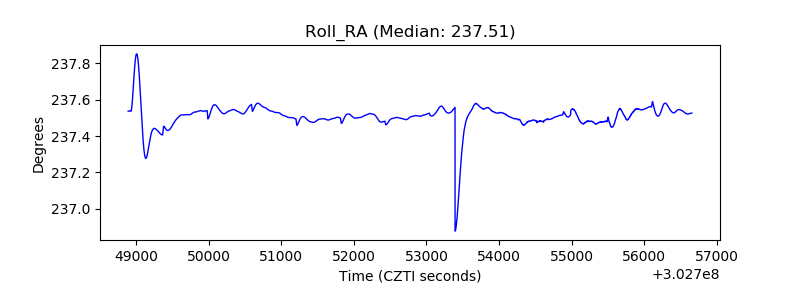 |
| Veto Counter | 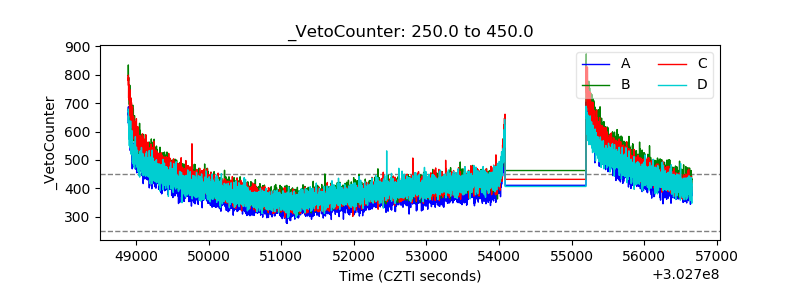 |