| Param | Original file | Final file |
|---|---|---|
| Filename | modeM0/AS1C04_001T01_9000003074_20841cztM0_level2.evt | modeM0/AS1C04_001T01_9000003074_20841cztM0_level2_quad_clean.evt |
| Size (bytes) | 595,128,960 | 93,991,680 |
| Size | 567.6 MB | 89.6 MB |
| Events in quadrant A | 3,213,168 | 647,870 |
| Events in quadrant B | 3,403,840 | 644,919 |
| Events in quadrant C | 3,125,646 | 615,659 |
| Events in quadrant D | 7,844,541 | 488,735 |
| Mode M0 | |||
|---|---|---|---|
| Quadrant | BADHDUFLAG | Total packets | Discarded packets |
| A | 0 | 13598 | 2 |
| B | 0 | 14146 | 2 |
| C | 0 | 13393 | 2 |
| D | 0 | 27459 | 2 |
| Mode M9 | |||
|---|---|---|---|
| Quadrant | BADHDUFLAG | Total packets | Discarded packets |
| A | 0 | 13 | 0 |
| B | 0 | 14 | 0 |
| C | 0 | 14 | 0 |
| D | 0 | 14 | 0 |
| Mode SS | |||
|---|---|---|---|
| Quadrant | BADHDUFLAG | Total packets | Discarded packets |
| A | 0 | 130 | 0 |
| B | 0 | 130 | 0 |
| C | 0 | 130 | 0 |
| D | 0 | 130 | 0 |
| Quadrant | Total seconds | Saturated seconds | Saturation percentage |
|---|---|---|---|
| A | 6434 | 37 | 0.575070% |
| B | 6434 | 70 | 1.087970% |
| C | 6434 | 62 | 0.963631% |
| D | 6434 | 1960 | 30.463164% |
Noise dominated data is calculated using 1-second bins in cleaned event files. If a bin has >2000 counts, and if more than 50% of those come from <1% of pixels, then it is considered to be noise-dominated and hence unusable.
| Quadrant | # 1 sec bins | Bins with >0 counts | Bins with >2000 counts | High rate bins dominated by noise | Noise dominated (total time) | Noise dominated (detector-on time) | Marked lightcurve |
|---|---|---|---|---|---|---|---|
| A | 7649 | 6434 | 0 | 0 | 0.00% | 0.00% | 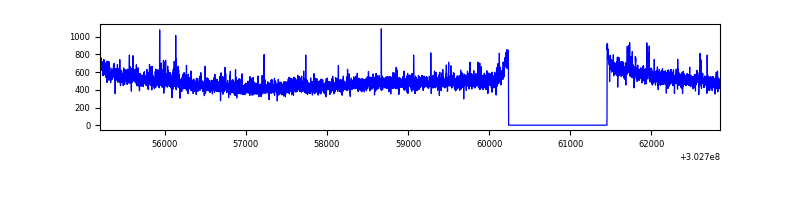 |
| B | 7649 | 6434 | 17 | 17 | 0.22% | 0.26% | 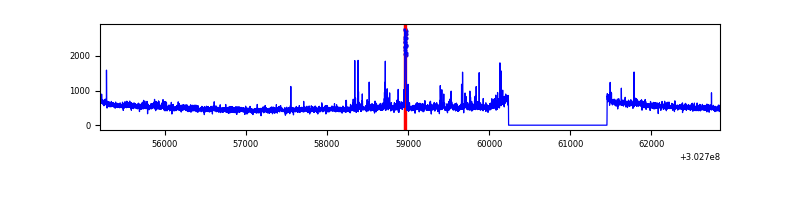 |
| C | 7649 | 6434 | 0 | 0 | 0.00% | 0.00% | 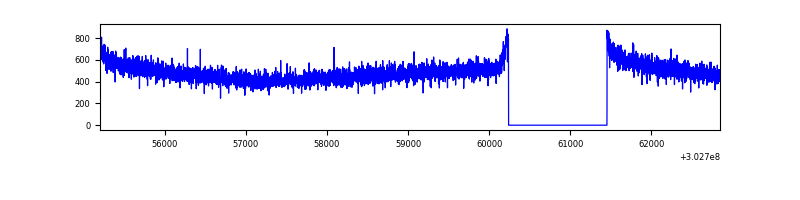 |
| D | 7649 | 6434 | 1871 | 1871 | 24.46% | 29.08% | 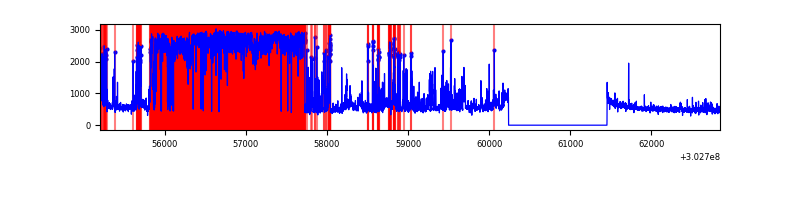 |
Top three noisy pixels from each quadrant. If the there are fewer than three noisy pixels in the level2.evt file, extra rows are filled as -1
| Pixel properties | Quadrant properties | ||||||
|---|---|---|---|---|---|---|---|
| Quadrant | DetID | PixID | Counts | Sigma | Mean | Median | Sigma |
| A | 2 | 79 | 41374 | 249.01 | 816 | 801 | 162.9 |
| A | 6 | 16 | 15473 | 90.05 | 816 | 801 | 162.9 |
| A | 0 | 226 | 7061 | 38.42 | 816 | 801 | 162.9 |
| B | 0 | 189 | 55222 | 361.68 | 808 | 788 | 150.5 |
| B | 5 | 172 | 46410 | 303.13 | 808 | 788 | 150.5 |
| B | 4 | 142 | 25533 | 164.41 | 808 | 788 | 150.5 |
| C | 14 | 238 | 123761 | 697.37 | 769 | 773 | 176.4 |
| C | 13 | 61 | 5391 | 26.19 | 769 | 773 | 176.4 |
| C | 7 | 247 | 2720 | 11.04 | 769 | 773 | 176.4 |
| D | 1 | 52 | 5158234 | 34866.11 | 618 | 600 | 147.9 |
| D | 13 | 153 | 270000 | 1821.17 | 618 | 600 | 147.9 |
| D | 1 | 20 | 48214 | 321.88 | 618 | 600 | 147.9 |
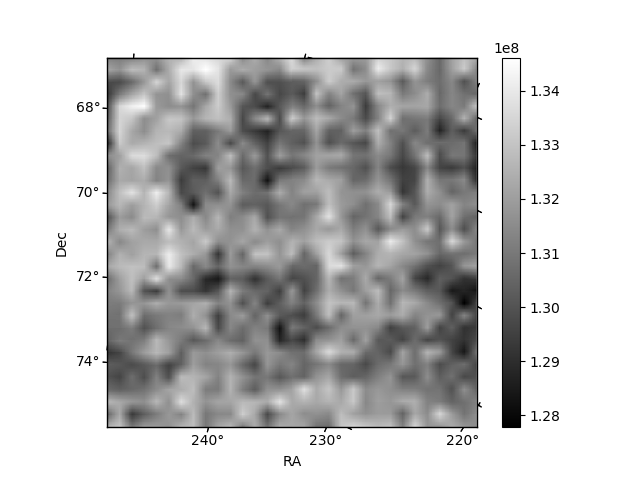
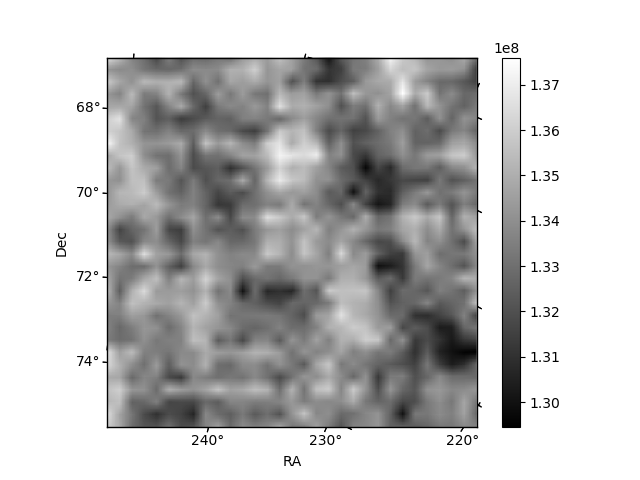
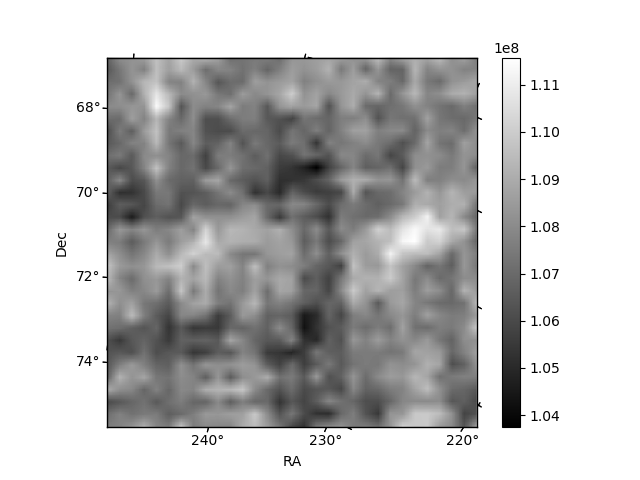
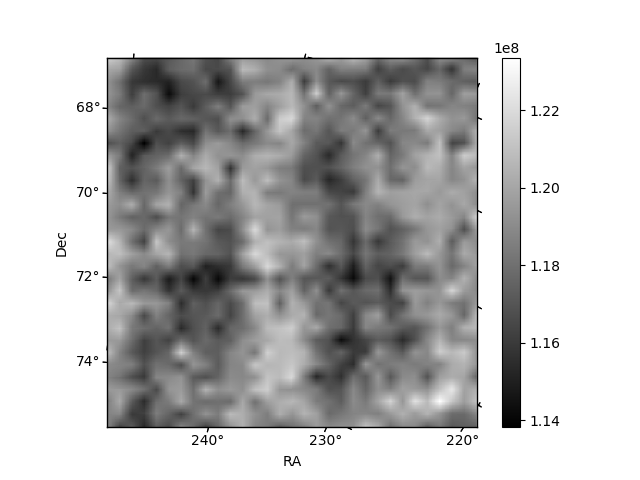
Histogram calculated using DETX and DETY for each event in the final _common_clean file
| Quadrant A | 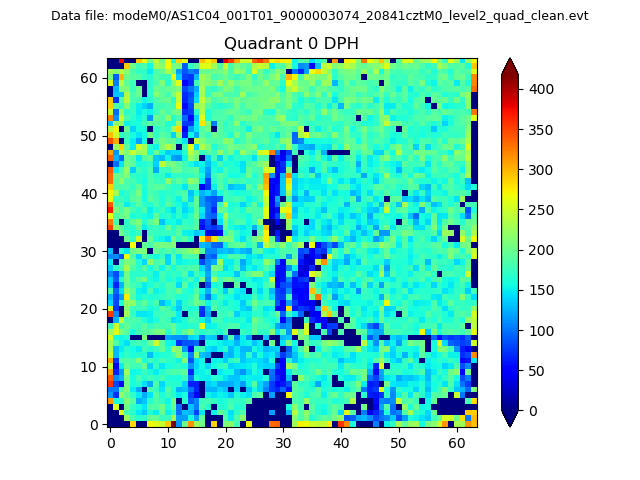 |
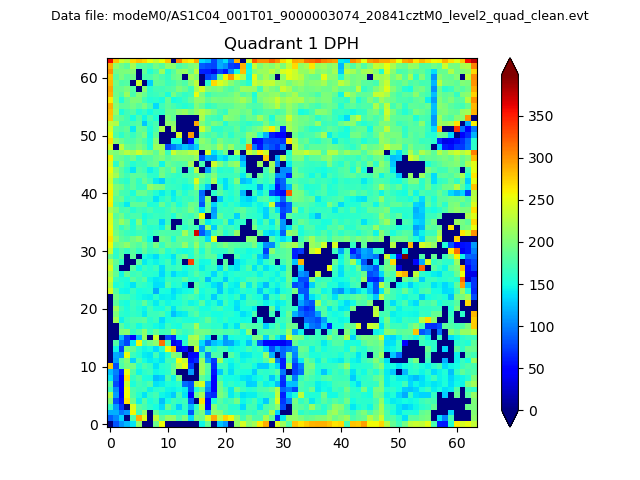 |
Quadrant B |
|---|---|---|---|
| Quadrant D |  |
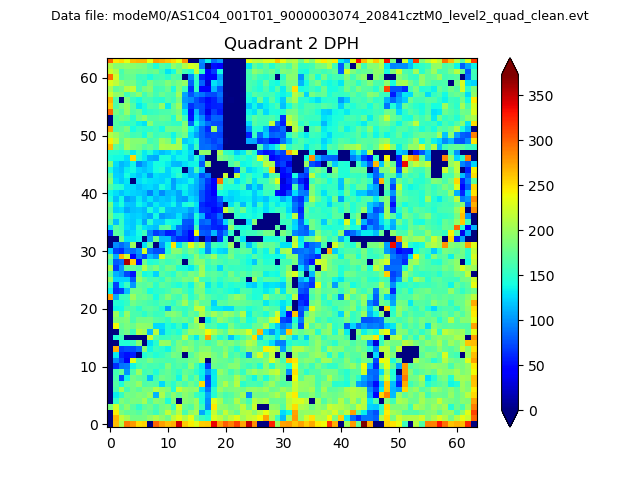 |
Quadrant C |
| Plot type | Count rate plots | Images |
|---|---|---|
| Comparison with Poisson distribution Blue bars denote a histogram of data divided into 1 sec bins. Red curve is a Poisson curve with rate = median count rate of data. |
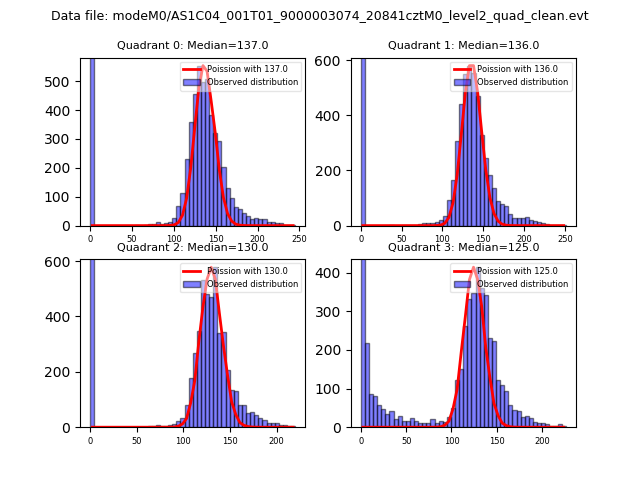 |
 |
| Quadrant-wise count rates Data is divided into 100 sec bins |
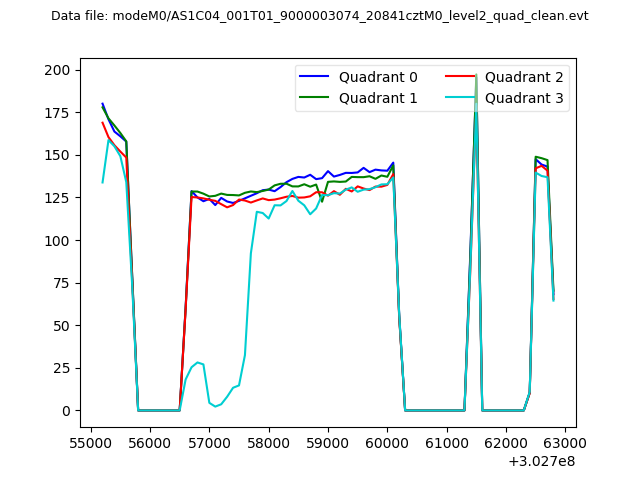 |
|
| Module-wise count rates for Quadrant A Data is divided into 100 sec bins |
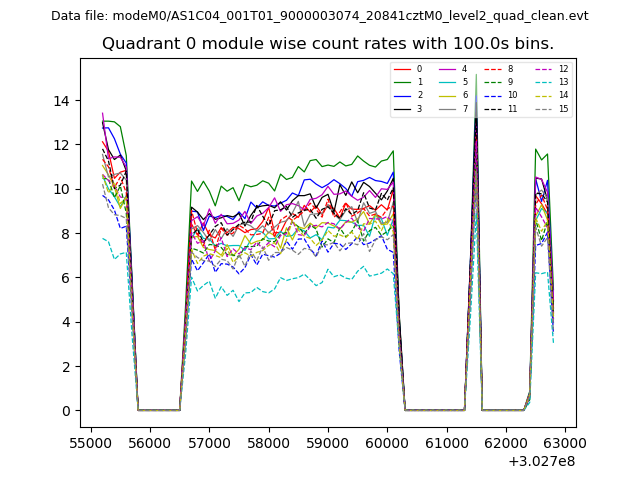 |
 |
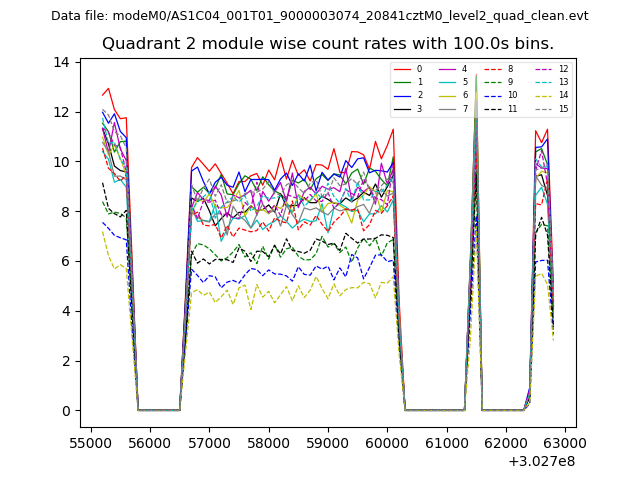
| Module-wise count rates for Quadrant B Data is divided into 100 sec bins |
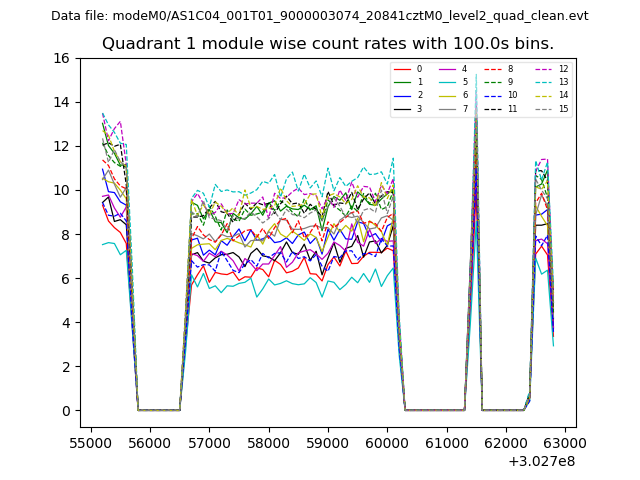 |
 |
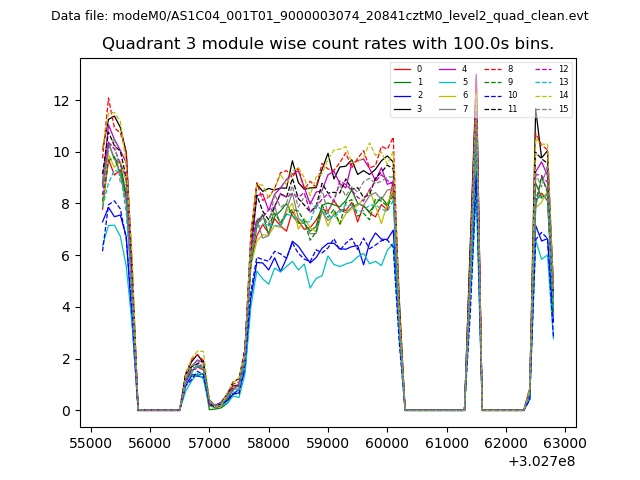
| Module-wise count rates for Quadrant C Data is divided into 100 sec bins |
 |
 |
| Module-wise count rates for Quadrant D Data is divided into 100 sec bins |
 |
 |
| Parameter | Plot |
|---|---|
| CZT HV Monitor | 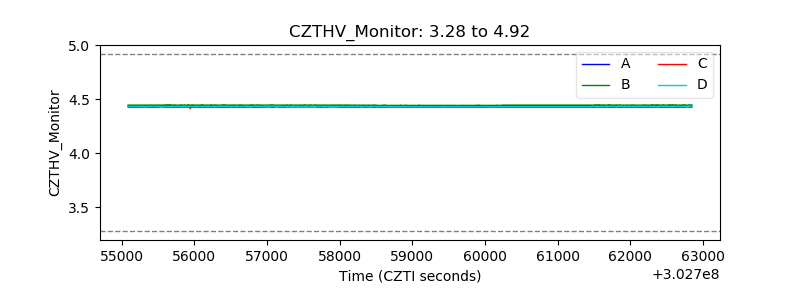 |
| D_VDD | 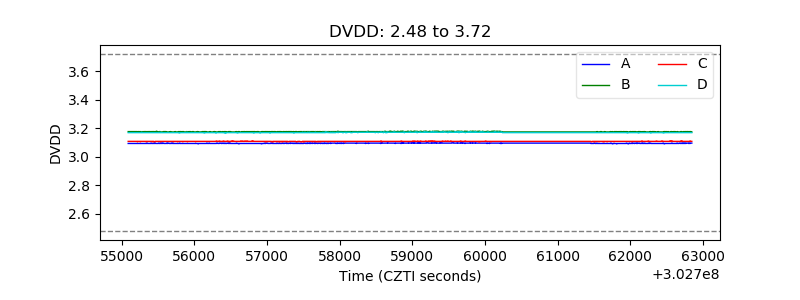 |
| Temperature 1 | 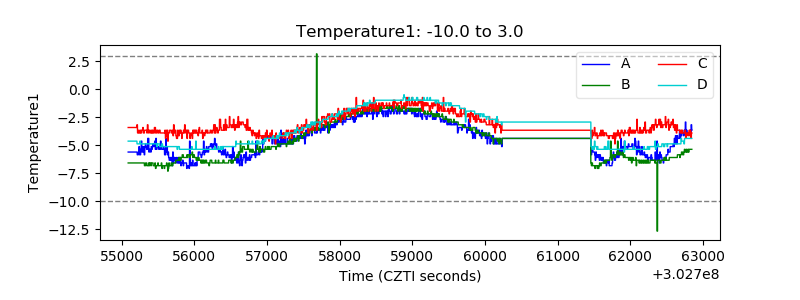 |
| Veto HV Monitor | 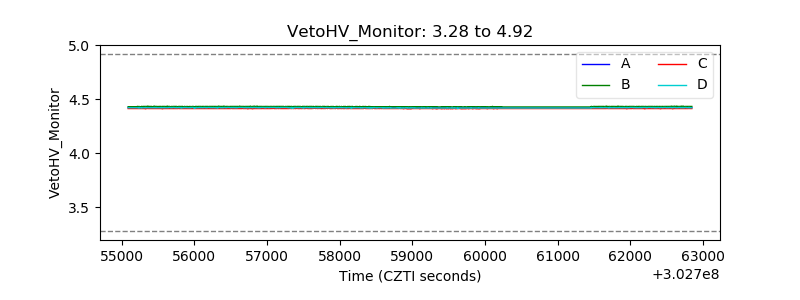 |
| Veto LLD | 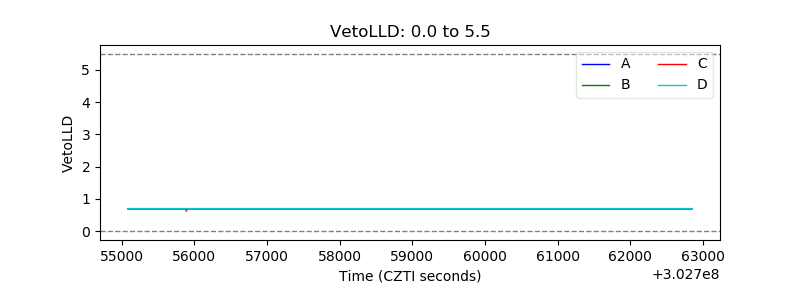 |
| Alpha Counter | 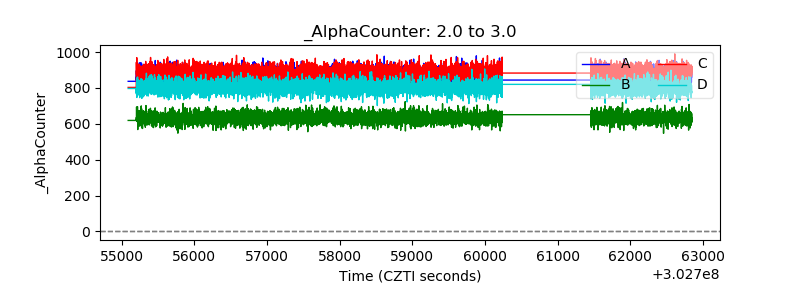 |
| _CPM_Rate | 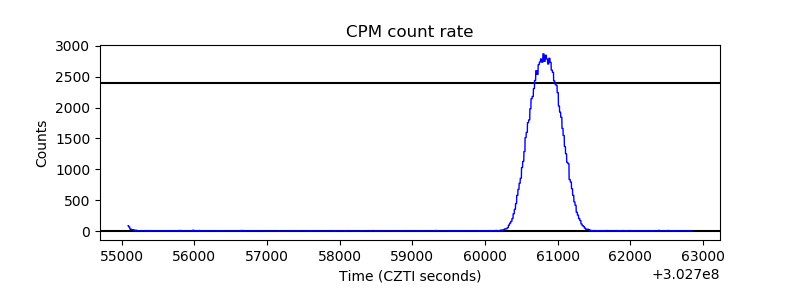 |
| CZT Counter |  |
| +2.5 Volts monitor | 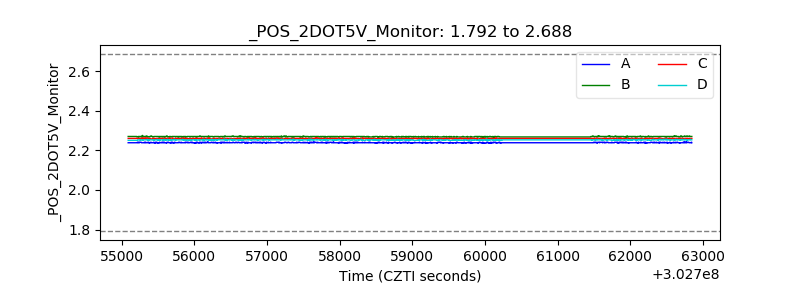 |
| +5 Volts monitor |  |
| _ROLL_ROT | 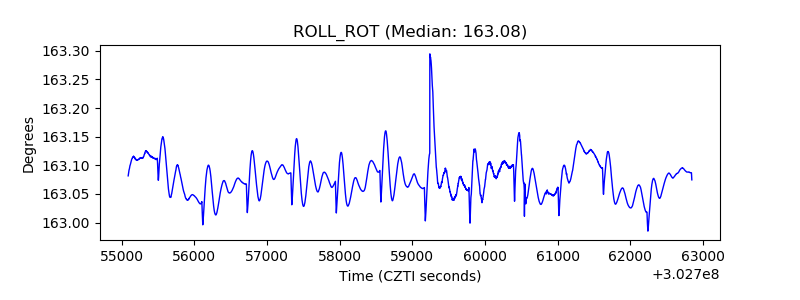 |
| _Roll_DEC |  |
| _Roll_RA | 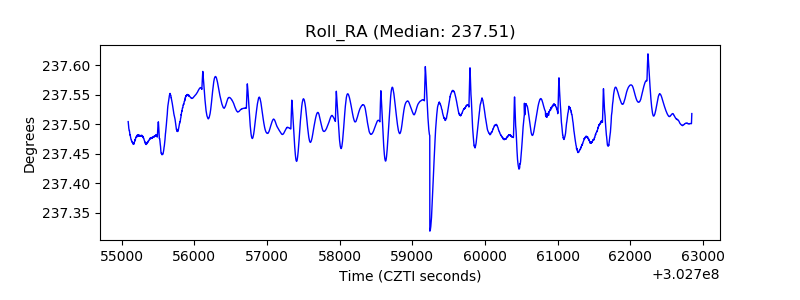 |
| Veto Counter | 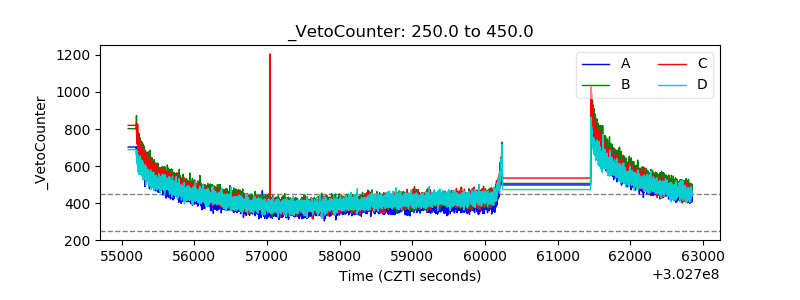 |