| Param | Original file | Final file |
|---|---|---|
| Filename | modeM0/AS1C04_001T01_9000003074_20842cztM0_level2.evt | modeM0/AS1C04_001T01_9000003074_20842cztM0_level2_quad_clean.evt |
| Size (bytes) | 460,391,040 | 96,048,000 |
| Size | 439.1 MB | 91.6 MB |
| Events in quadrant A | 3,104,082 | 649,526 |
| Events in quadrant B | 3,343,087 | 645,945 |
| Events in quadrant C | 2,961,905 | 610,175 |
| Events in quadrant D | 4,129,307 | 586,863 |
| Mode M0 | |||
|---|---|---|---|
| Quadrant | BADHDUFLAG | Total packets | Discarded packets |
| A | 0 | 12789 | 1 |
| B | 0 | 13662 | 1 |
| C | 0 | 12493 | 1 |
| D | 0 | 16048 | 1 |
| Mode M9 | |||
|---|---|---|---|
| Quadrant | BADHDUFLAG | Total packets | Discarded packets |
| A | 0 | 14 | 0 |
| B | 0 | 14 | 0 |
| C | 0 | 14 | 0 |
| D | 0 | 14 | 0 |
| Mode SS | |||
|---|---|---|---|
| Quadrant | BADHDUFLAG | Total packets | Discarded packets |
| A | 0 | 120 | 0 |
| B | 0 | 120 | 0 |
| C | 0 | 120 | 0 |
| D | 0 | 120 | 0 |
| Quadrant | Total seconds | Saturated seconds | Saturation percentage |
|---|---|---|---|
| A | 5961 | 37 | 0.620701% |
| B | 5962 | 74 | 1.241194% |
| C | 5962 | 52 | 0.872191% |
| D | 5962 | 329 | 5.518282% |
Noise dominated data is calculated using 1-second bins in cleaned event files. If a bin has >2000 counts, and if more than 50% of those come from <1% of pixels, then it is considered to be noise-dominated and hence unusable.
| Quadrant | # 1 sec bins | Bins with >0 counts | Bins with >2000 counts | High rate bins dominated by noise | Noise dominated (total time) | Noise dominated (detector-on time) | Marked lightcurve |
|---|---|---|---|---|---|---|---|
| A | 7285 | 5960 | 0 | 0 | 0.00% | 0.00% | 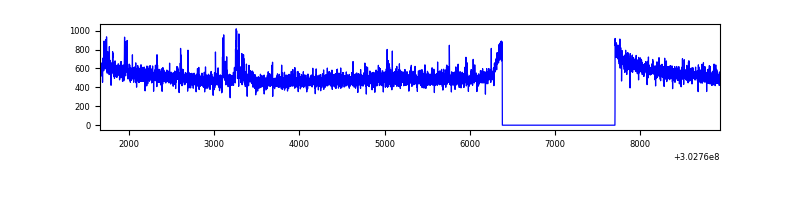 |
| B | 7287 | 5962 | 23 | 23 | 0.32% | 0.39% | 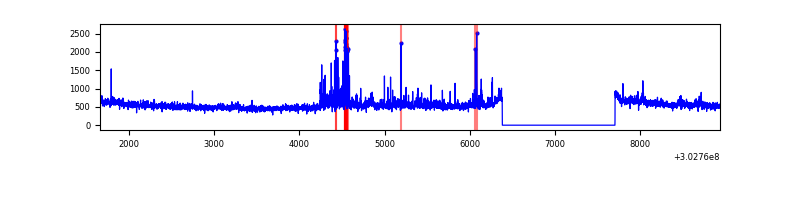 |
| C | 7287 | 5962 | 0 | 0 | 0.00% | 0.00% | 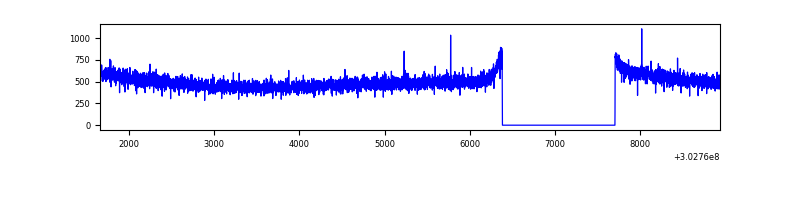 |
| D | 7287 | 5962 | 284 | 284 | 3.90% | 4.76% | 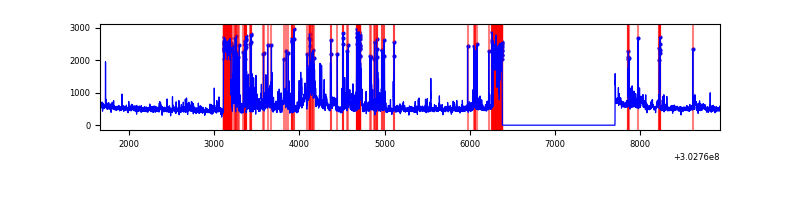 |
Top three noisy pixels from each quadrant. If the there are fewer than three noisy pixels in the level2.evt file, extra rows are filled as -1
| Pixel properties | Quadrant properties | ||||||
|---|---|---|---|---|---|---|---|
| Quadrant | DetID | PixID | Counts | Sigma | Mean | Median | Sigma |
| A | 15 | 174 | 39138 | 245.71 | 784 | 770 | 156.2 |
| A | 2 | 79 | 25431 | 157.93 | 784 | 770 | 156.2 |
| A | 6 | 16 | 15477 | 94.18 | 784 | 770 | 156.2 |
| B | 7 | 220 | 128866 | 900.68 | 771 | 754 | 142.2 |
| B | 0 | 189 | 117031 | 817.47 | 771 | 754 | 142.2 |
| B | 0 | 190 | 16875 | 113.34 | 771 | 754 | 142.2 |
| C | 14 | 238 | 119189 | 709.89 | 728 | 734 | 166.9 |
| C | 13 | 61 | 5099 | 26.16 | 728 | 734 | 166.9 |
| C | 7 | 220 | 2463 | 10.36 | 728 | 734 | 166.9 |
| D | 1 | 52 | 1069817 | 6103.28 | 730 | 708 | 175.2 |
| D | 13 | 153 | 234839 | 1336.6 | 730 | 708 | 175.2 |
| D | 9 | 1 | 38526 | 215.89 | 730 | 708 | 175.2 |
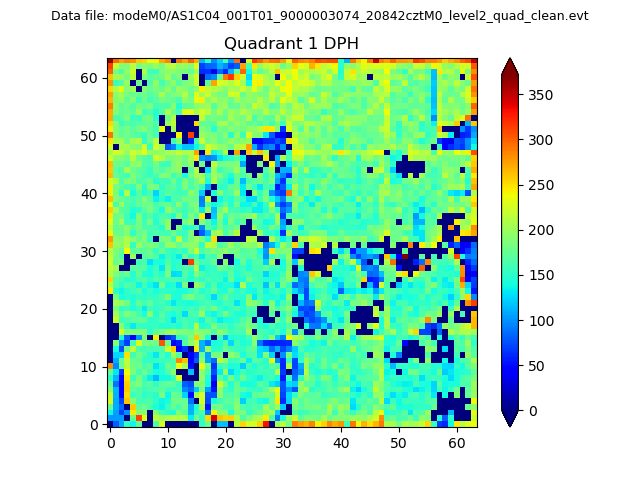
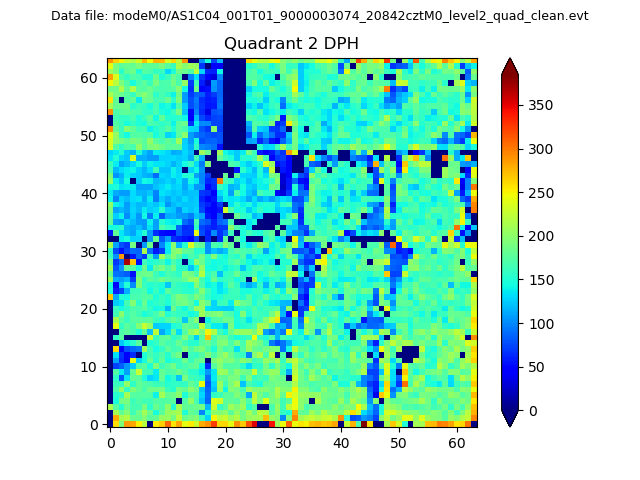
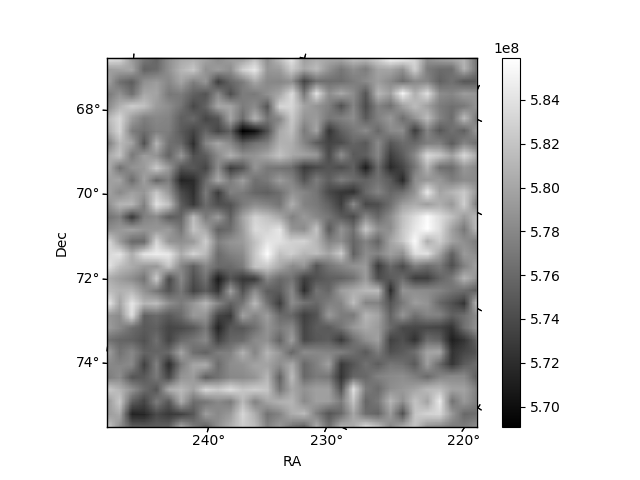
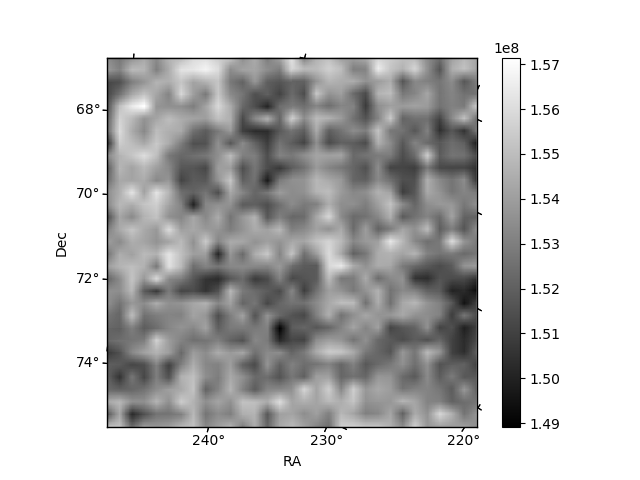
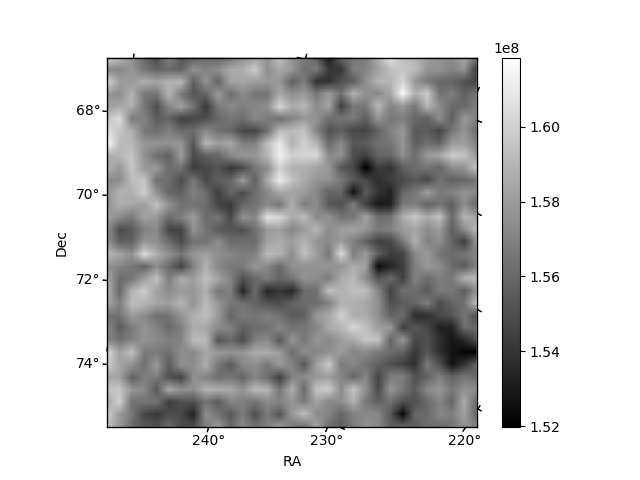
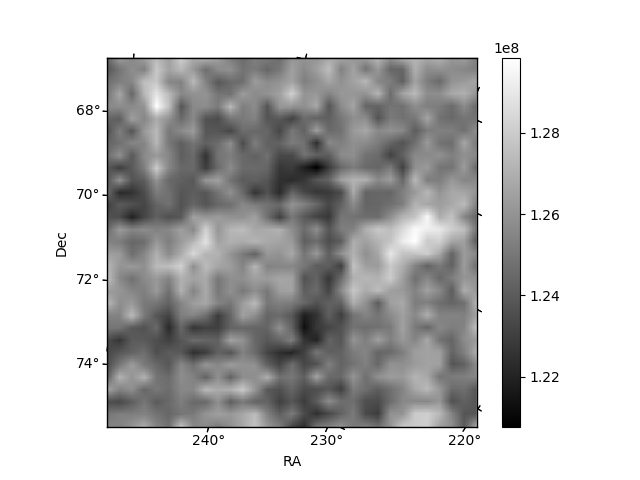
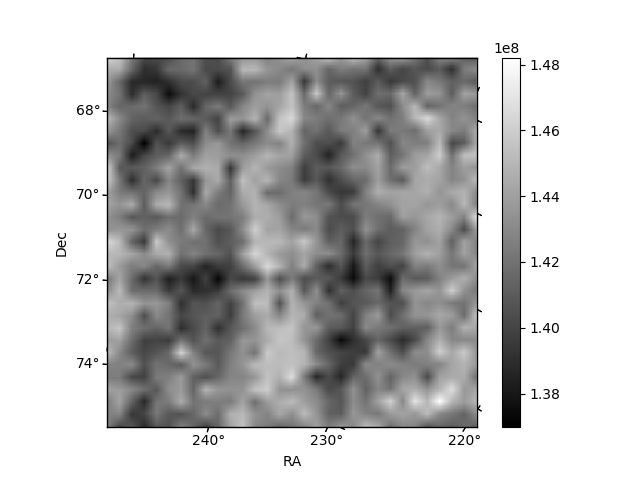
Histogram calculated using DETX and DETY for each event in the final _common_clean file
| Quadrant A |  |
 |
Quadrant B |
|---|---|---|---|
| Quadrant D | 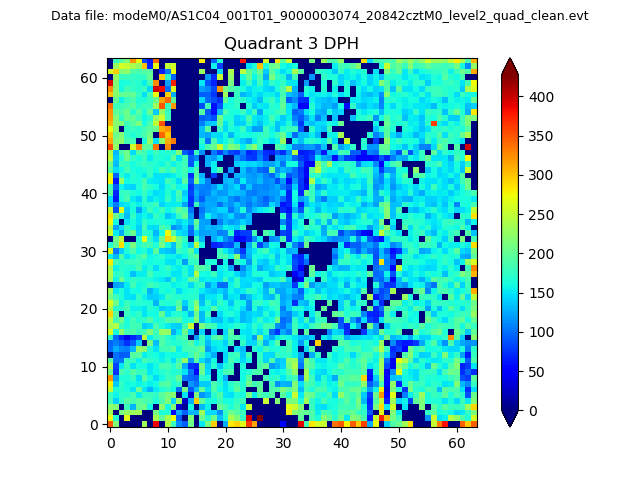 |
 |
Quadrant C |
| Plot type | Count rate plots | Images |
|---|---|---|
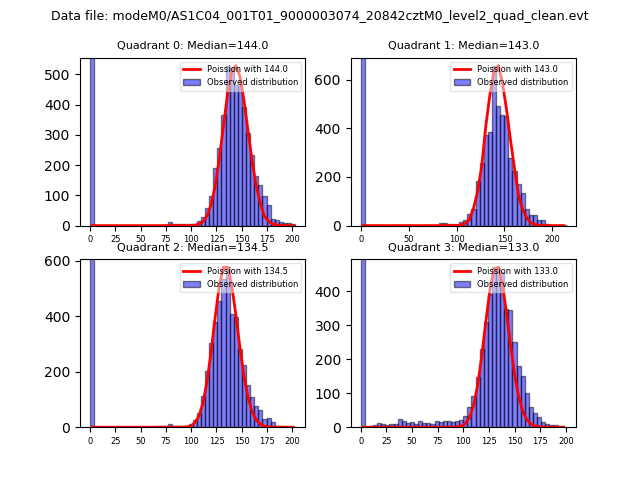
| Comparison with Poisson distribution Blue bars denote a histogram of data divided into 1 sec bins. Red curve is a Poisson curve with rate = median count rate of data. |
 |
 |
| Quadrant-wise count rates Data is divided into 100 sec bins |
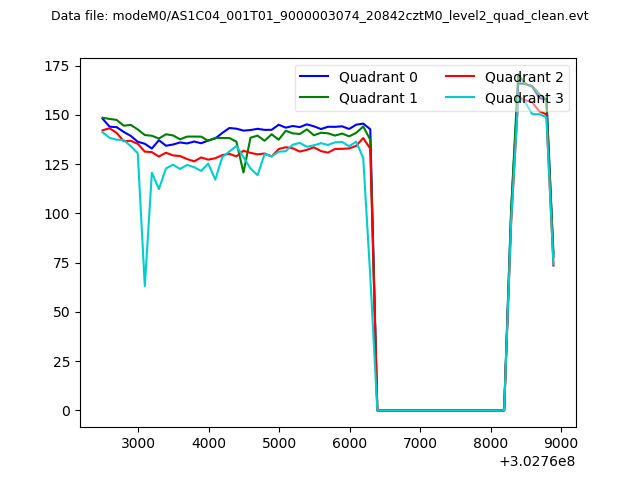 |
|
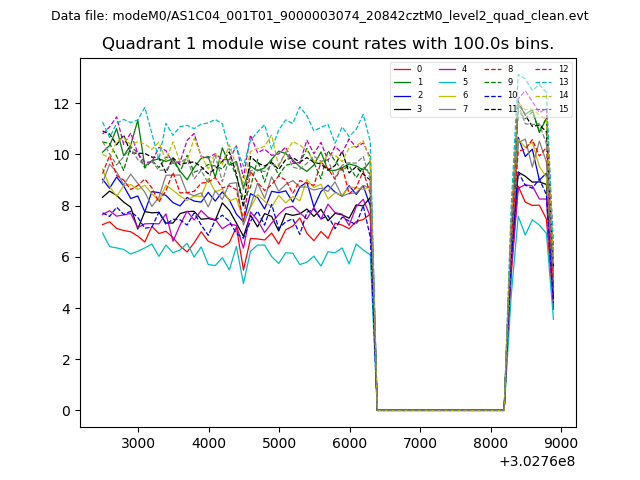
| Module-wise count rates for Quadrant A Data is divided into 100 sec bins |
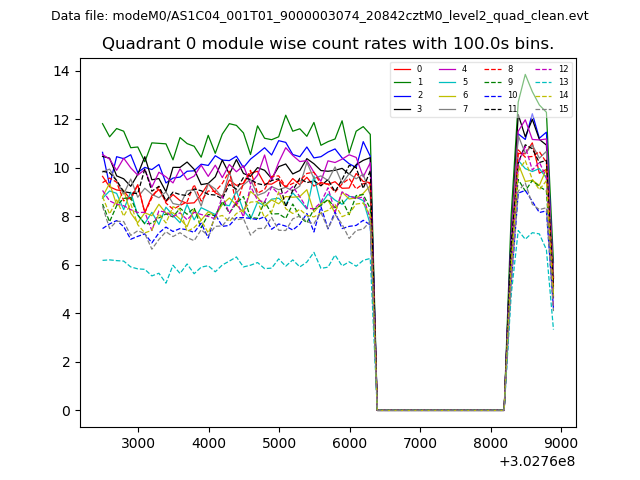 |
 |
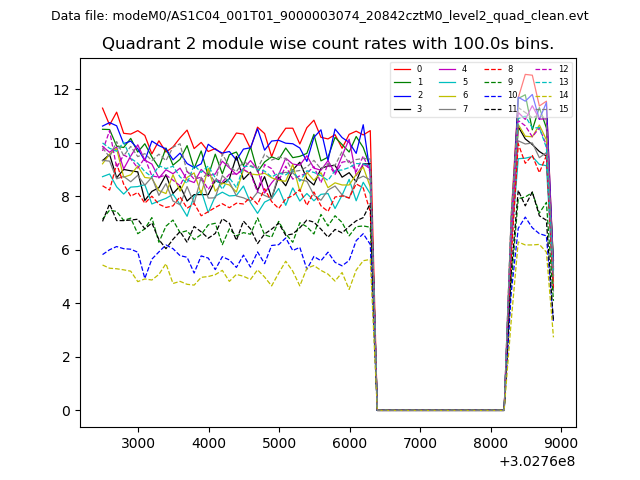
| Module-wise count rates for Quadrant B Data is divided into 100 sec bins |
 |
 |
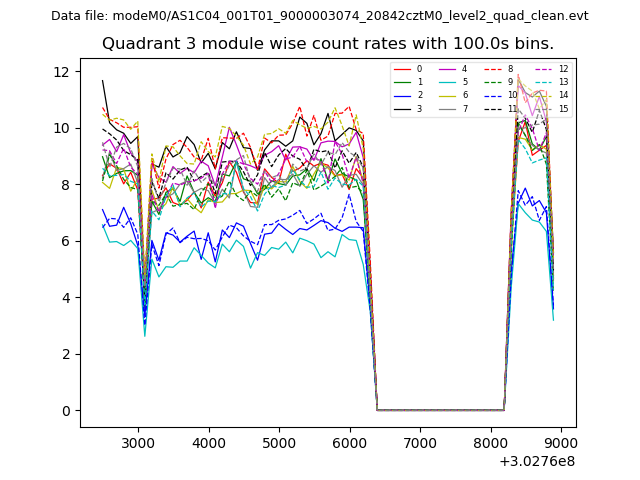
| Module-wise count rates for Quadrant C Data is divided into 100 sec bins |
 |
 |
| Module-wise count rates for Quadrant D Data is divided into 100 sec bins |
 |
 |
| Parameter | Plot |
|---|---|
| CZT HV Monitor | 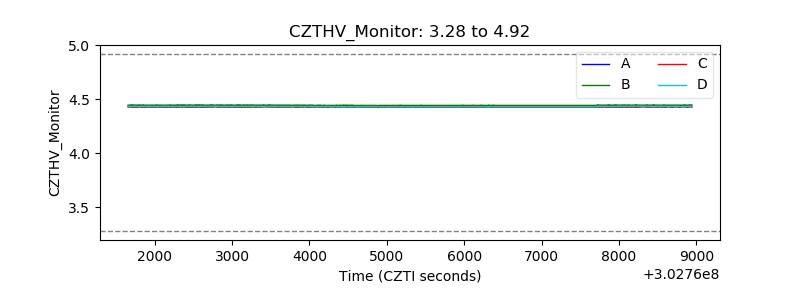 |
| D_VDD | 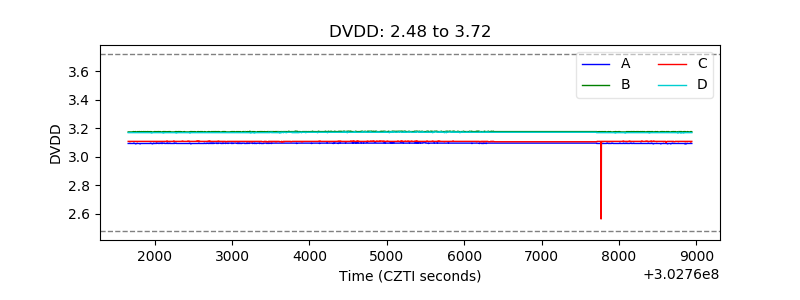 |
| Temperature 1 | 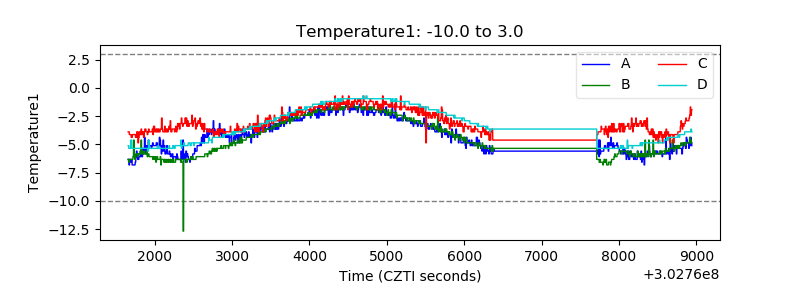 |
| Veto HV Monitor | 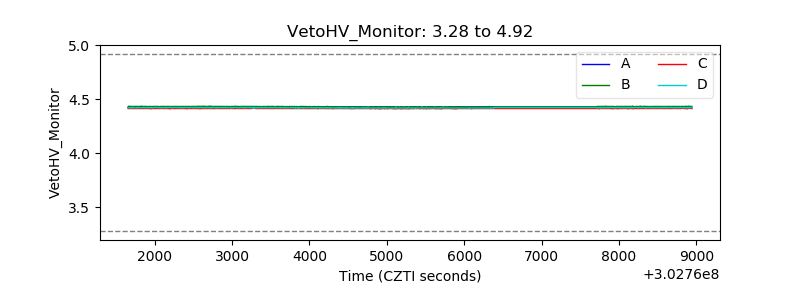 |
| Veto LLD | 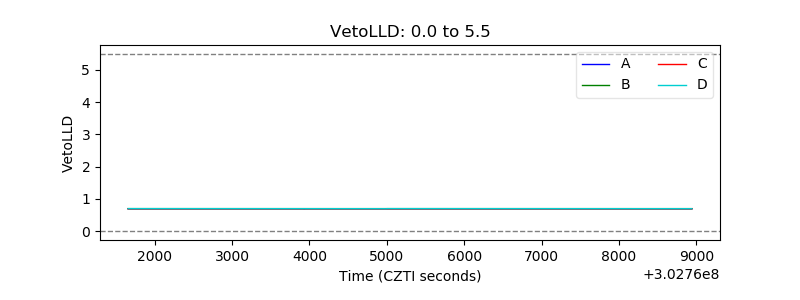 |
| Alpha Counter | 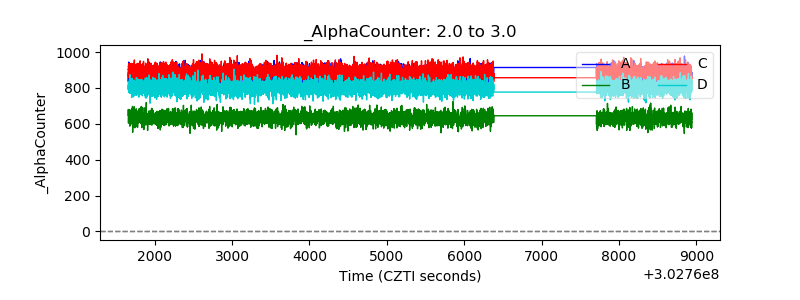 |
| _CPM_Rate |  |
| CZT Counter | 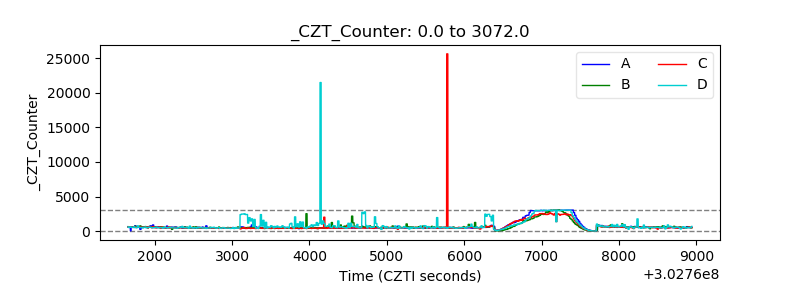 |
| +2.5 Volts monitor | 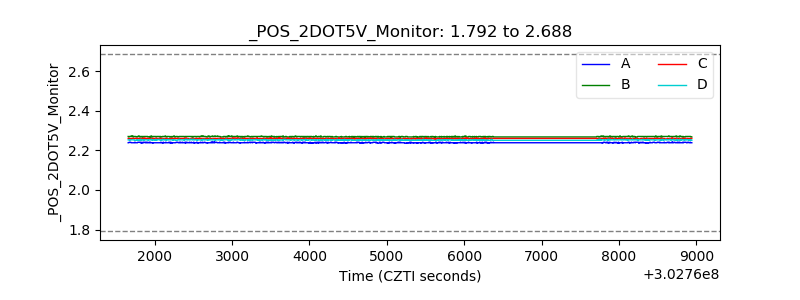 |
| +5 Volts monitor |  |
| _ROLL_ROT | 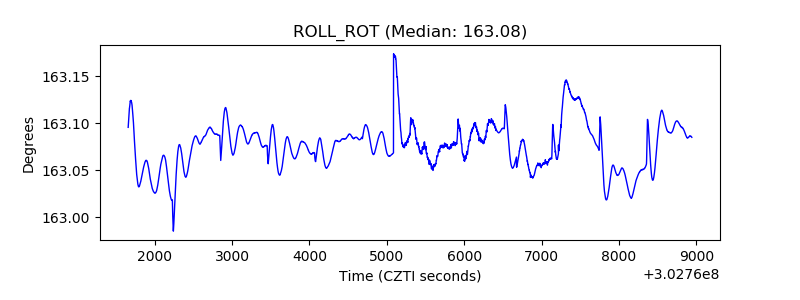 |
| _Roll_DEC | 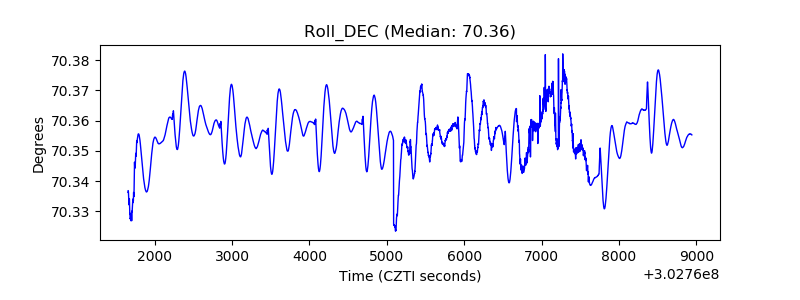 |
| _Roll_RA |  |
| Veto Counter | 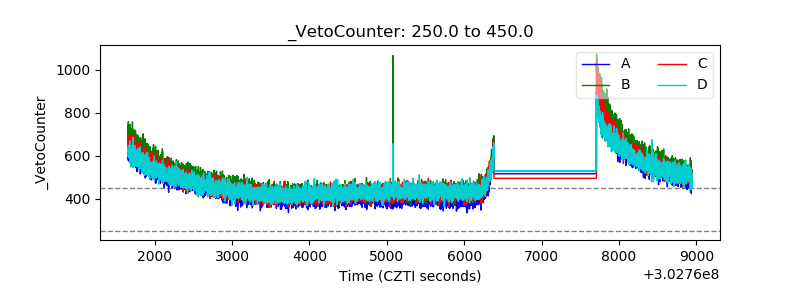 |