| Param | Original file | Final file |
|---|---|---|
| Filename | modeM0/AS1C04_001T01_9000003074_20843cztM0_level2.evt | modeM0/AS1C04_001T01_9000003074_20843cztM0_level2_quad_clean.evt |
| Size (bytes) | 420,085,440 | 112,317,120 |
| Size | 400.6 MB | 107.1 MB |
| Events in quadrant A | 2,851,237 | 788,612 |
| Events in quadrant B | 3,478,785 | 767,976 |
| Events in quadrant C | 2,769,502 | 731,423 |
| Events in quadrant D | 3,250,665 | 730,992 |
| Mode M0 | |||
|---|---|---|---|
| Quadrant | BADHDUFLAG | Total packets | Discarded packets |
| A | 0 | 12117 | 512 |
| B | 0 | 14234 | 545 |
| C | 0 | 11956 | 531 |
| D | 0 | 13538 | 550 |
| Mode M9 | |||
|---|---|---|---|
| Quadrant | BADHDUFLAG | Total packets | Discarded packets |
| A | 0 | 14 | 0 |
| B | 0 | 14 | 0 |
| C | 0 | 14 | 0 |
| D | 0 | 14 | 0 |
| Mode SS | |||
|---|---|---|---|
| Quadrant | BADHDUFLAG | Total packets | Discarded packets |
| A | 0 | 114 | 0 |
| B | 0 | 114 | 6 |
| C | 0 | 116 | 4 |
| D | 0 | 116 | 4 |
| Quadrant | Total seconds | Saturated seconds | Saturation percentage |
|---|---|---|---|
| A | 5477 | 66 | 1.205039% |
| B | 5470 | 225 | 4.113346% |
| C | 5467 | 77 | 1.408451% |
| D | 5471 | 102 | 1.864376% |
Noise dominated data is calculated using 1-second bins in cleaned event files. If a bin has >2000 counts, and if more than 50% of those come from <1% of pixels, then it is considered to be noise-dominated and hence unusable.
| Quadrant | # 1 sec bins | Bins with >0 counts | Bins with >2000 counts | High rate bins dominated by noise | Noise dominated (total time) | Noise dominated (detector-on time) | Marked lightcurve |
|---|---|---|---|---|---|---|---|
| A | 7135 | 5538 | 0 | 0 | 0.00% | 0.00% | 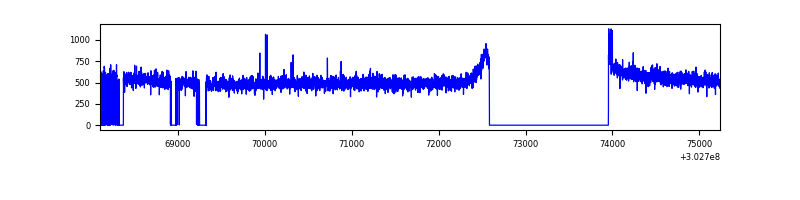 |
| B | 7124 | 5520 | 128 | 128 | 1.80% | 2.32% | 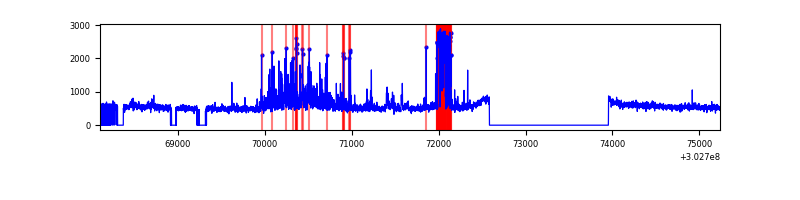 |
| C | 7134 | 5519 | 0 | 0 | 0.00% | 0.00% | 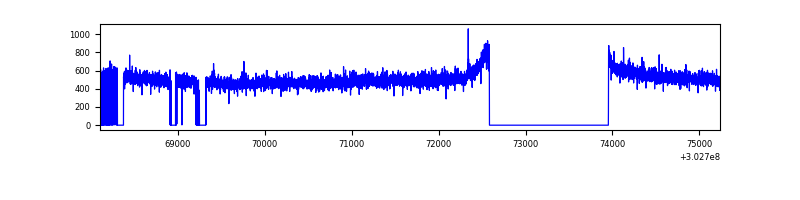 |
| D | 7132 | 5526 | 46 | 46 | 0.64% | 0.83% | 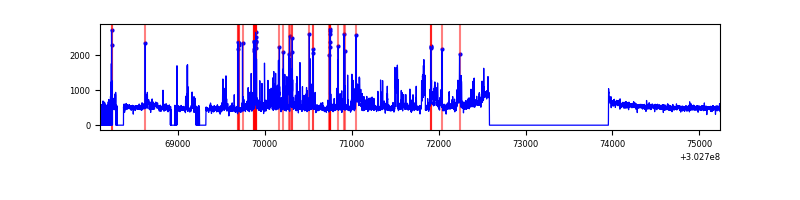 |
Top three noisy pixels from each quadrant. If the there are fewer than three noisy pixels in the level2.evt file, extra rows are filled as -1
| Pixel properties | Quadrant properties | ||||||
|---|---|---|---|---|---|---|---|
| Quadrant | DetID | PixID | Counts | Sigma | Mean | Median | Sigma |
| A | 2 | 79 | 18528 | 122.33 | 733 | 721 | 145.6 |
| A | 8 | 205 | 10105 | 64.46 | 733 | 721 | 145.6 |
| A | 6 | 16 | 6565 | 40.14 | 733 | 721 | 145.6 |
| B | 3 | 64 | 312219 | 2376.65 | 709 | 693 | 131.1 |
| B | 7 | 220 | 223543 | 1700.13 | 709 | 693 | 131.1 |
| B | 0 | 189 | 86886 | 657.57 | 709 | 693 | 131.1 |
| C | 14 | 238 | 110258 | 708.47 | 678 | 684 | 154.7 |
| C | 3 | 233 | 7675 | 45.2 | 678 | 684 | 154.7 |
| C | 13 | 61 | 4852 | 26.95 | 678 | 684 | 154.7 |
| D | 1 | 52 | 296245 | 1764.85 | 701 | 682 | 167.5 |
| D | 7 | 38 | 126194 | 749.45 | 701 | 682 | 167.5 |
| D | 9 | 1 | 87453 | 518.12 | 701 | 682 | 167.5 |
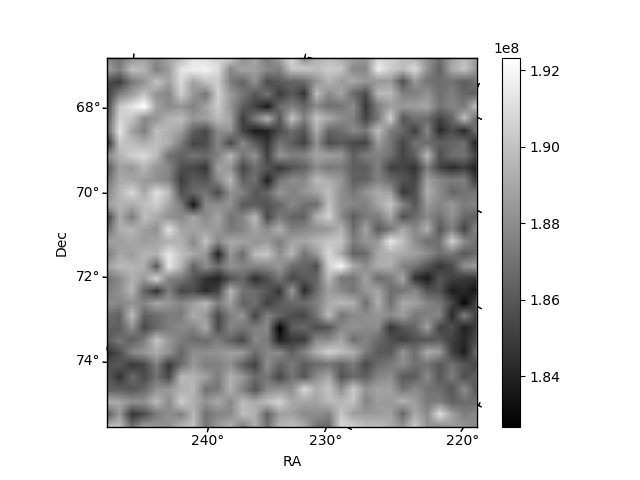
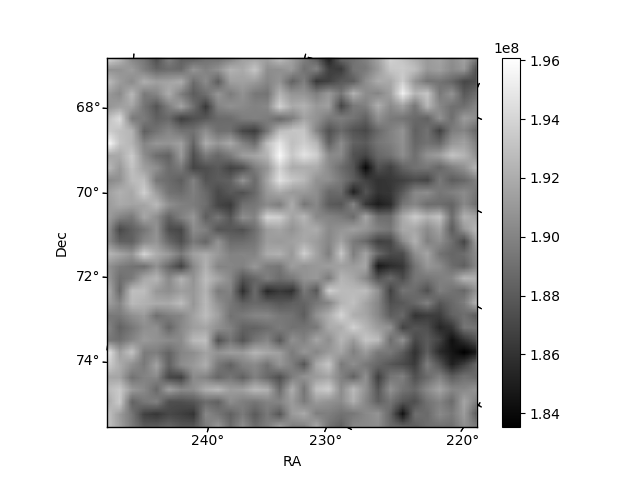
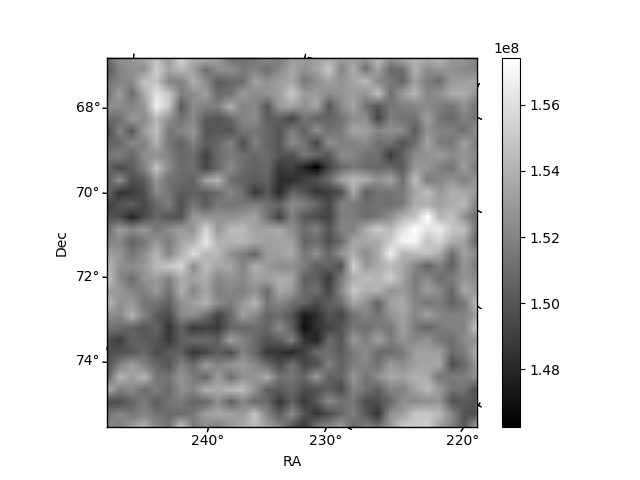
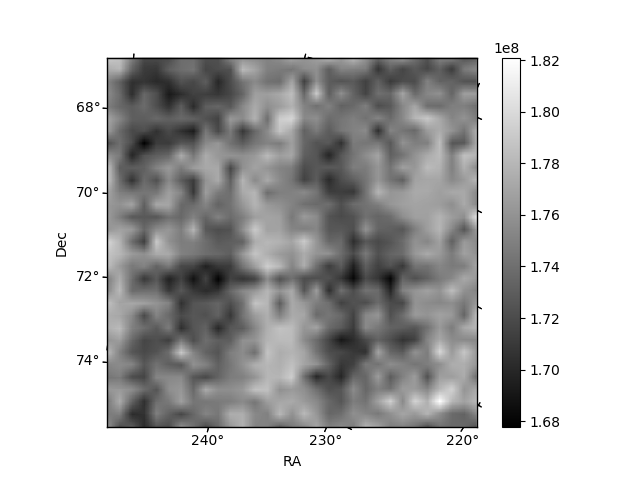
Histogram calculated using DETX and DETY for each event in the final _common_clean file
| Quadrant A |  |
 |
Quadrant B |
|---|---|---|---|
| Quadrant D | 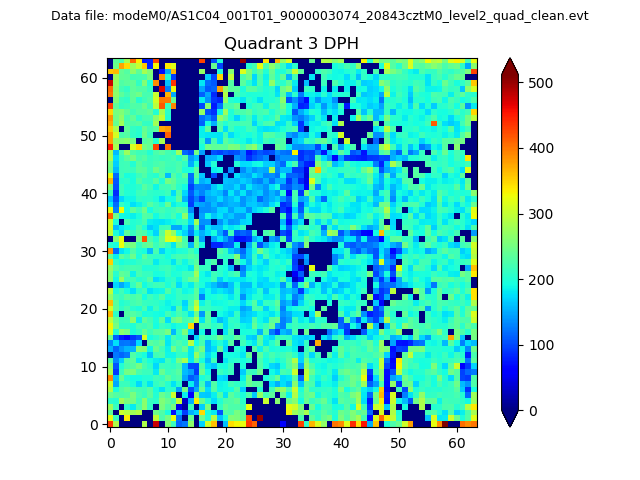 |
 |
Quadrant C |
| Plot type | Count rate plots | Images |
|---|---|---|
| Comparison with Poisson distribution Blue bars denote a histogram of data divided into 1 sec bins. Red curve is a Poisson curve with rate = median count rate of data. |
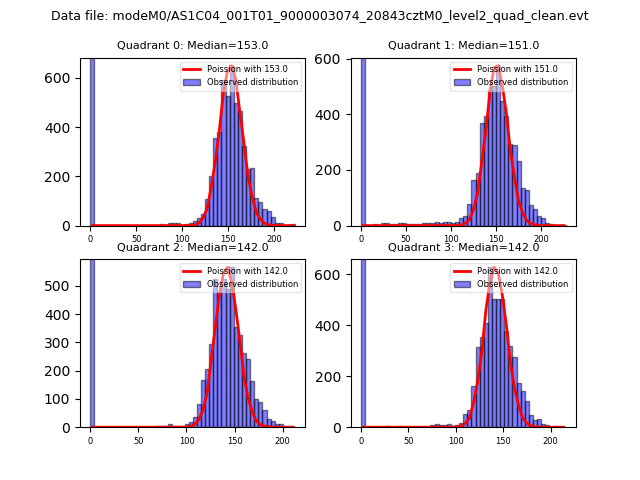 |
 |
| Quadrant-wise count rates Data is divided into 100 sec bins |
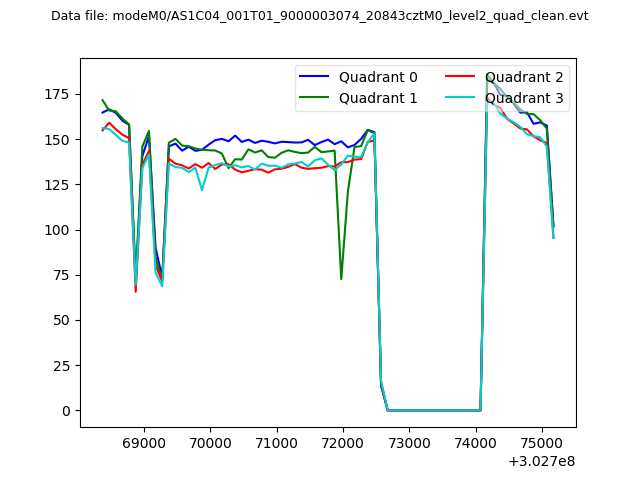 |
|
| Module-wise count rates for Quadrant A Data is divided into 100 sec bins |
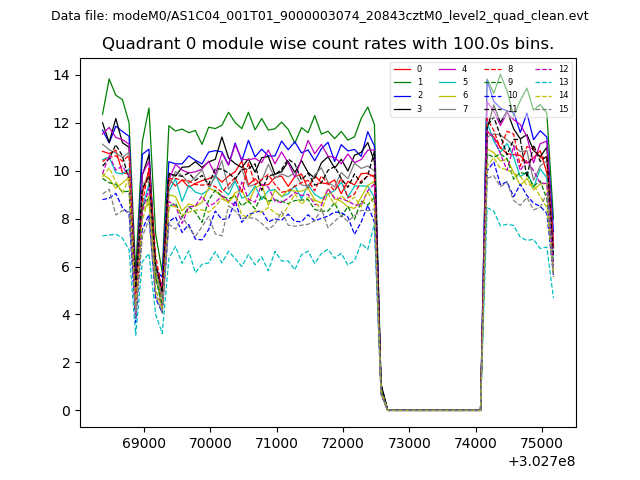 |
 |
| Module-wise count rates for Quadrant B Data is divided into 100 sec bins |
 |
 |
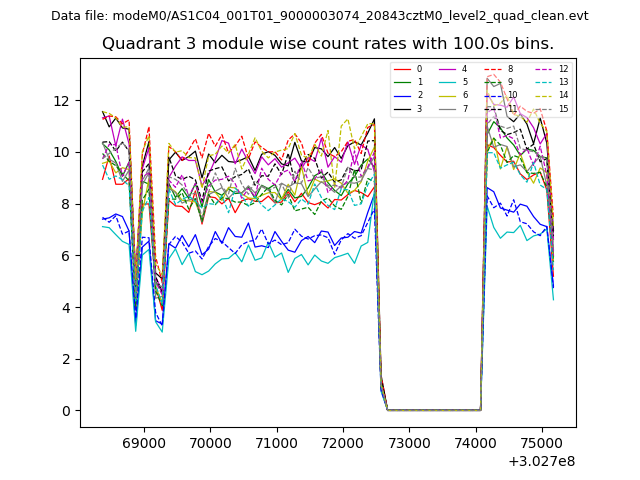
| Module-wise count rates for Quadrant C Data is divided into 100 sec bins |
 |
 |
| Module-wise count rates for Quadrant D Data is divided into 100 sec bins |
 |
 |
| Parameter | Plot |
|---|---|
| CZT HV Monitor |  |
| D_VDD | 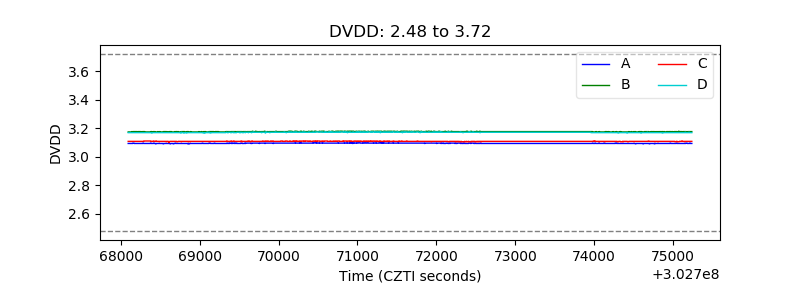 |
| Temperature 1 | 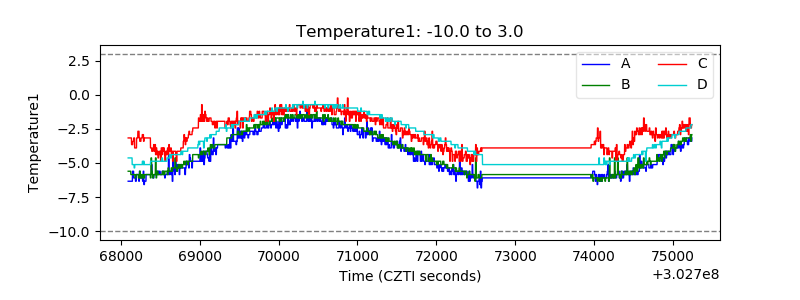 |
| Veto HV Monitor | 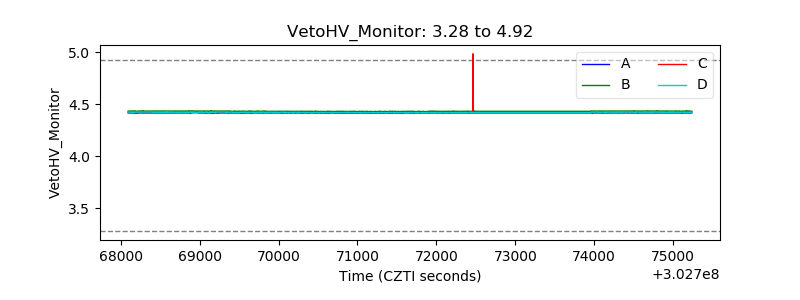 |
| Veto LLD | 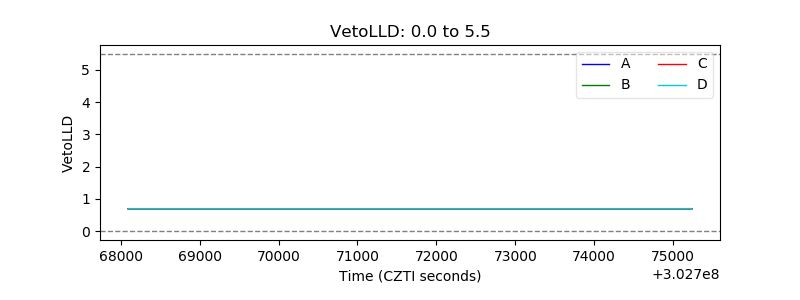 |
| Alpha Counter | 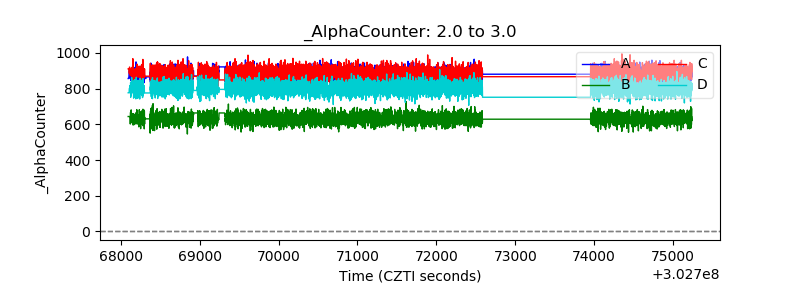 |
| _CPM_Rate | 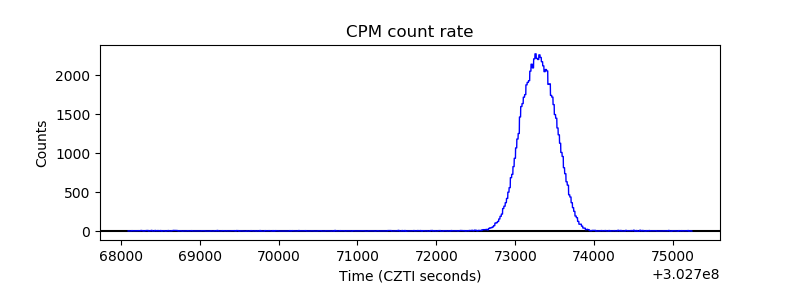 |
| CZT Counter | 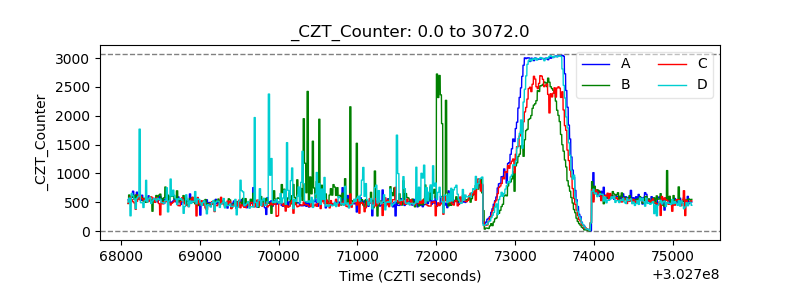 |
| +2.5 Volts monitor |  |
| +5 Volts monitor | 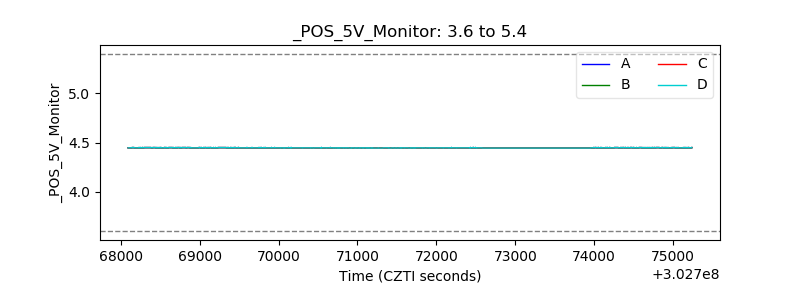 |
| _ROLL_ROT | 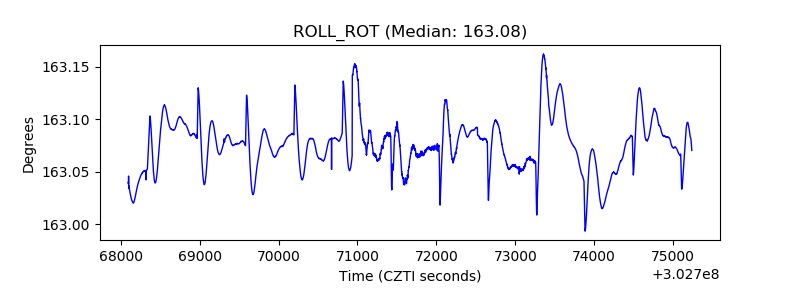 |
| _Roll_DEC | 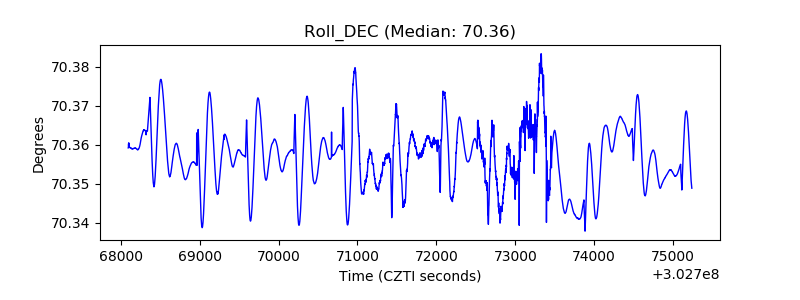 |
| _Roll_RA | 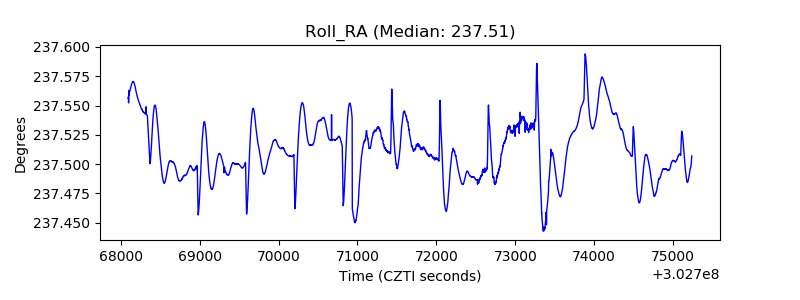 |
| Veto Counter | 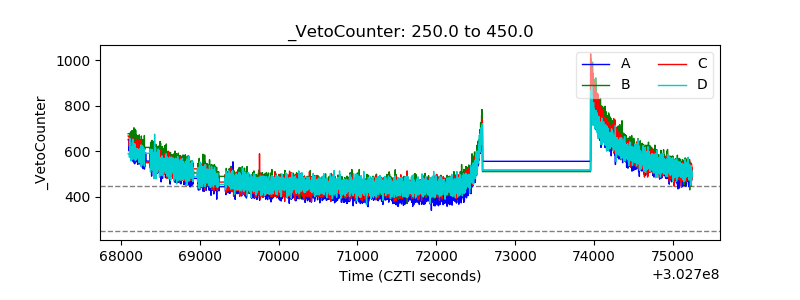 |