| Param | Original file | Final file |
|---|---|---|
| Filename | modeM0/AS1C04_001T01_9000003074_20844cztM0_level2.evt | modeM0/AS1C04_001T01_9000003074_20844cztM0_level2_quad_clean.evt |
| Size (bytes) | 476,533,440 | 131,667,840 |
| Size | 454.5 MB | 125.6 MB |
| Events in quadrant A | 3,330,546 | 924,431 |
| Events in quadrant B | 3,613,204 | 910,977 |
| Events in quadrant C | 3,155,093 | 858,154 |
| Events in quadrant D | 3,912,451 | 862,009 |
| Mode M0 | |||
|---|---|---|---|
| Quadrant | BADHDUFLAG | Total packets | Discarded packets |
| A | 0 | 13569 | 2 |
| B | 0 | 14502 | 2 |
| C | 0 | 13020 | 2 |
| D | 0 | 15472 | 2 |
| Mode M9 | |||
|---|---|---|---|
| Quadrant | BADHDUFLAG | Total packets | Discarded packets |
| A | 0 | 13 | 0 |
| B | 0 | 14 | 0 |
| C | 0 | 14 | 0 |
| D | 0 | 14 | 0 |
| Mode SS | |||
|---|---|---|---|
| Quadrant | BADHDUFLAG | Total packets | Discarded packets |
| A | 0 | 126 | 0 |
| B | 0 | 126 | 0 |
| C | 0 | 126 | 0 |
| D | 0 | 126 | 0 |
| Quadrant | Total seconds | Saturated seconds | Saturation percentage |
|---|---|---|---|
| A | 6193 | 102 | 1.647021% |
| B | 6193 | 139 | 2.244470% |
| C | 6193 | 124 | 2.002261% |
| D | 6193 | 141 | 2.276764% |
Noise dominated data is calculated using 1-second bins in cleaned event files. If a bin has >2000 counts, and if more than 50% of those come from <1% of pixels, then it is considered to be noise-dominated and hence unusable.
| Quadrant | # 1 sec bins | Bins with >0 counts | Bins with >2000 counts | High rate bins dominated by noise | Noise dominated (total time) | Noise dominated (detector-on time) | Marked lightcurve |
|---|---|---|---|---|---|---|---|
| A | 7523 | 6193 | 0 | 0 | 0.00% | 0.00% | 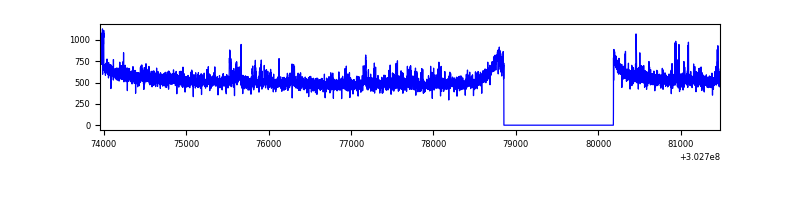 |
| B | 7522 | 6192 | 25 | 25 | 0.33% | 0.40% | 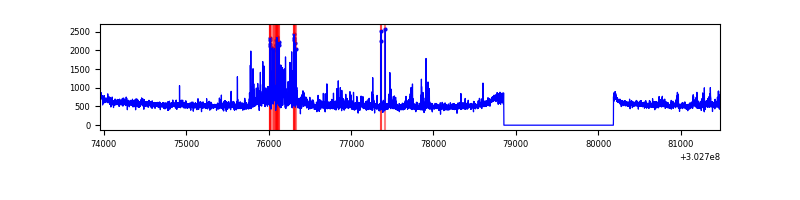 |
| C | 7523 | 6193 | 0 | 0 | 0.00% | 0.00% | 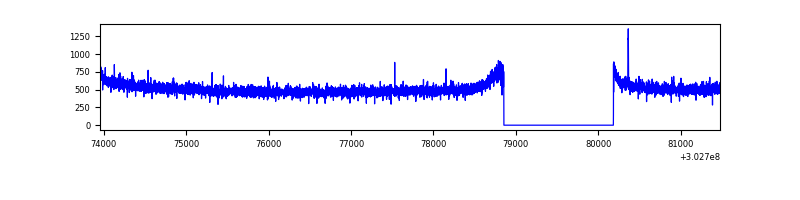 |
| D | 7523 | 6193 | 79 | 79 | 1.05% | 1.28% | 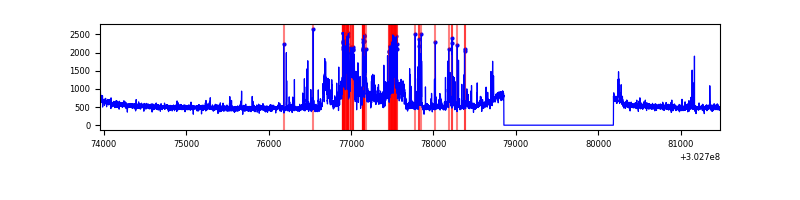 |
Top three noisy pixels from each quadrant. If the there are fewer than three noisy pixels in the level2.evt file, extra rows are filled as -1
| Pixel properties | Quadrant properties | ||||||
|---|---|---|---|---|---|---|---|
| Quadrant | DetID | PixID | Counts | Sigma | Mean | Median | Sigma |
| A | 2 | 79 | 121237 | 731.21 | 832 | 817 | 164.7 |
| A | 8 | 205 | 10727 | 60.18 | 832 | 817 | 164.7 |
| A | 0 | 226 | 7576 | 41.04 | 832 | 817 | 164.7 |
| B | 7 | 220 | 174087 | 1163.02 | 812 | 793 | 149.0 |
| B | 0 | 189 | 173891 | 1161.71 | 812 | 793 | 149.0 |
| B | 0 | 229 | 18314 | 117.59 | 812 | 793 | 149.0 |
| C | 14 | 238 | 126282 | 717.13 | 771 | 774 | 175.0 |
| C | 3 | 233 | 13811 | 74.49 | 771 | 774 | 175.0 |
| C | 9 | 54 | 7018 | 35.68 | 771 | 774 | 175.0 |
| D | 7 | 38 | 457862 | 2385.25 | 800 | 780 | 191.6 |
| D | 1 | 52 | 178740 | 928.67 | 800 | 780 | 191.6 |
| D | 9 | 1 | 75904 | 392.03 | 800 | 780 | 191.6 |
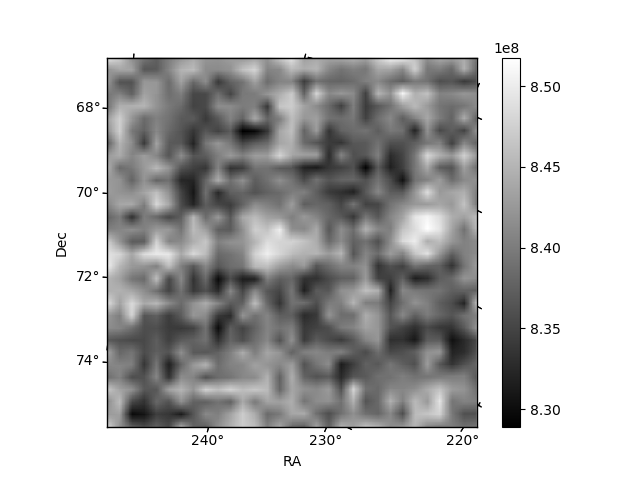
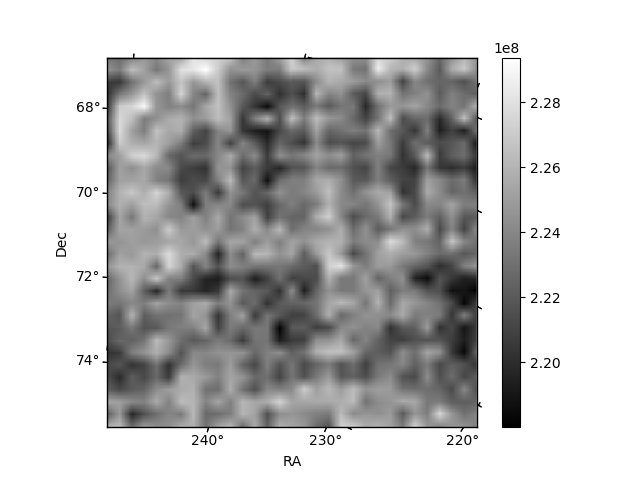
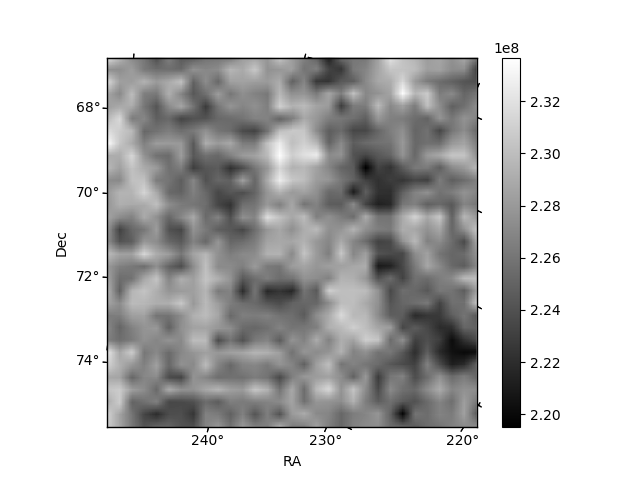
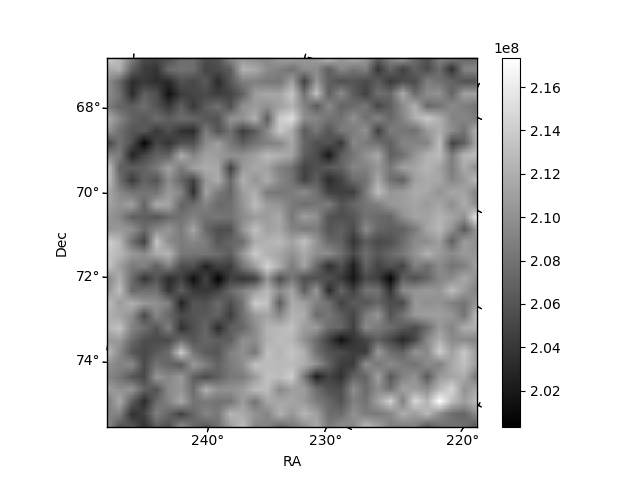
Histogram calculated using DETX and DETY for each event in the final _common_clean file
| Quadrant A | 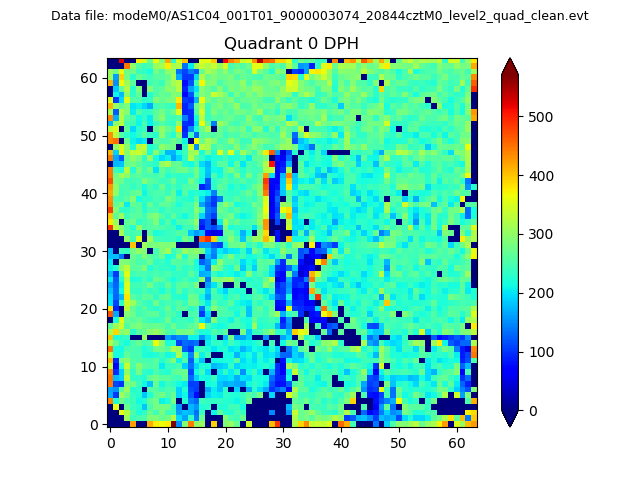 |
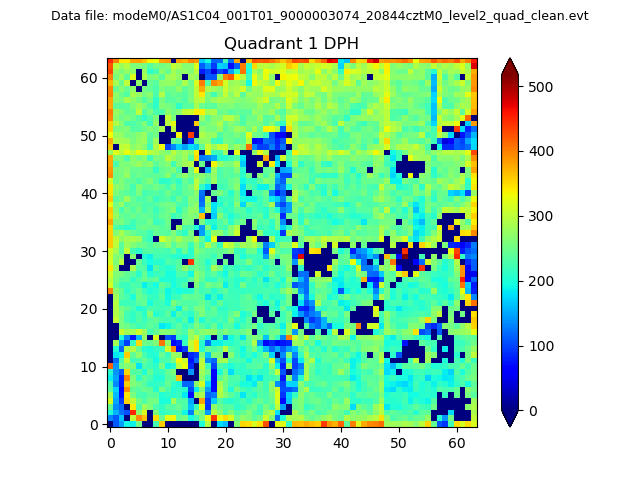 |
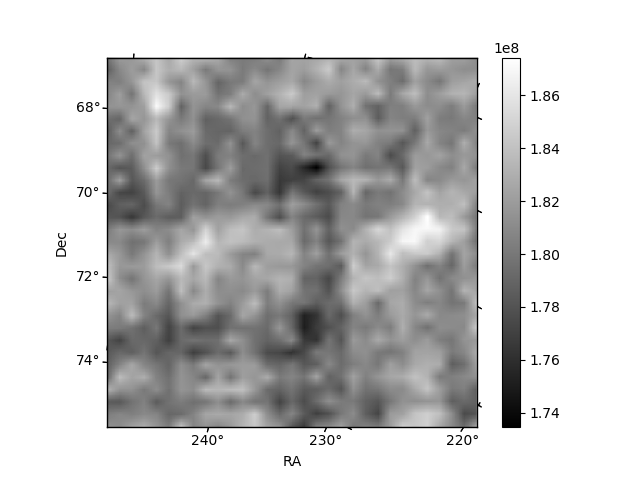
Quadrant B |
|---|---|---|---|
| Quadrant D | 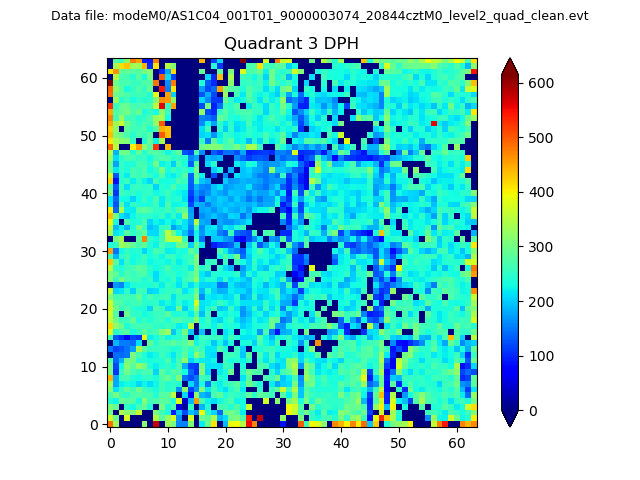 |
 |
Quadrant C |
| Plot type | Count rate plots | Images |
|---|---|---|
| Comparison with Poisson distribution Blue bars denote a histogram of data divided into 1 sec bins. Red curve is a Poisson curve with rate = median count rate of data. |
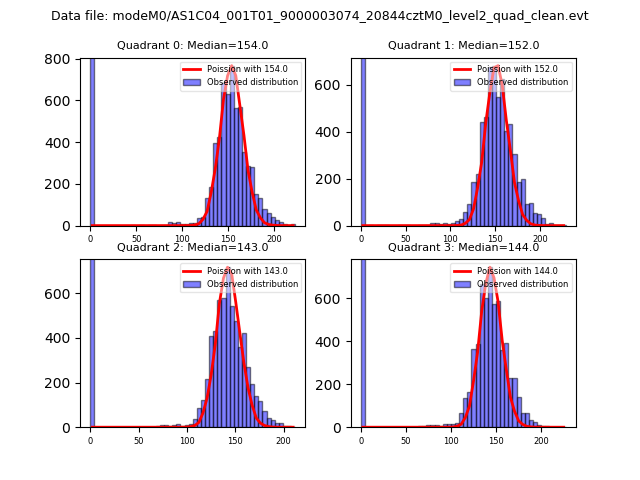 |
 |
| Quadrant-wise count rates Data is divided into 100 sec bins |
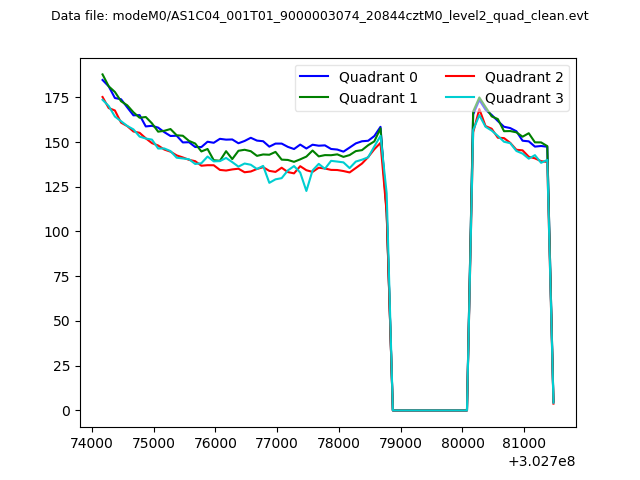 |
|
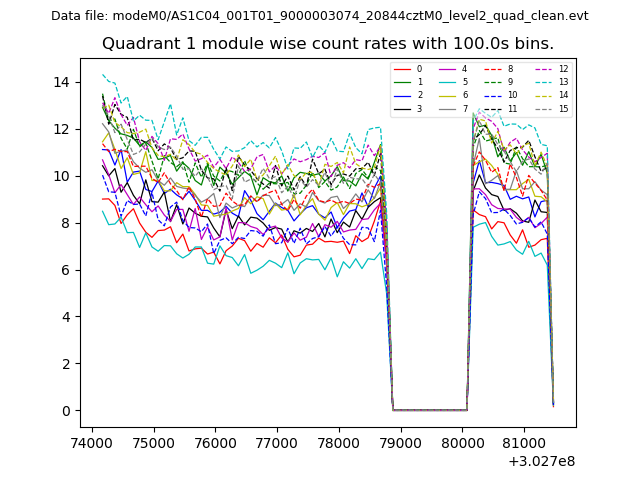
| Module-wise count rates for Quadrant A Data is divided into 100 sec bins |
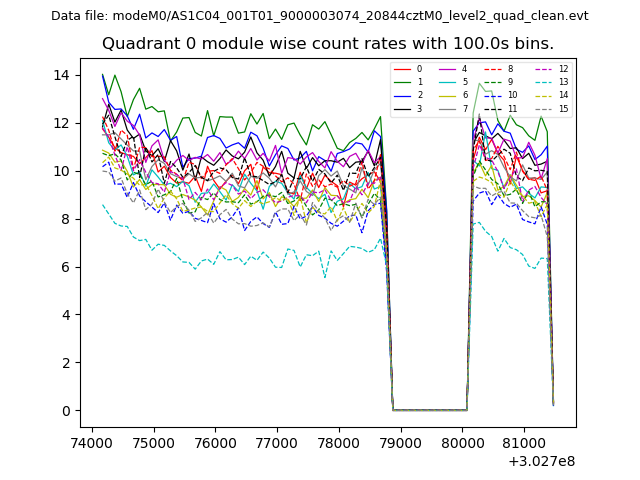 |
 |
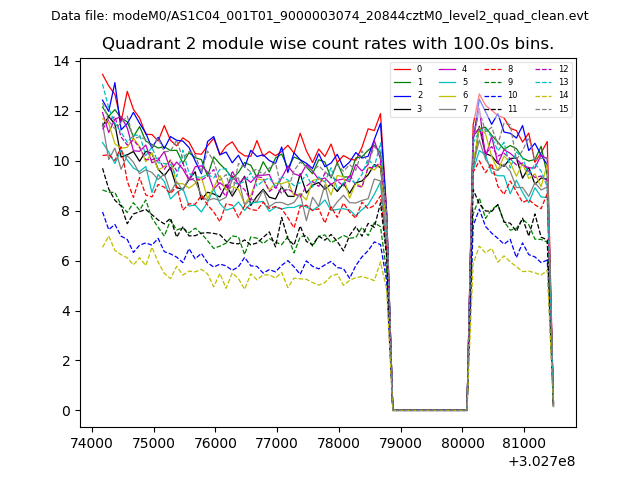
| Module-wise count rates for Quadrant B Data is divided into 100 sec bins |
 |
 |
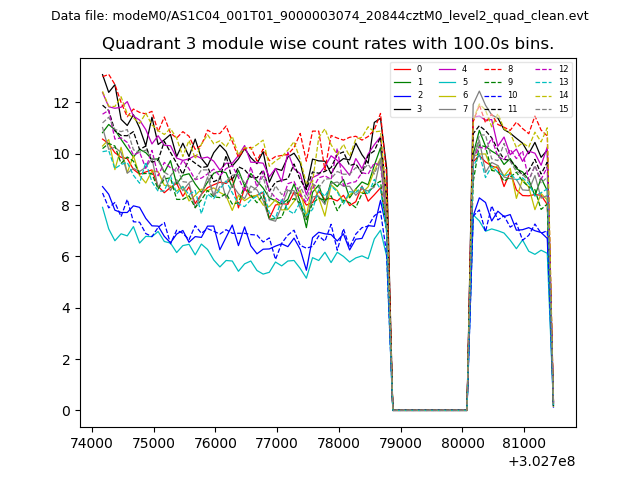
| Module-wise count rates for Quadrant C Data is divided into 100 sec bins |
 |
 |
| Module-wise count rates for Quadrant D Data is divided into 100 sec bins |
 |
 |
| Parameter | Plot |
|---|---|
| CZT HV Monitor | 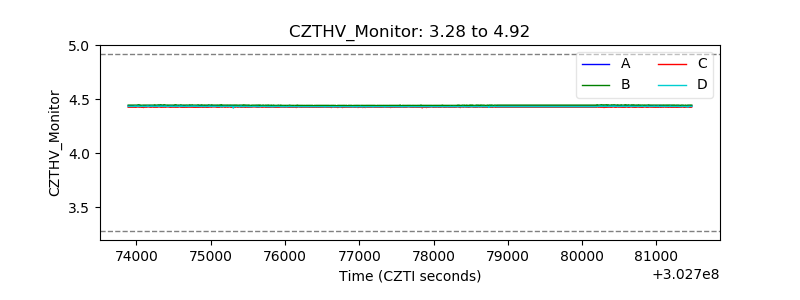 |
| D_VDD | 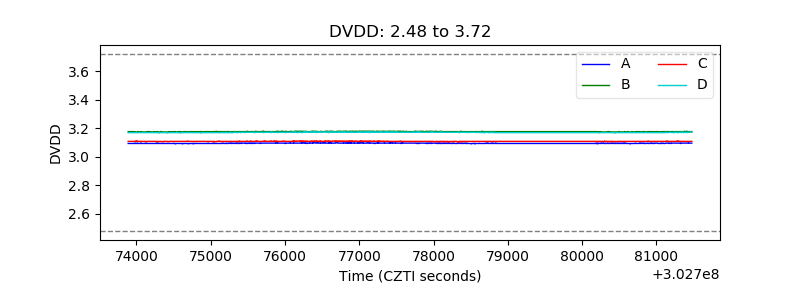 |
| Temperature 1 | 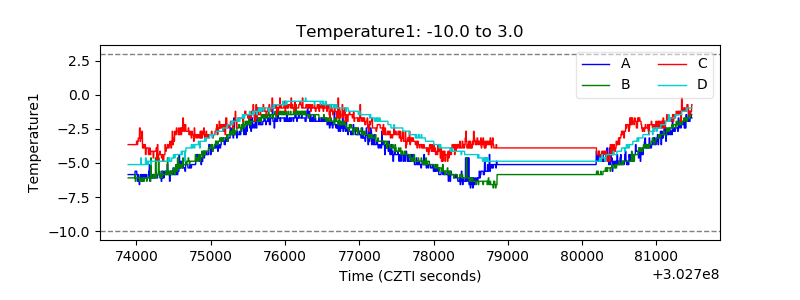 |
| Veto HV Monitor | 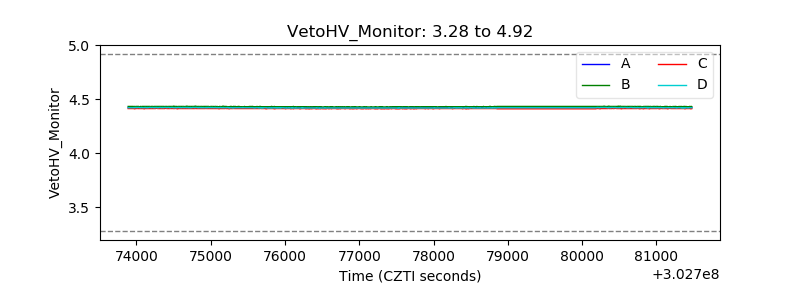 |
| Veto LLD | 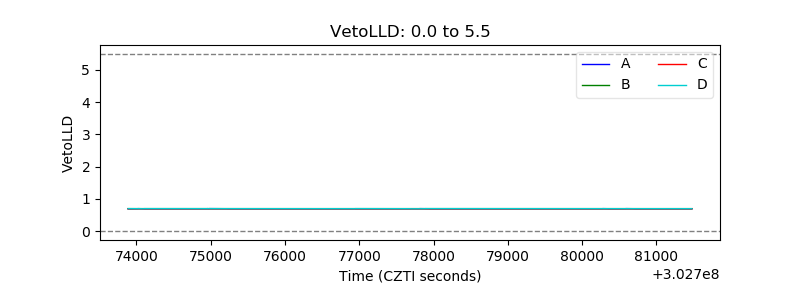 |
| Alpha Counter | 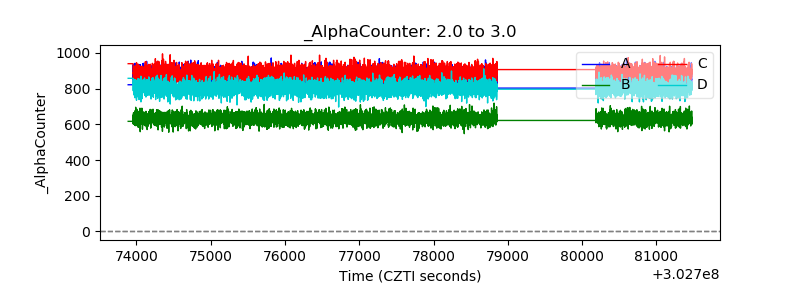 |
| _CPM_Rate | 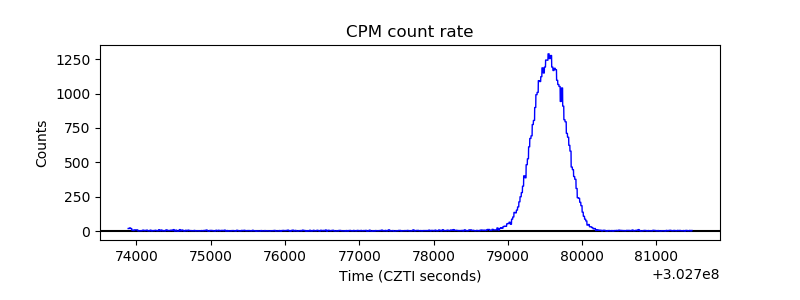 |
| CZT Counter | 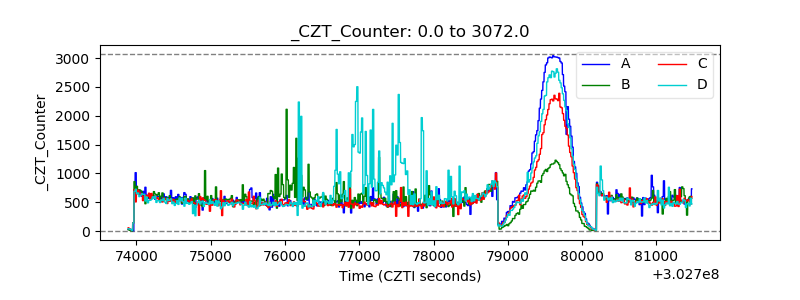 |
| +2.5 Volts monitor |  |
| +5 Volts monitor | 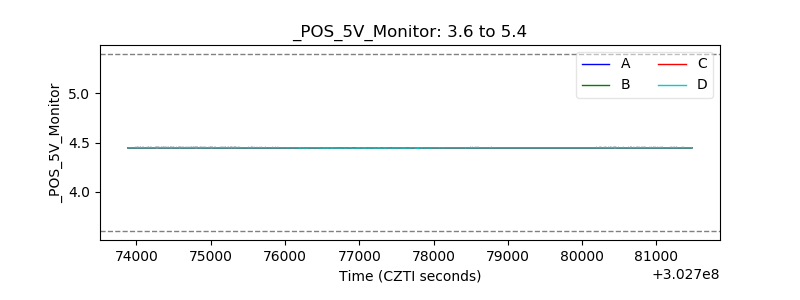 |
| _ROLL_ROT | 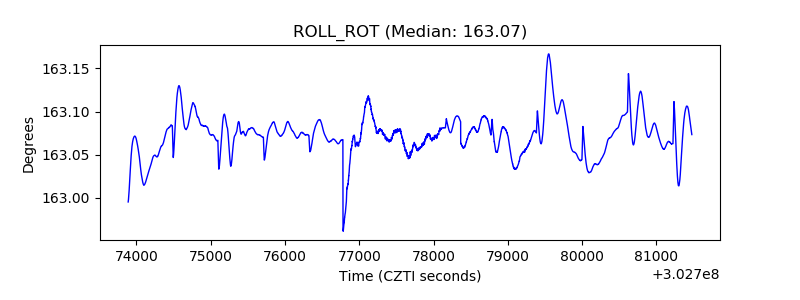 |
| _Roll_DEC | 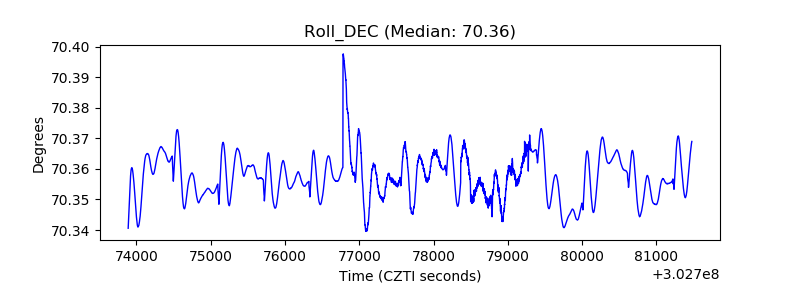 |
| _Roll_RA | 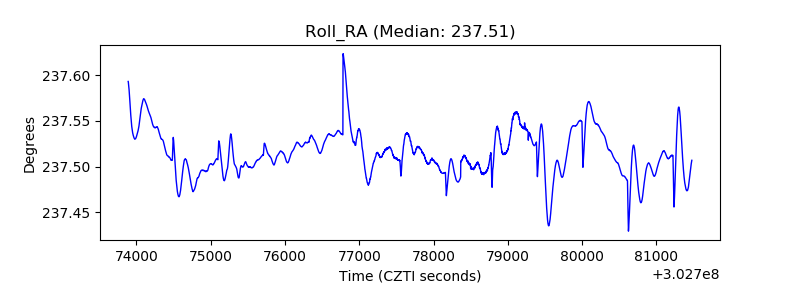 |
| Veto Counter | 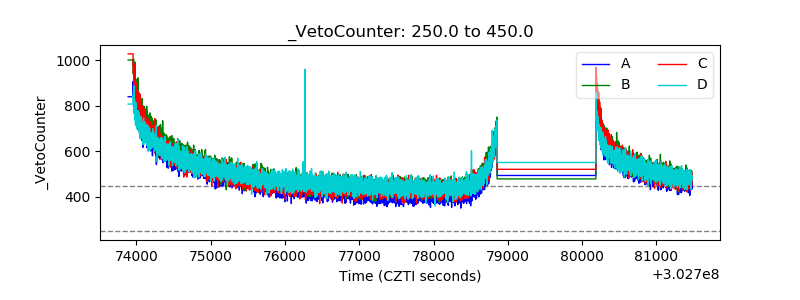 |