| Param | Original file | Final file |
|---|---|---|
| Filename | modeM0/AS1C04_001T01_9000003074_20845cztM0_level2.evt | modeM0/AS1C04_001T01_9000003074_20845cztM0_level2_quad_clean.evt |
| Size (bytes) | 484,819,200 | 115,698,240 |
| Size | 462.4 MB | 110.3 MB |
| Events in quadrant A | 3,006,304 | 808,423 |
| Events in quadrant B | 3,553,500 | 786,924 |
| Events in quadrant C | 2,997,400 | 751,497 |
| Events in quadrant D | 4,727,463 | 747,342 |
| Mode M0 | |||
|---|---|---|---|
| Quadrant | BADHDUFLAG | Total packets | Discarded packets |
| A | 0 | 12503 | 1 |
| B | 0 | 14279 | 1 |
| C | 0 | 12410 | 1 |
| D | 0 | 17746 | 1 |
| Mode M9 | |||
|---|---|---|---|
| Quadrant | BADHDUFLAG | Total packets | Discarded packets |
| A | 0 | 12 | 0 |
| B | 0 | 12 | 0 |
| C | 0 | 12 | 0 |
| D | 0 | 12 | 0 |
| Mode SS | |||
|---|---|---|---|
| Quadrant | BADHDUFLAG | Total packets | Discarded packets |
| A | 0 | 118 | 0 |
| B | 0 | 118 | 0 |
| C | 0 | 118 | 0 |
| D | 0 | 118 | 0 |
| Quadrant | Total seconds | Saturated seconds | Saturation percentage |
|---|---|---|---|
| A | 5872 | 88 | 1.498638% |
| B | 5873 | 162 | 2.758386% |
| C | 5872 | 142 | 2.418256% |
| D | 5872 | 289 | 4.921662% |
Noise dominated data is calculated using 1-second bins in cleaned event files. If a bin has >2000 counts, and if more than 50% of those come from <1% of pixels, then it is considered to be noise-dominated and hence unusable.
| Quadrant | # 1 sec bins | Bins with >0 counts | Bins with >2000 counts | High rate bins dominated by noise | Noise dominated (total time) | Noise dominated (detector-on time) | Marked lightcurve |
|---|---|---|---|---|---|---|---|
| A | 7042 | 5872 | 0 | 0 | 0.00% | 0.00% | 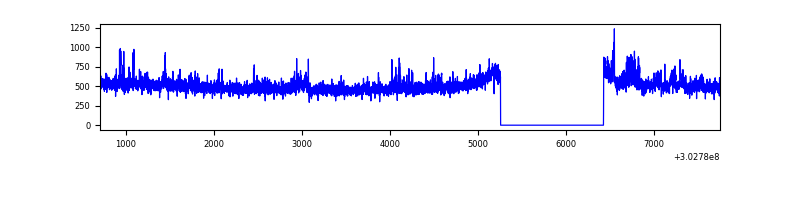 |
| B | 7043 | 5873 | 38 | 38 | 0.54% | 0.65% | 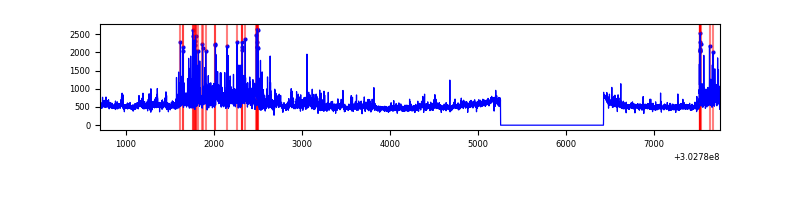 |
| C | 7041 | 5871 | 17 | 17 | 0.24% | 0.29% | 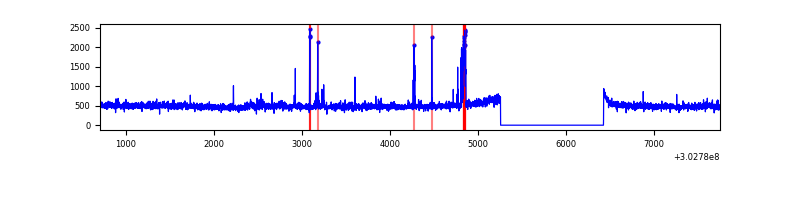 |
| D | 7041 | 5871 | 225 | 225 | 3.20% | 3.83% | 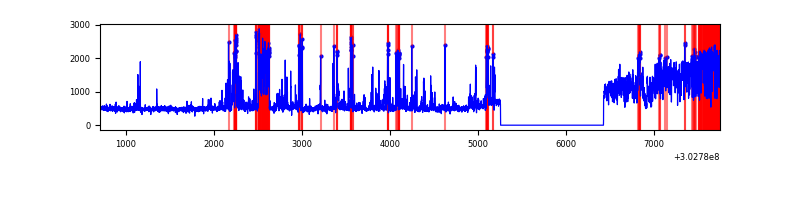 |
Top three noisy pixels from each quadrant. If the there are fewer than three noisy pixels in the level2.evt file, extra rows are filled as -1
| Pixel properties | Quadrant properties | ||||||
|---|---|---|---|---|---|---|---|
| Quadrant | DetID | PixID | Counts | Sigma | Mean | Median | Sigma |
| A | 2 | 79 | 144260 | 973.96 | 743 | 728 | 147.4 |
| A | 8 | 205 | 7774 | 47.81 | 743 | 728 | 147.4 |
| A | 0 | 226 | 6370 | 38.28 | 743 | 728 | 147.4 |
| B | 7 | 220 | 354549 | 2585.01 | 725 | 706 | 136.9 |
| B | 0 | 189 | 225442 | 1641.82 | 725 | 706 | 136.9 |
| B | 4 | 216 | 22878 | 161.98 | 725 | 706 | 136.9 |
| C | 14 | 238 | 111363 | 694.35 | 694 | 698 | 159.4 |
| C | 9 | 54 | 105084 | 654.95 | 694 | 698 | 159.4 |
| C | 3 | 233 | 65143 | 404.35 | 694 | 698 | 159.4 |
| D | 1 | 20 | 1340355 | 7858.2 | 716 | 697 | 170.5 |
| D | 9 | 1 | 179845 | 1050.85 | 716 | 697 | 170.5 |
| D | 13 | 153 | 167434 | 978.05 | 716 | 697 | 170.5 |
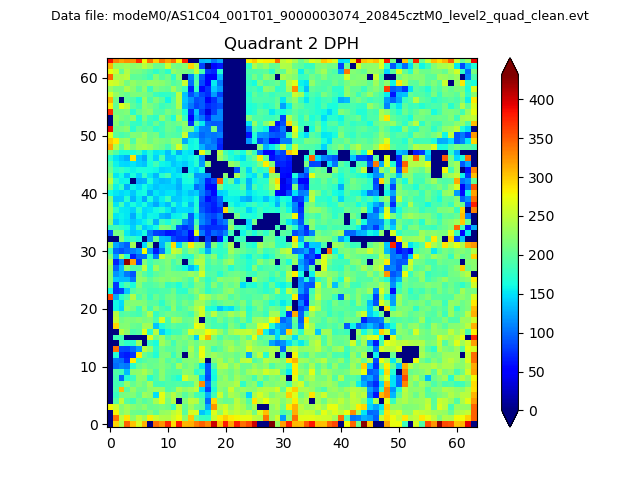
Histogram calculated using DETX and DETY for each event in the final _common_clean file
| Quadrant A | 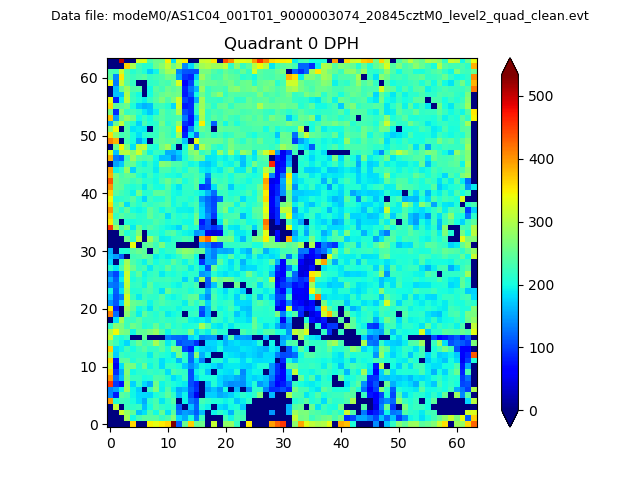 |
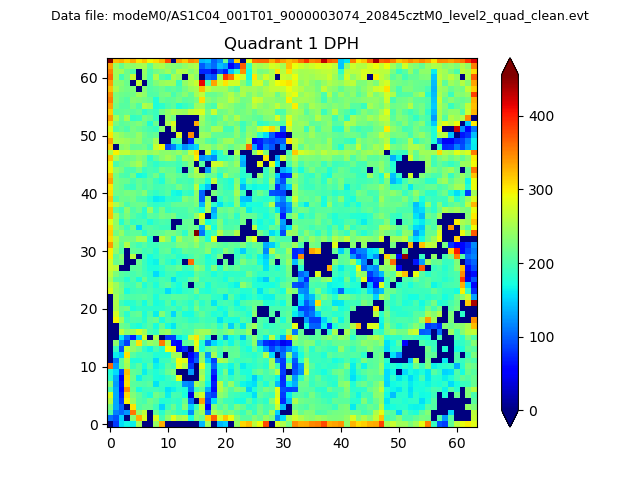 |
Quadrant B |
|---|---|---|---|
| Quadrant D | 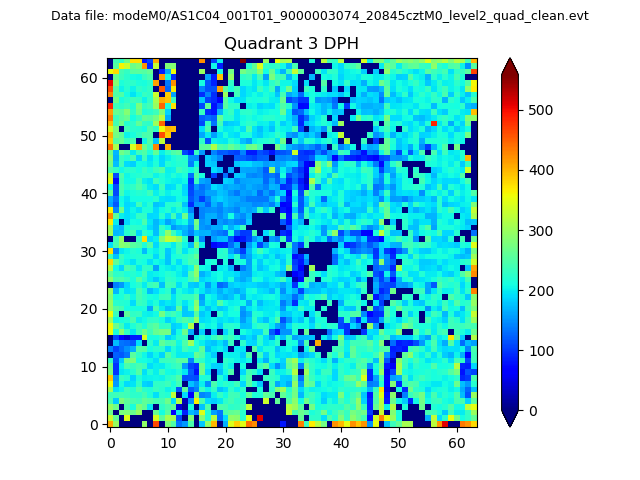 |
 |
Quadrant C |
| Plot type | Count rate plots | Images |
|---|---|---|
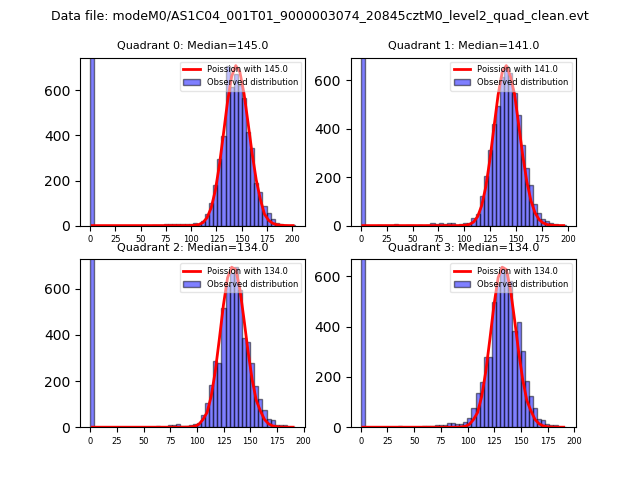
| Comparison with Poisson distribution Blue bars denote a histogram of data divided into 1 sec bins. Red curve is a Poisson curve with rate = median count rate of data. |
 |
 |
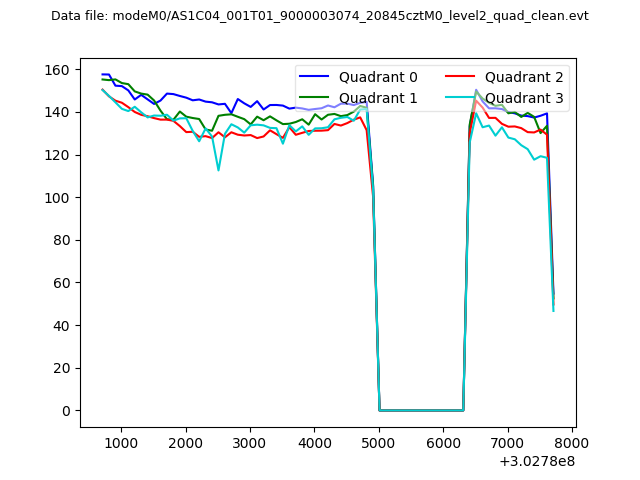
| Quadrant-wise count rates Data is divided into 100 sec bins |
 |
|
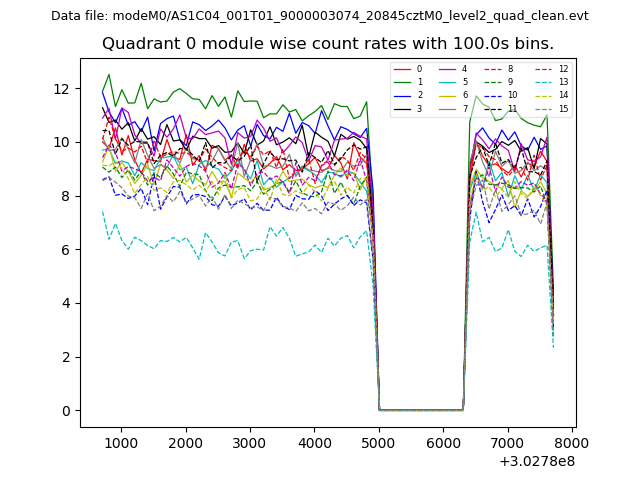
| Module-wise count rates for Quadrant A Data is divided into 100 sec bins |
 |
 |
| Module-wise count rates for Quadrant B Data is divided into 100 sec bins |
 |
 |
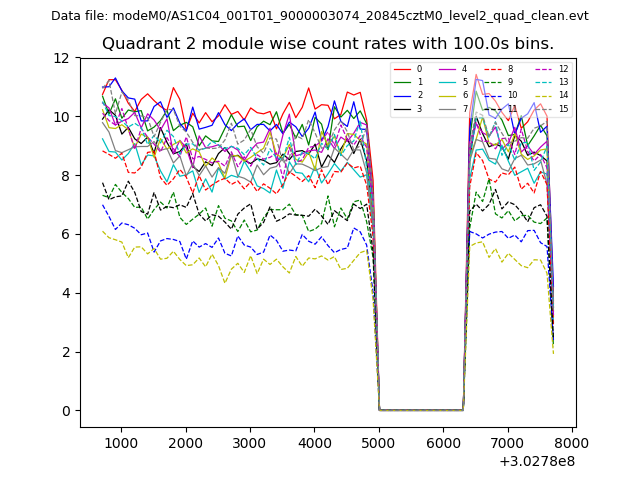
| Module-wise count rates for Quadrant C Data is divided into 100 sec bins |
 |
 |
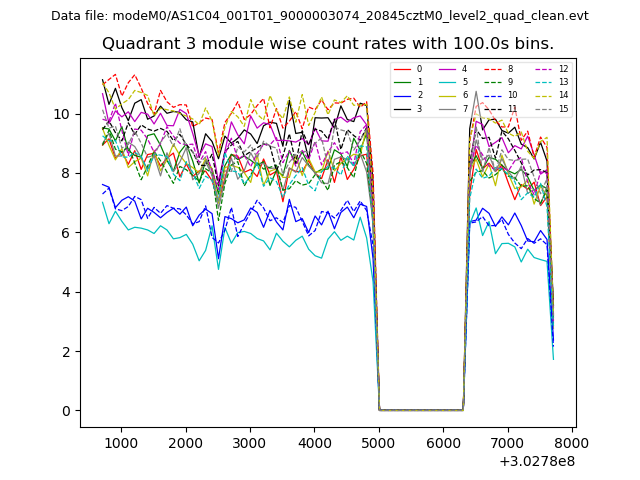
| Module-wise count rates for Quadrant D Data is divided into 100 sec bins |
 |
 |
| Parameter | Plot |
|---|---|
| CZT HV Monitor | 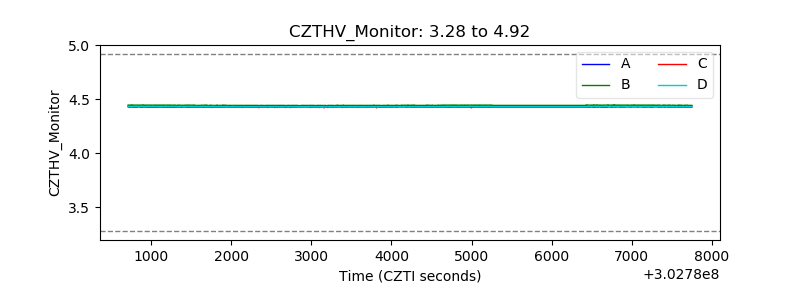 |
| D_VDD | 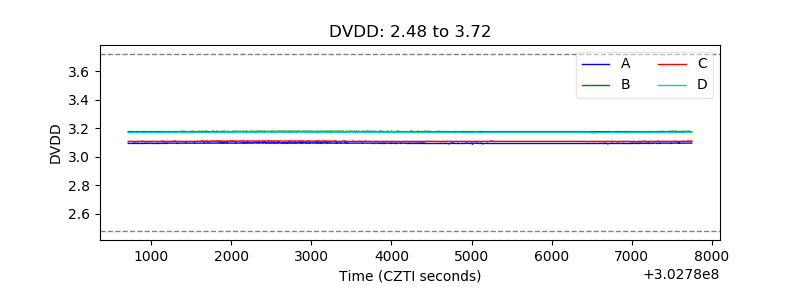 |
| Temperature 1 | 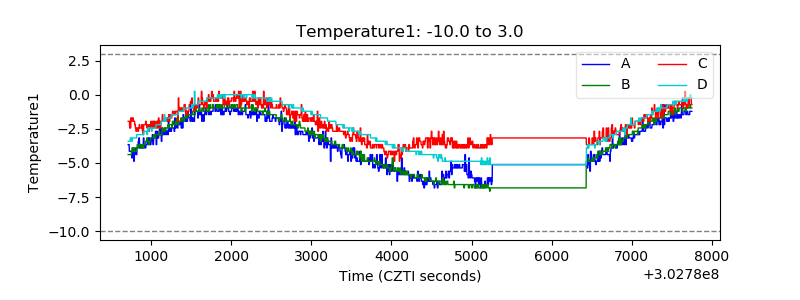 |
| Veto HV Monitor | 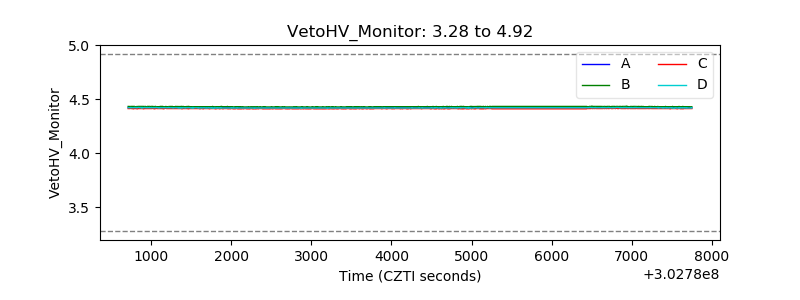 |
| Veto LLD | 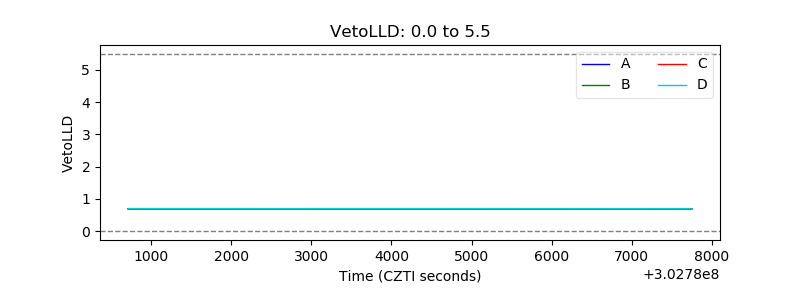 |
| Alpha Counter | 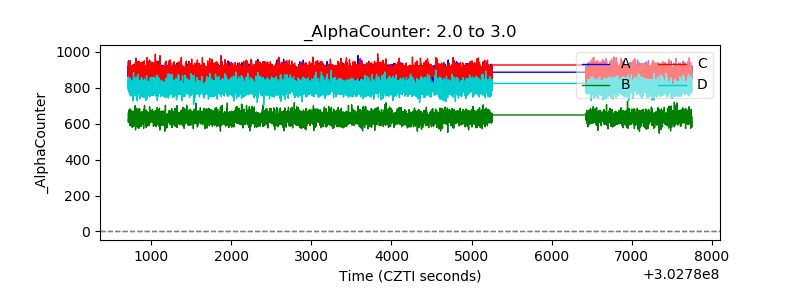 |
| _CPM_Rate | 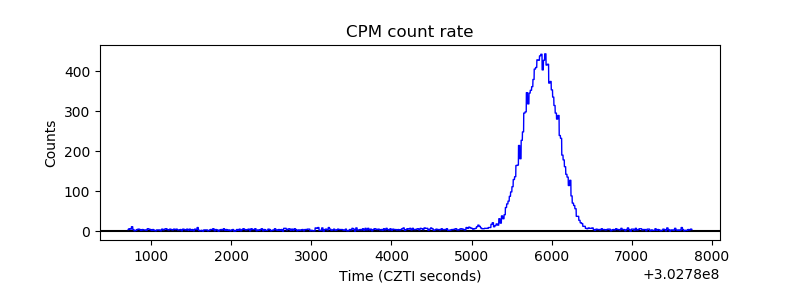 |
| CZT Counter | 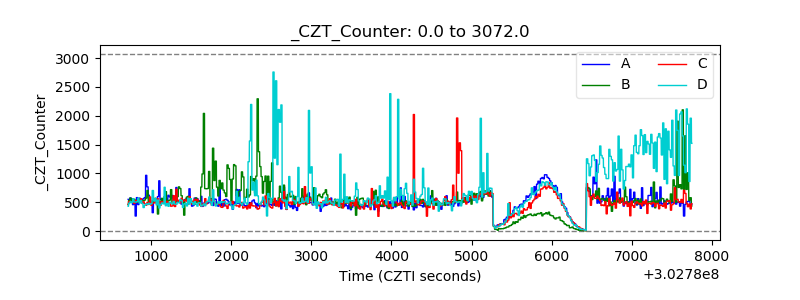 |
| +2.5 Volts monitor | 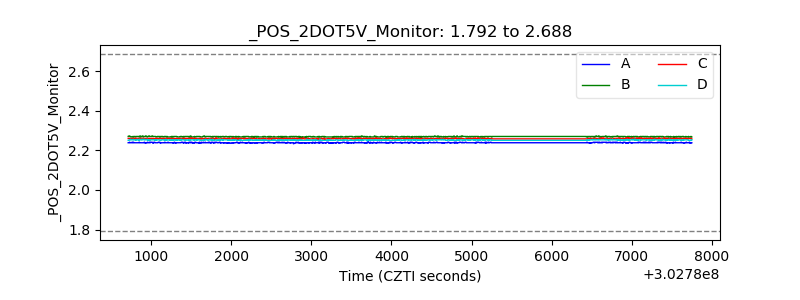 |
| +5 Volts monitor |  |
| _ROLL_ROT | 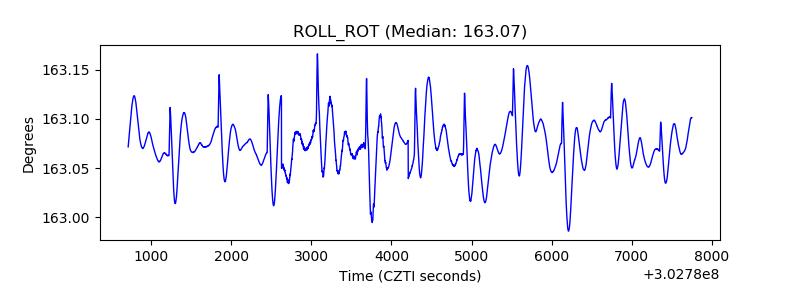 |
| _Roll_DEC | 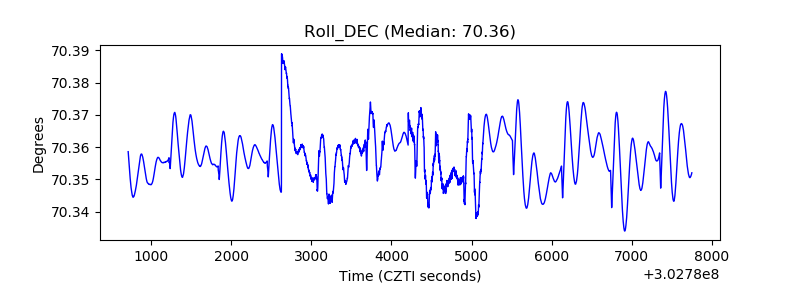 |
| _Roll_RA | 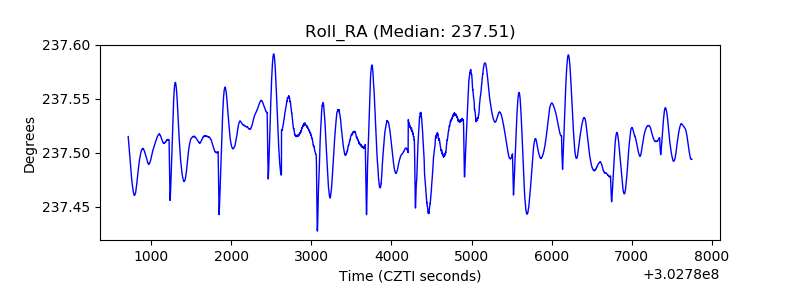 |
| Veto Counter | 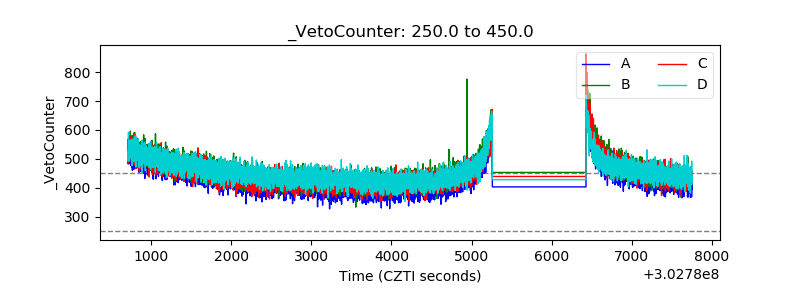 |