| Param | Original file | Final file |
|---|---|---|
| Filename | modeM0/AS1C04_001T01_9000003074_20846cztM0_level2.evt | modeM0/AS1C04_001T01_9000003074_20846cztM0_level2_quad_clean.evt |
| Size (bytes) | 630,377,280 | 115,367,040 |
| Size | 601.2 MB | 110.0 MB |
| Events in quadrant A | 3,303,854 | 801,960 |
| Events in quadrant B | 3,949,186 | 776,902 |
| Events in quadrant C | 3,276,151 | 747,598 |
| Events in quadrant D | 8,104,807 | 696,461 |
| Mode M0 | |||
|---|---|---|---|
| Quadrant | BADHDUFLAG | Total packets | Discarded packets |
| A | 0 | 14085 | 1 |
| B | 0 | 16111 | 1 |
| C | 0 | 14006 | 1 |
| D | 0 | 28596 | 1 |
| Mode M9 | |||
|---|---|---|---|
| Quadrant | BADHDUFLAG | Total packets | Discarded packets |
| A | 0 | 8 | 0 |
| B | 0 | 8 | 0 |
| C | 0 | 8 | 0 |
| D | 0 | 8 | 0 |
| Mode SS | |||
|---|---|---|---|
| Quadrant | BADHDUFLAG | Total packets | Discarded packets |
| A | 0 | 136 | 0 |
| B | 0 | 136 | 0 |
| C | 0 | 136 | 0 |
| D | 0 | 136 | 0 |
| Quadrant | Total seconds | Saturated seconds | Saturation percentage |
|---|---|---|---|
| A | 6752 | 94 | 1.392180% |
| B | 6752 | 155 | 2.295616% |
| C | 6753 | 123 | 1.821413% |
| D | 6753 | 1297 | 19.206279% |
Noise dominated data is calculated using 1-second bins in cleaned event files. If a bin has >2000 counts, and if more than 50% of those come from <1% of pixels, then it is considered to be noise-dominated and hence unusable.
| Quadrant | # 1 sec bins | Bins with >0 counts | Bins with >2000 counts | High rate bins dominated by noise | Noise dominated (total time) | Noise dominated (detector-on time) | Marked lightcurve |
|---|---|---|---|---|---|---|---|
| A | 7521 | 6751 | 0 | 0 | 0.00% | 0.00% | 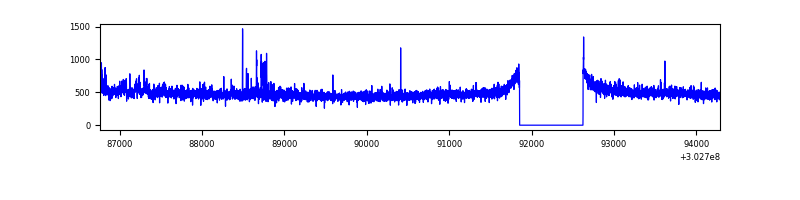 |
| B | 7521 | 6751 | 73 | 73 | 0.97% | 1.08% | 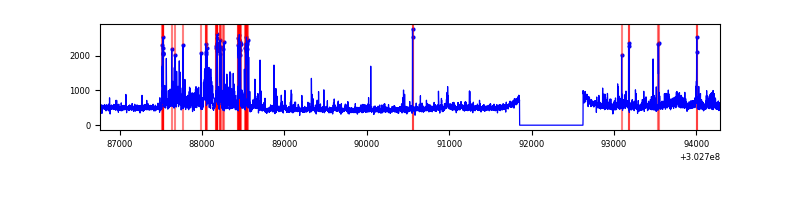 |
| C | 7523 | 6753 | 11 | 11 | 0.15% | 0.16% | 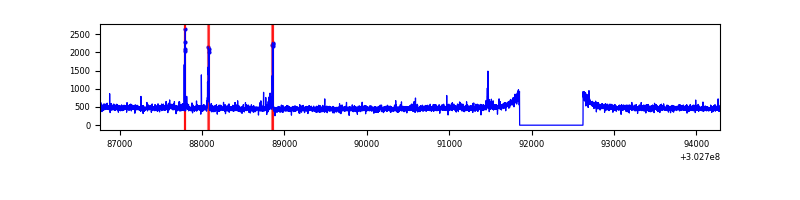 |
| D | 7523 | 6753 | 1355 | 1355 | 18.01% | 20.07% | 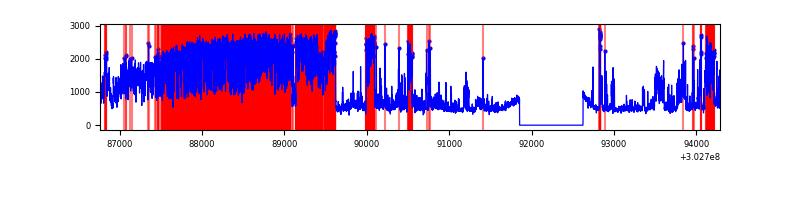 |
Top three noisy pixels from each quadrant. If the there are fewer than three noisy pixels in the level2.evt file, extra rows are filled as -1
| Pixel properties | Quadrant properties | ||||||
|---|---|---|---|---|---|---|---|
| Quadrant | DetID | PixID | Counts | Sigma | Mean | Median | Sigma |
| A | 2 | 79 | 134270 | 809.57 | 823 | 806 | 164.9 |
| A | 8 | 205 | 8401 | 46.07 | 823 | 806 | 164.9 |
| A | 0 | 226 | 7242 | 39.04 | 823 | 806 | 164.9 |
| B | 7 | 220 | 349794 | 2309.46 | 802 | 782 | 151.1 |
| B | 0 | 189 | 285854 | 1886.36 | 802 | 782 | 151.1 |
| B | 0 | 190 | 29343 | 188.99 | 802 | 782 | 151.1 |
| C | 14 | 238 | 122642 | 681.33 | 774 | 779 | 178.9 |
| C | 9 | 54 | 83237 | 461.02 | 774 | 779 | 178.9 |
| C | 3 | 233 | 24623 | 133.31 | 774 | 779 | 178.9 |
| D | 1 | 20 | 4545814 | 24597.12 | 770 | 748 | 184.8 |
| D | 1 | 52 | 413179 | 2232.01 | 770 | 748 | 184.8 |
| D | 1 | 239 | 70983 | 380.1 | 770 | 748 | 184.8 |
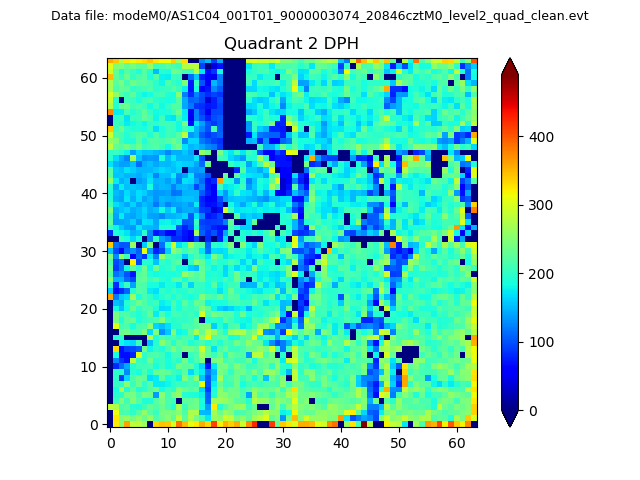
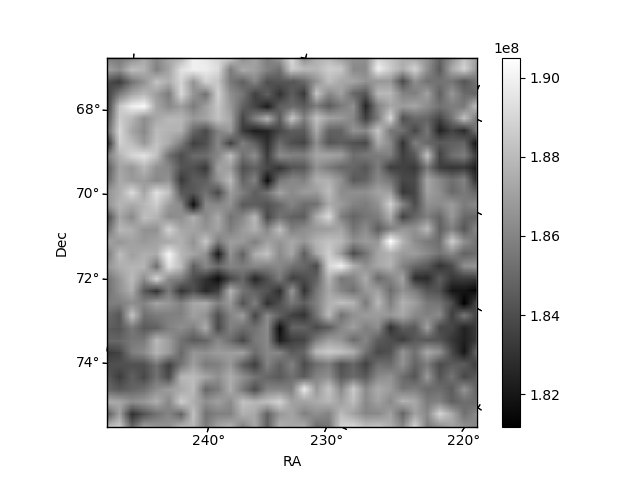
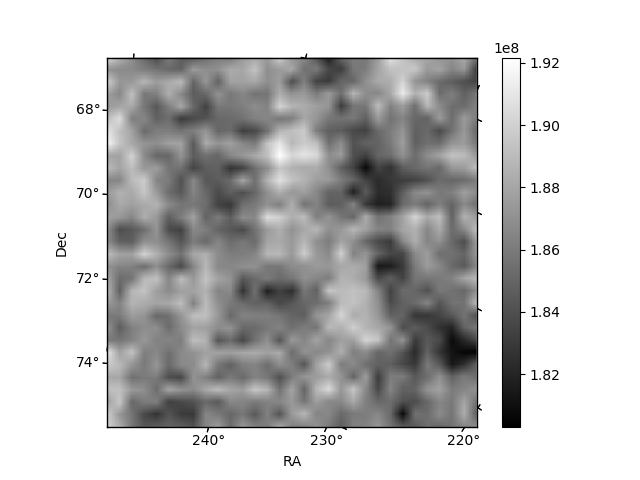
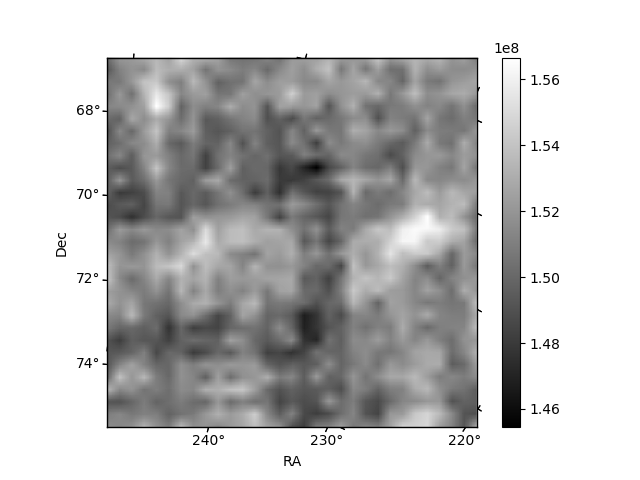
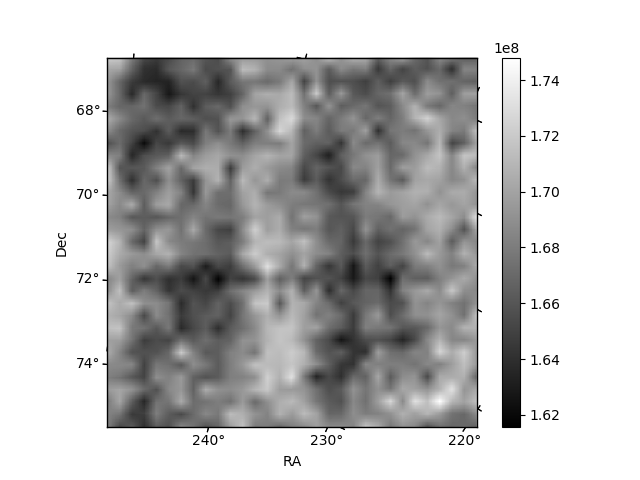
Histogram calculated using DETX and DETY for each event in the final _common_clean file
| Quadrant A | 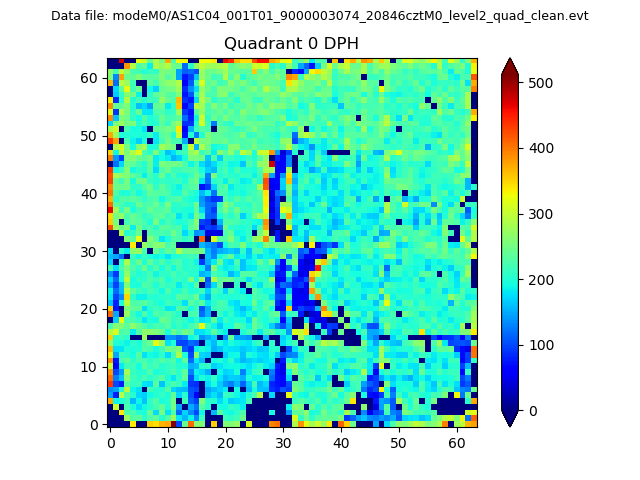 |
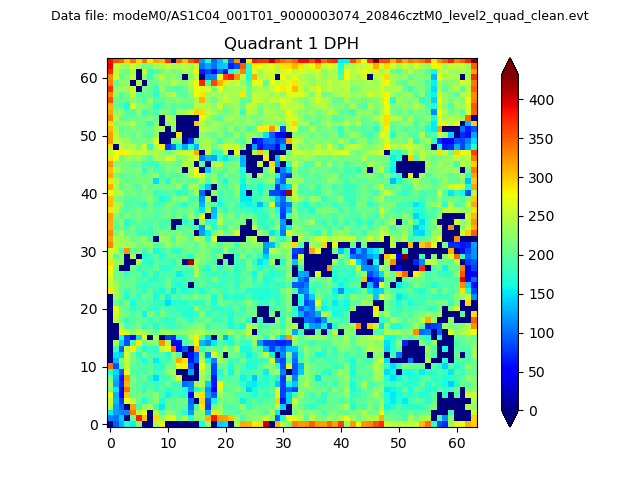 |
Quadrant B |
|---|---|---|---|
| Quadrant D | 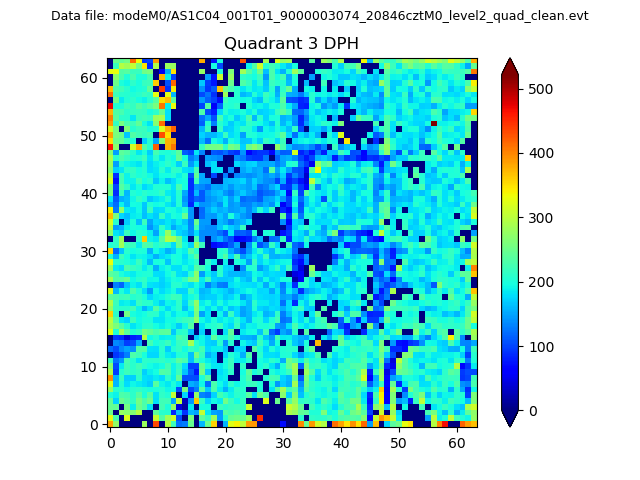 |
 |
Quadrant C |
| Plot type | Count rate plots | Images |
|---|---|---|
| Comparison with Poisson distribution Blue bars denote a histogram of data divided into 1 sec bins. Red curve is a Poisson curve with rate = median count rate of data. |
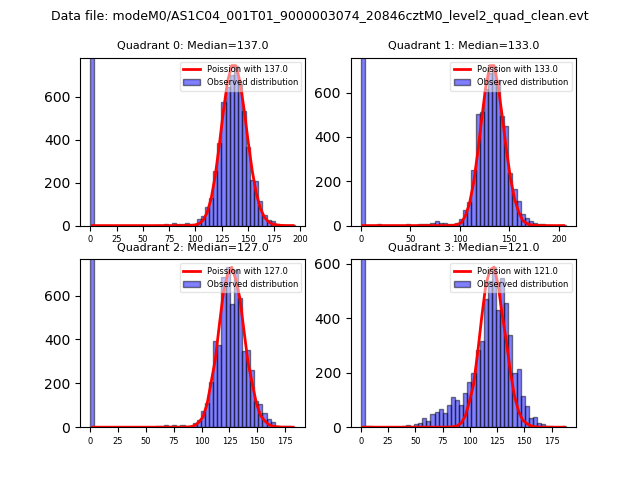 |
 |
| Quadrant-wise count rates Data is divided into 100 sec bins |
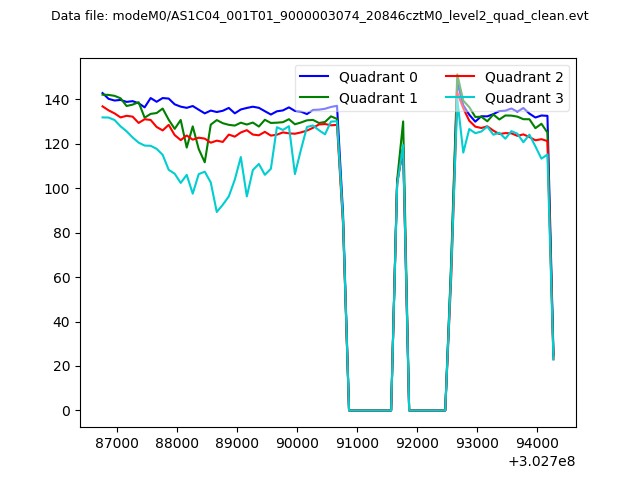 |
|
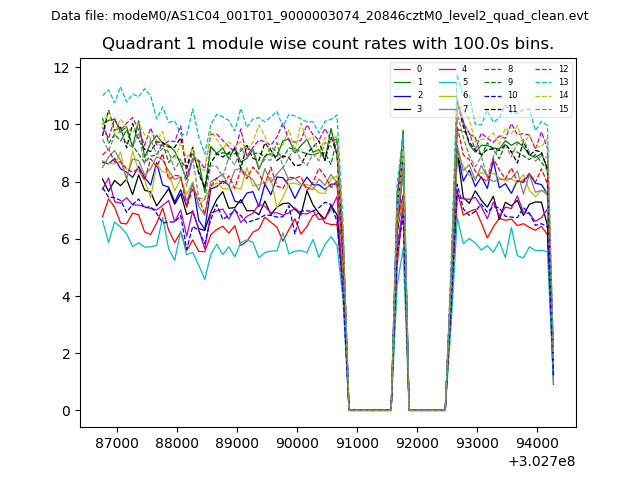
| Module-wise count rates for Quadrant A Data is divided into 100 sec bins |
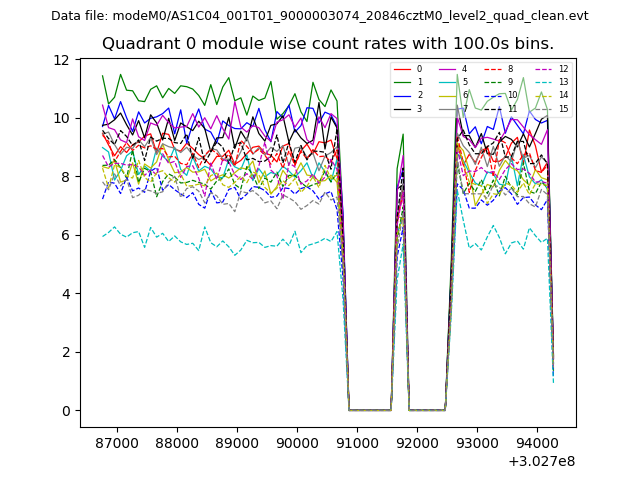 |
 |
| Module-wise count rates for Quadrant B Data is divided into 100 sec bins |
 |
 |
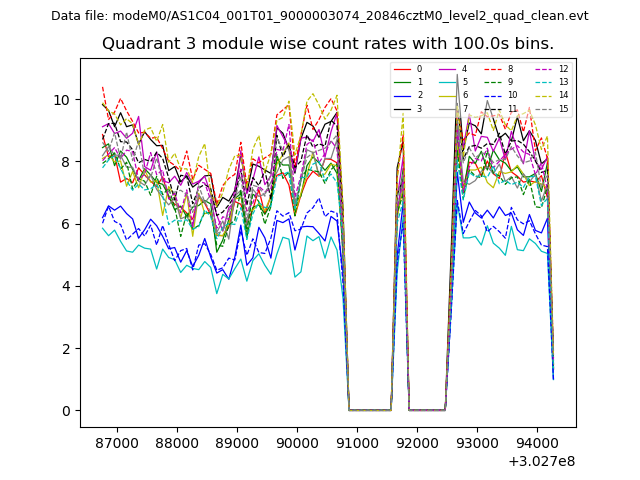
| Module-wise count rates for Quadrant C Data is divided into 100 sec bins |
 |
 |
| Module-wise count rates for Quadrant D Data is divided into 100 sec bins |
 |
 |
| Parameter | Plot |
|---|---|
| CZT HV Monitor |  |
| D_VDD | 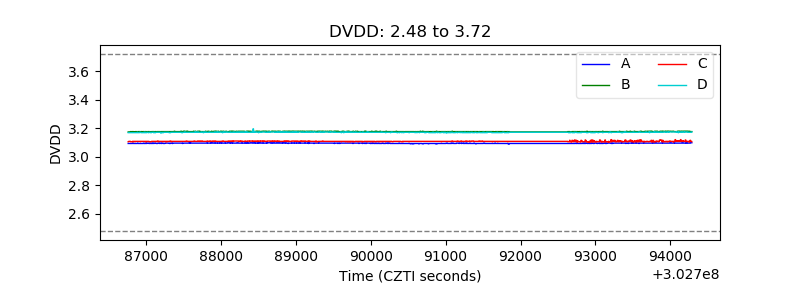 |
| Temperature 1 | 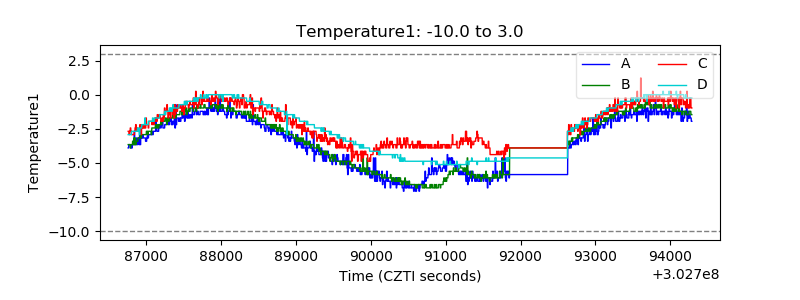 |
| Veto HV Monitor | 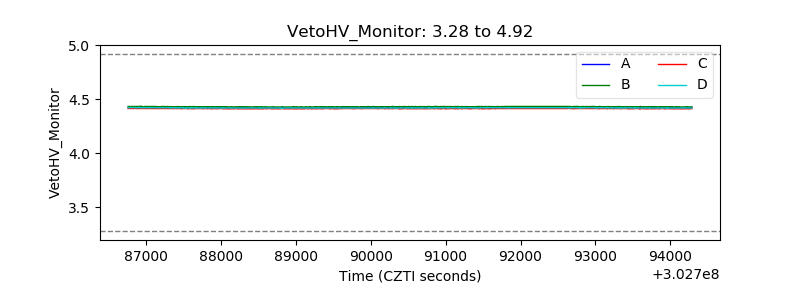 |
| Veto LLD | 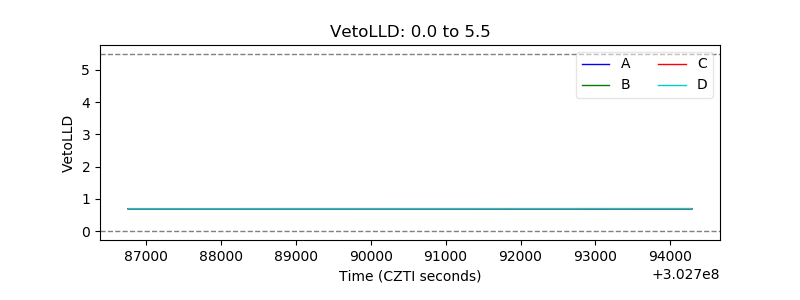 |
| Alpha Counter | 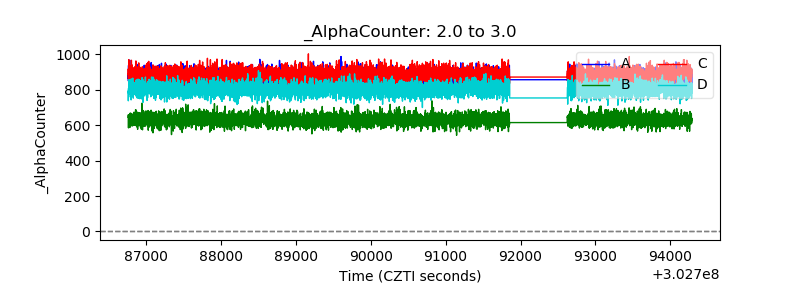 |
| _CPM_Rate | 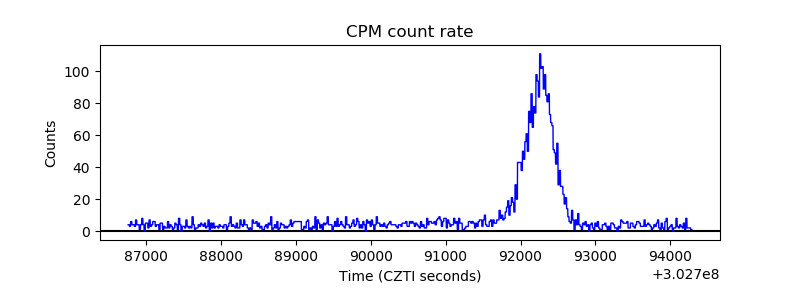 |
| CZT Counter |  |
| +2.5 Volts monitor | 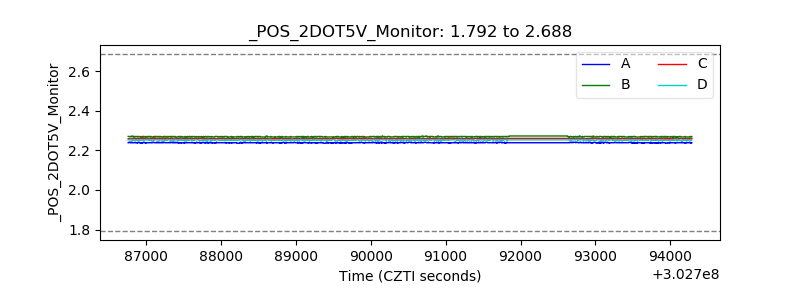 |
| +5 Volts monitor |  |
| _ROLL_ROT | 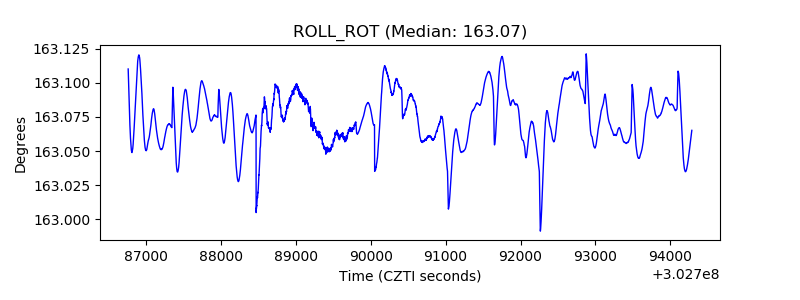 |
| _Roll_DEC | 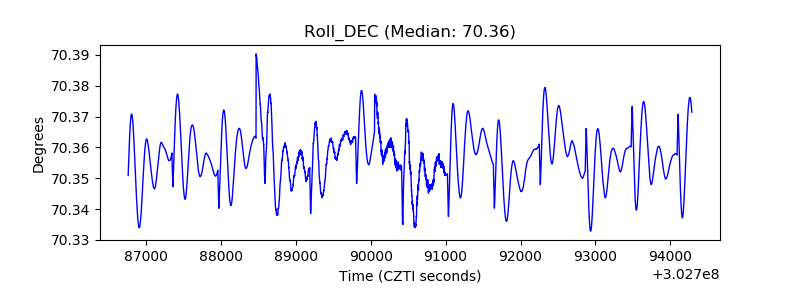 |
| _Roll_RA | 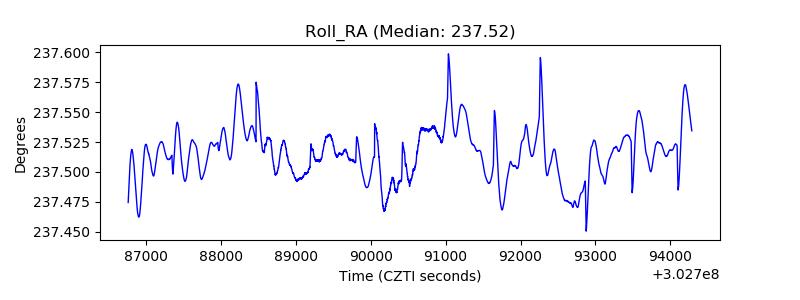 |
| Veto Counter | 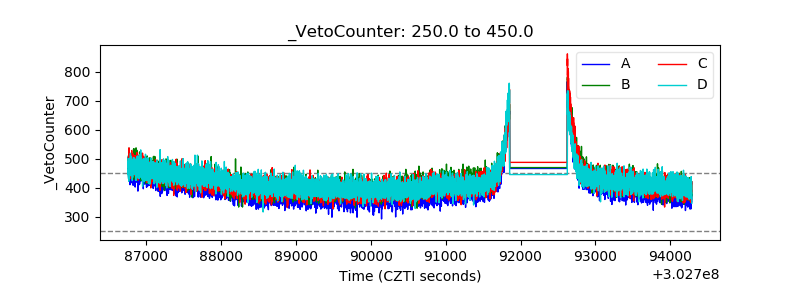 |