| Param | Original file | Final file |
|---|---|---|
| Filename | modeM0/AS1C04_001T01_9000003074_20847cztM0_level2.evt | modeM0/AS1C04_001T01_9000003074_20847cztM0_level2_quad_clean.evt |
| Size (bytes) | 715,403,520 | 115,937,280 |
| Size | 682.3 MB | 110.6 MB |
| Events in quadrant A | 3,331,200 | 805,806 |
| Events in quadrant B | 4,200,533 | 785,510 |
| Events in quadrant C | 3,326,482 | 755,229 |
| Events in quadrant D | 10,336,010 | 677,537 |
| Mode M0 | |||
|---|---|---|---|
| Quadrant | BADHDUFLAG | Total packets | Discarded packets |
| A | 0 | 14522 | 1 |
| B | 0 | 17114 | 1 |
| C | 0 | 14472 | 1 |
| D | 0 | 35510 | 2 |
| Mode M9 | |||
|---|---|---|---|
| Quadrant | BADHDUFLAG | Total packets | Discarded packets |
| A | 0 | 3 | 0 |
| B | 0 | 3 | 0 |
| C | 0 | 3 | 0 |
| D | 0 | 3 | 0 |
| Mode SS | |||
|---|---|---|---|
| Quadrant | BADHDUFLAG | Total packets | Discarded packets |
| A | 0 | 142 | 0 |
| B | 0 | 142 | 0 |
| C | 0 | 142 | 0 |
| D | 0 | 142 | 0 |
| Quadrant | Total seconds | Saturated seconds | Saturation percentage |
|---|---|---|---|
| A | 6978 | 125 | 1.791344% |
| B | 6979 | 232 | 3.324258% |
| C | 6979 | 163 | 2.335578% |
| D | 6978 | 1877 | 26.898825% |
Noise dominated data is calculated using 1-second bins in cleaned event files. If a bin has >2000 counts, and if more than 50% of those come from <1% of pixels, then it is considered to be noise-dominated and hence unusable.
| Quadrant | # 1 sec bins | Bins with >0 counts | Bins with >2000 counts | High rate bins dominated by noise | Noise dominated (total time) | Noise dominated (detector-on time) | Marked lightcurve |
|---|---|---|---|---|---|---|---|
| A | 7268 | 6978 | 0 | 0 | 0.00% | 0.00% | 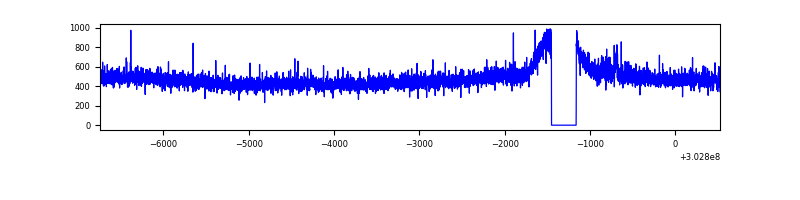 |
| B | 7269 | 6979 | 42 | 42 | 0.58% | 0.60% | 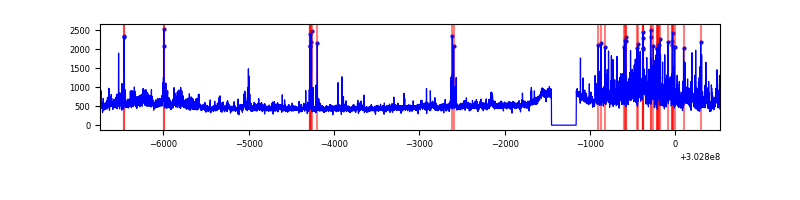 |
| C | 7268 | 6978 | 1 | 1 | 0.01% | 0.01% | 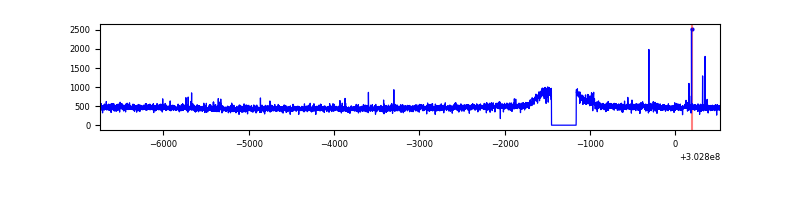 |
| D | 7267 | 6977 | 1802 | 1802 | 24.80% | 25.83% | 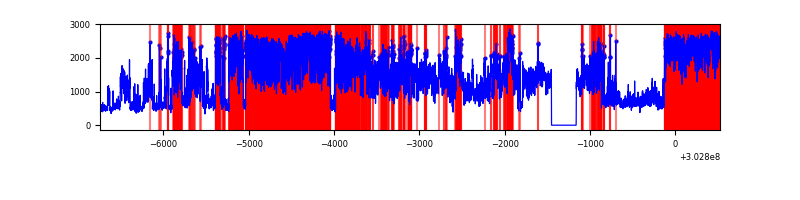 |
Top three noisy pixels from each quadrant. If the there are fewer than three noisy pixels in the level2.evt file, extra rows are filled as -1
| Pixel properties | Quadrant properties | ||||||
|---|---|---|---|---|---|---|---|
| Quadrant | DetID | PixID | Counts | Sigma | Mean | Median | Sigma |
| A | 2 | 79 | 74385 | 429.71 | 845 | 826 | 171.2 |
| A | 0 | 226 | 7342 | 38.06 | 845 | 826 | 171.2 |
| A | 8 | 205 | 6839 | 35.13 | 845 | 826 | 171.2 |
| B | 7 | 220 | 362011 | 2260.98 | 829 | 808 | 159.8 |
| B | 0 | 189 | 341345 | 2131.62 | 829 | 808 | 159.8 |
| B | 0 | 190 | 64530 | 398.87 | 829 | 808 | 159.8 |
| C | 14 | 238 | 124550 | 658.55 | 803 | 807 | 187.9 |
| C | 9 | 54 | 26828 | 138.48 | 803 | 807 | 187.9 |
| C | 7 | 247 | 12806 | 63.86 | 803 | 807 | 187.9 |
| D | 1 | 20 | 6628189 | 35495.26 | 772 | 749 | 186.7 |
| D | 1 | 239 | 240859 | 1285.98 | 772 | 749 | 186.7 |
| D | 9 | 1 | 193142 | 1030.42 | 772 | 749 | 186.7 |
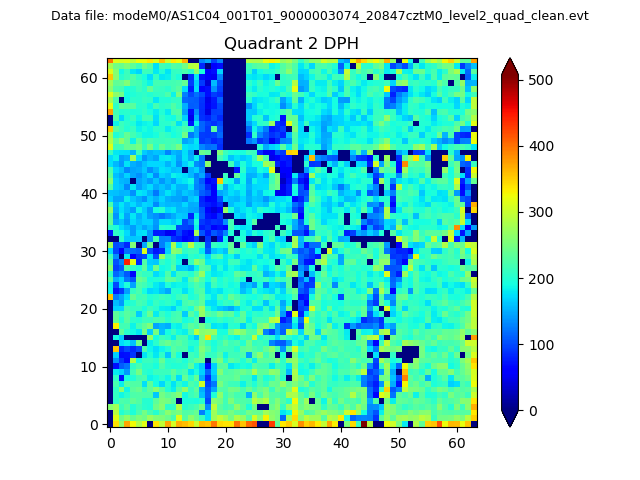
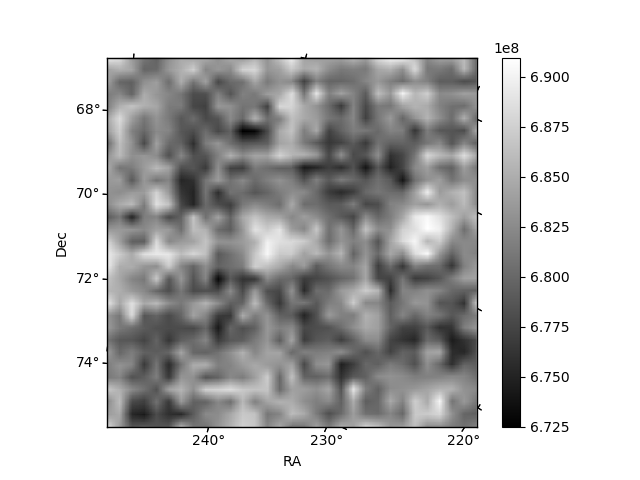
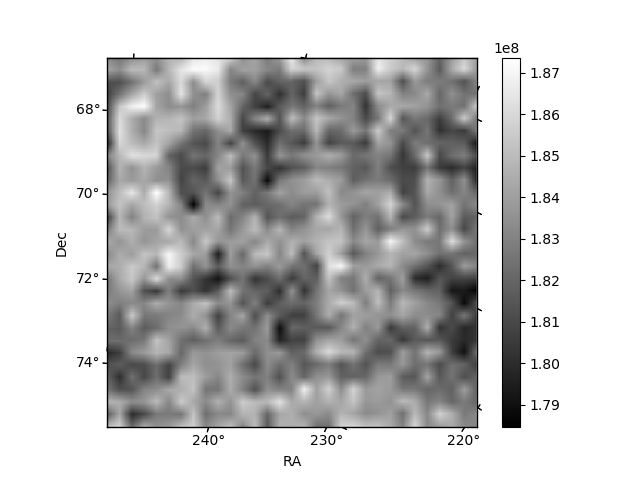
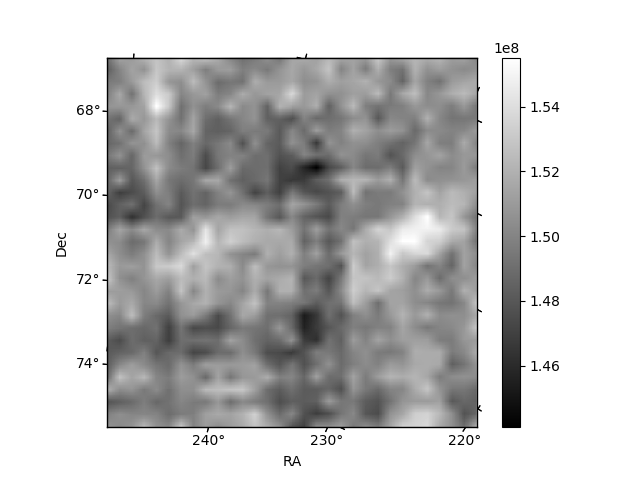
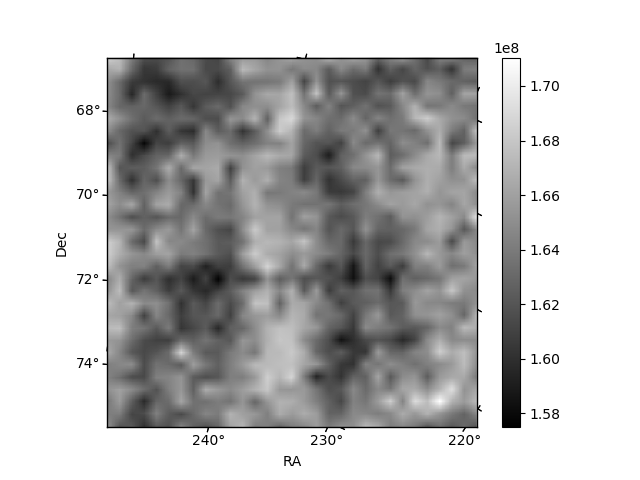
Histogram calculated using DETX and DETY for each event in the final _common_clean file
| Quadrant A | 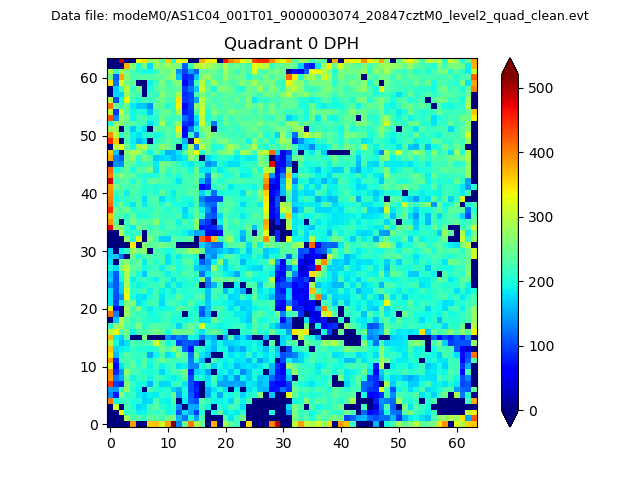 |
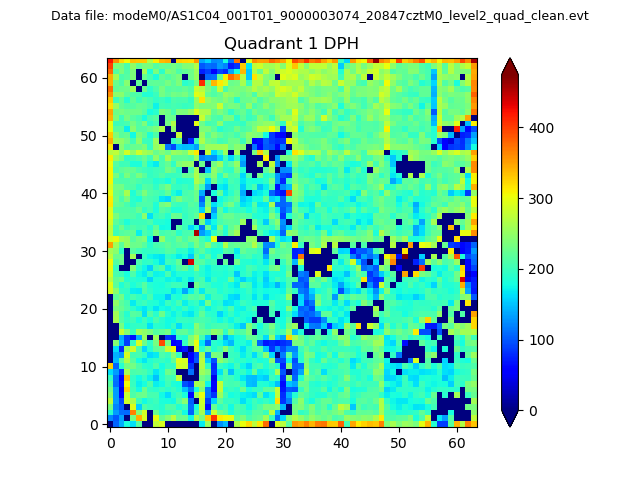 |
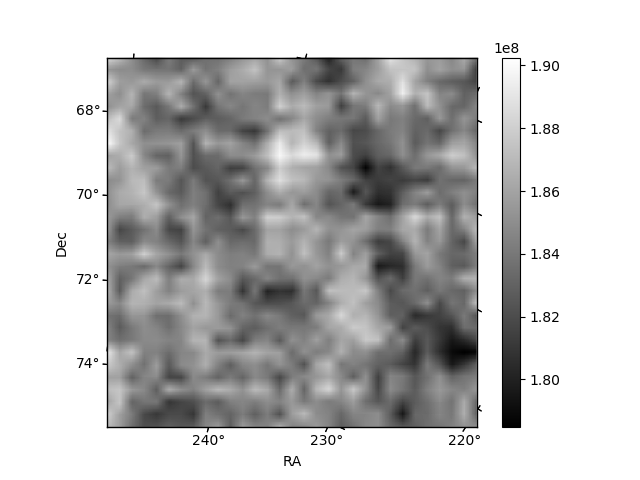
Quadrant B |
|---|---|---|---|
| Quadrant D | 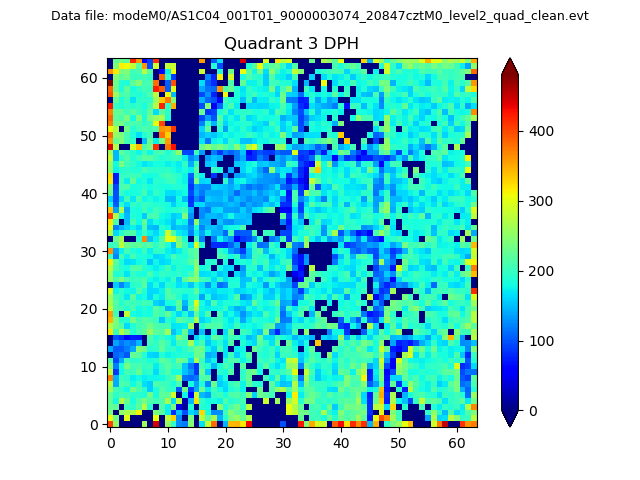 |
 |
Quadrant C |
| Plot type | Count rate plots | Images |
|---|---|---|
| Comparison with Poisson distribution Blue bars denote a histogram of data divided into 1 sec bins. Red curve is a Poisson curve with rate = median count rate of data. |
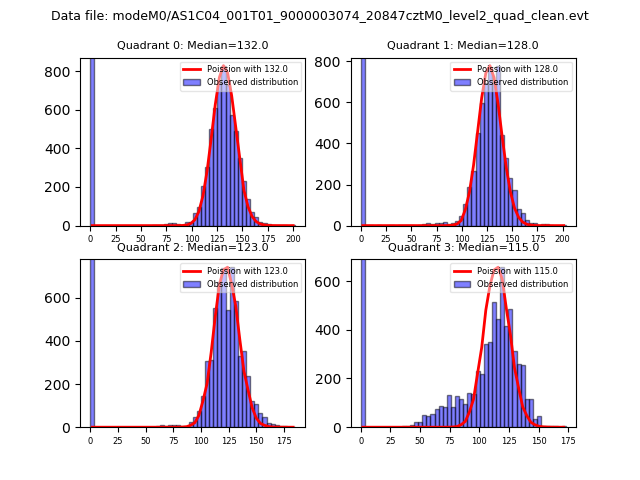 |
 |
| Quadrant-wise count rates Data is divided into 100 sec bins |
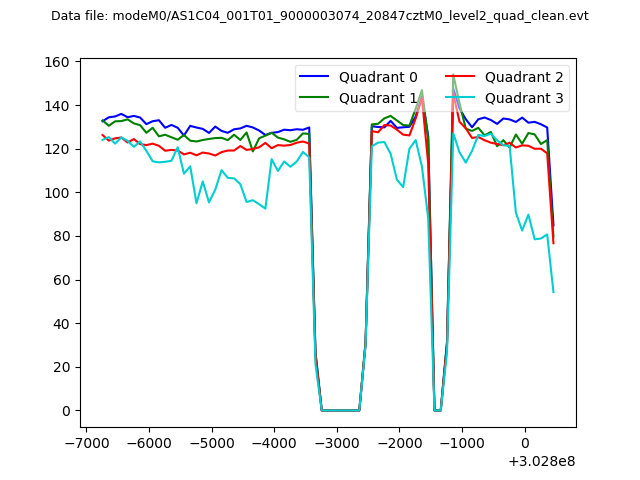 |
|
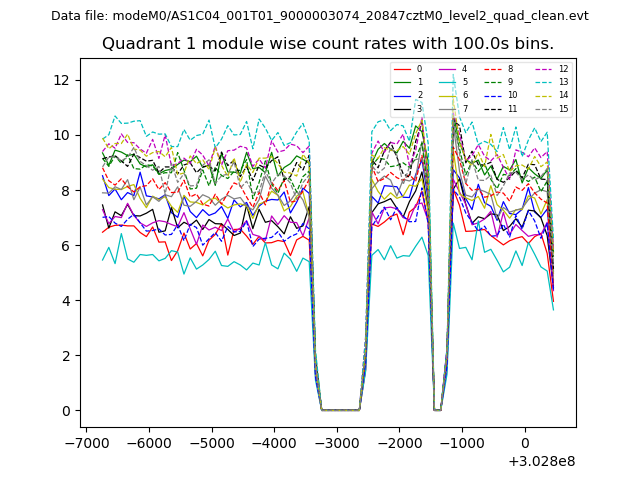
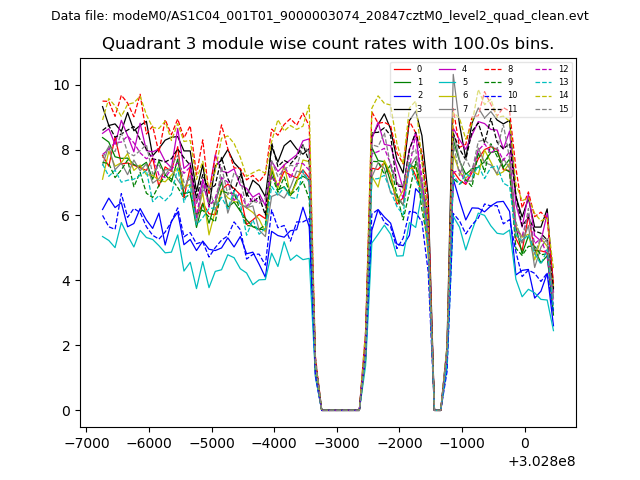
| Module-wise count rates for Quadrant A Data is divided into 100 sec bins |
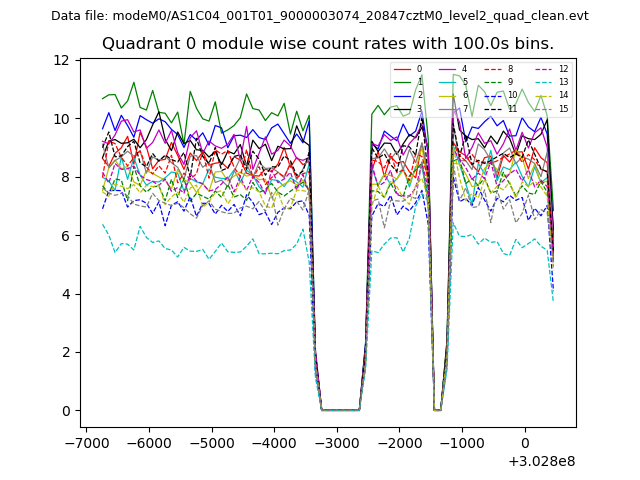 |
 |
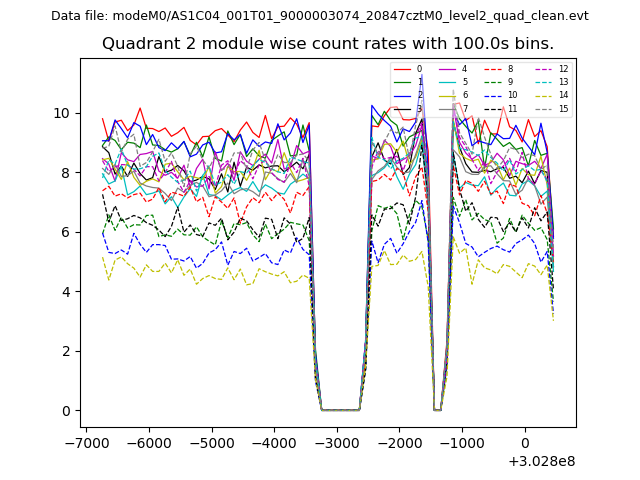
| Module-wise count rates for Quadrant B Data is divided into 100 sec bins |
 |
 |
| Module-wise count rates for Quadrant C Data is divided into 100 sec bins |
 |
 |
| Module-wise count rates for Quadrant D Data is divided into 100 sec bins |
 |
 |
| Parameter | Plot |
|---|---|
| CZT HV Monitor | 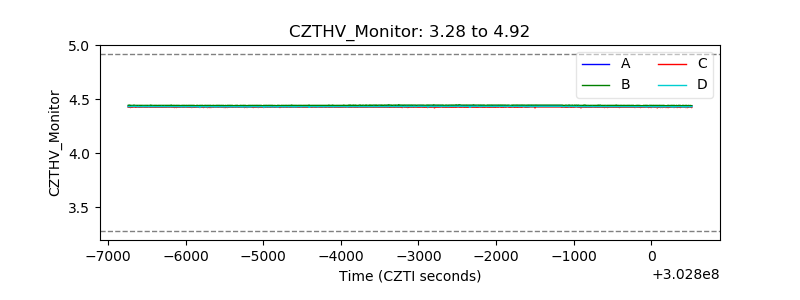 |
| D_VDD | 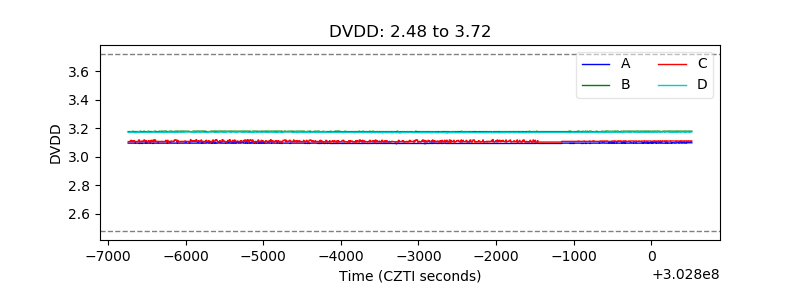 |
| Temperature 1 | 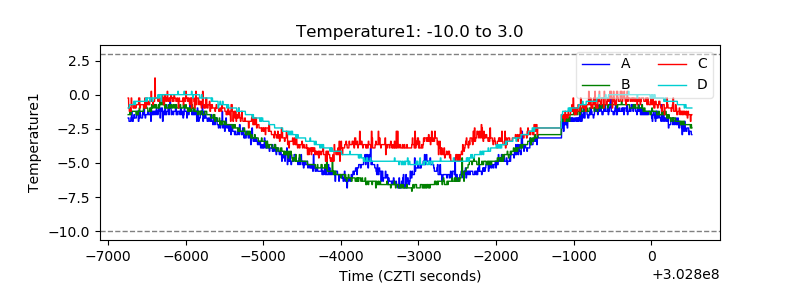 |
| Veto HV Monitor |  |
| Veto LLD |  |
| Alpha Counter | 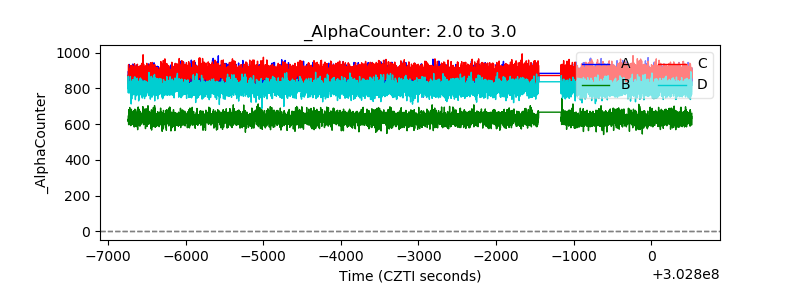 |
| _CPM_Rate | 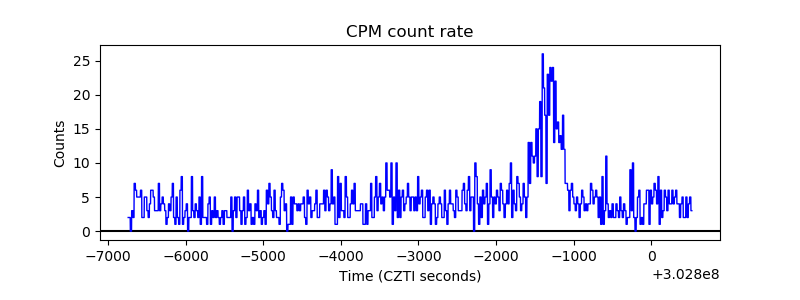 |
| CZT Counter | 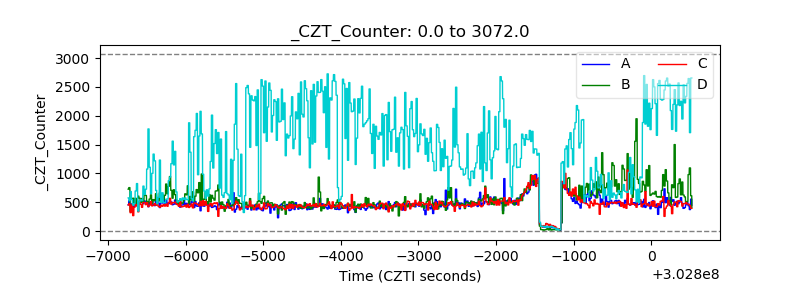 |
| +2.5 Volts monitor |  |
| +5 Volts monitor |  |
| _ROLL_ROT | 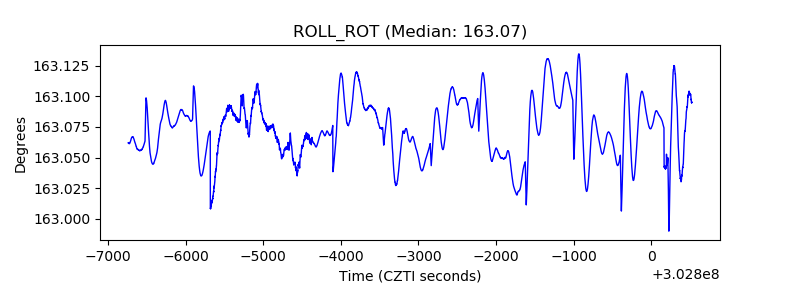 |
| _Roll_DEC | 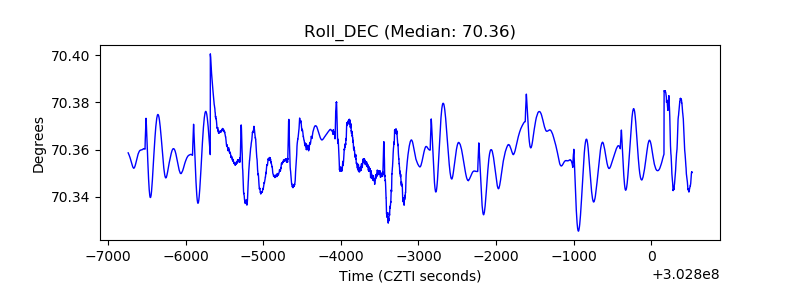 |
| _Roll_RA | 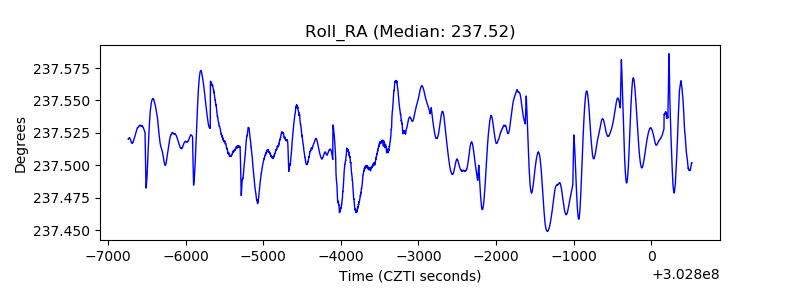 |
| Veto Counter | 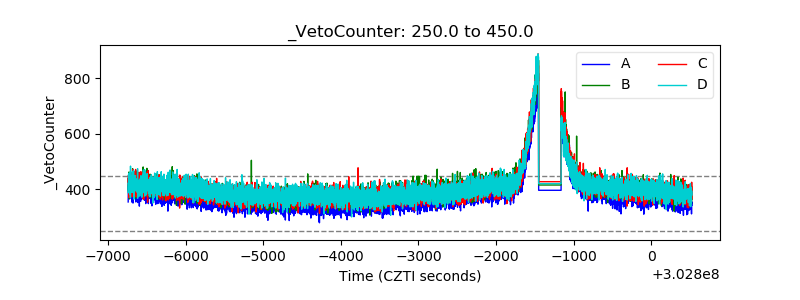 |