| Param | Original file | Final file |
|---|---|---|
| Filename | modeM0/AS1C04_001T01_9000003074_20849cztM0_level2.evt | modeM0/AS1C04_001T01_9000003074_20849cztM0_level2_quad_clean.evt |
| Size (bytes) | 643,921,920 | 117,086,400 |
| Size | 614.1 MB | 111.7 MB |
| Events in quadrant A | 3,282,761 | 803,754 |
| Events in quadrant B | 3,580,668 | 789,764 |
| Events in quadrant C | 3,345,992 | 757,486 |
| Events in quadrant D | 8,812,542 | 701,548 |
| Mode M0 | |||
|---|---|---|---|
| Quadrant | BADHDUFLAG | Total packets | Discarded packets |
| A | 0 | 14581 | 1 |
| B | 0 | 15271 | 1 |
| C | 0 | 14586 | 1 |
| D | 0 | 31181 | 1 |
| Mode M9 | |||
|---|---|---|---|
| Quadrant | BADHDUFLAG | Total packets | Discarded packets |
| A | 0 | 3 | 0 |
| B | 0 | 3 | 0 |
| C | 0 | 3 | 0 |
| D | 0 | 3 | 0 |
| Mode SS | |||
|---|---|---|---|
| Quadrant | BADHDUFLAG | Total packets | Discarded packets |
| A | 0 | 144 | 0 |
| B | 0 | 144 | 0 |
| C | 0 | 144 | 0 |
| D | 0 | 144 | 0 |
| Quadrant | Total seconds | Saturated seconds | Saturation percentage |
|---|---|---|---|
| A | 7079 | 29 | 0.409662% |
| B | 7079 | 76 | 1.073598% |
| C | 7079 | 95 | 1.341997% |
| D | 7079 | 1303 | 18.406555% |
Noise dominated data is calculated using 1-second bins in cleaned event files. If a bin has >2000 counts, and if more than 50% of those come from <1% of pixels, then it is considered to be noise-dominated and hence unusable.
| Quadrant | # 1 sec bins | Bins with >0 counts | Bins with >2000 counts | High rate bins dominated by noise | Noise dominated (total time) | Noise dominated (detector-on time) | Marked lightcurve |
|---|---|---|---|---|---|---|---|
| A | 7423 | 7078 | 8 | 8 | 0.11% | 0.11% | 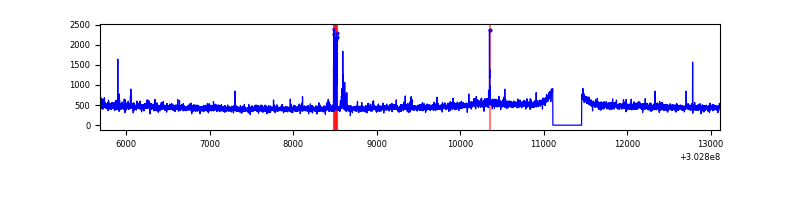 |
| B | 7423 | 7078 | 13 | 13 | 0.18% | 0.18% | 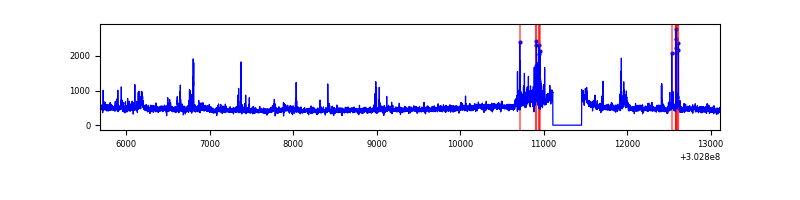 |
| C | 7423 | 7078 | 6 | 6 | 0.08% | 0.08% | 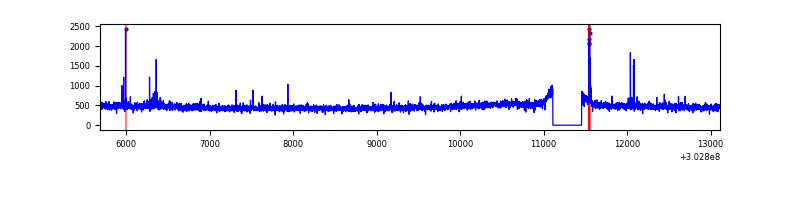 |
| D | 7423 | 7078 | 1297 | 1297 | 17.47% | 18.32% | 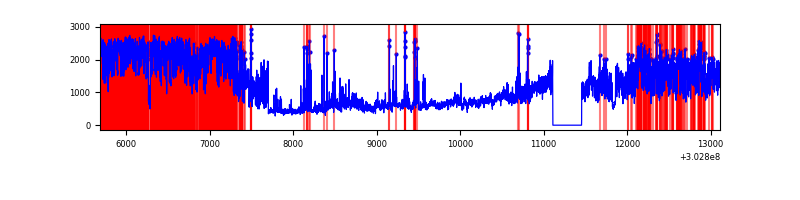 |
Top three noisy pixels from each quadrant. If the there are fewer than three noisy pixels in the level2.evt file, extra rows are filled as -1
| Pixel properties | Quadrant properties | ||||||
|---|---|---|---|---|---|---|---|
| Quadrant | DetID | PixID | Counts | Sigma | Mean | Median | Sigma |
| A | 5 | 16 | 60102 | 349.58 | 837 | 818 | 169.6 |
| A | 0 | 226 | 7200 | 37.63 | 837 | 818 | 169.6 |
| A | 3 | 137 | 6605 | 34.12 | 837 | 818 | 169.6 |
| B | 7 | 220 | 103210 | 653.09 | 829 | 806 | 156.8 |
| B | 0 | 190 | 76958 | 485.67 | 829 | 806 | 156.8 |
| B | 4 | 216 | 67419 | 424.83 | 829 | 806 | 156.8 |
| C | 14 | 238 | 123923 | 661.49 | 798 | 803 | 186.1 |
| C | 0 | 207 | 43252 | 228.07 | 798 | 803 | 186.1 |
| C | 9 | 54 | 13481 | 68.12 | 798 | 803 | 186.1 |
| D | 1 | 20 | 5076363 | 26693.19 | 785 | 759 | 190.1 |
| D | 1 | 239 | 363203 | 1906.14 | 785 | 759 | 190.1 |
| D | 9 | 1 | 155385 | 813.2 | 785 | 759 | 190.1 |
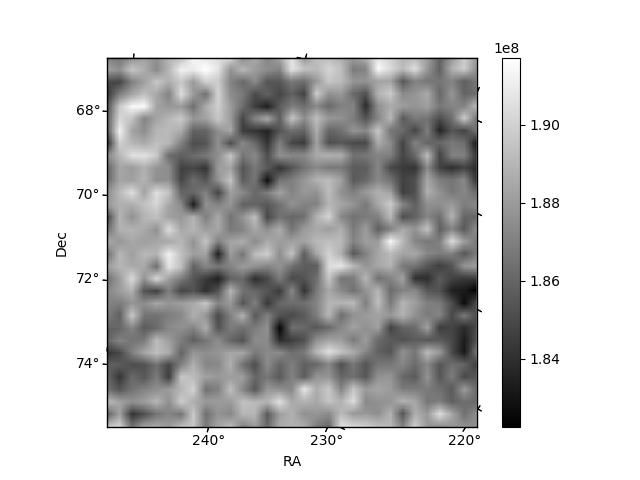
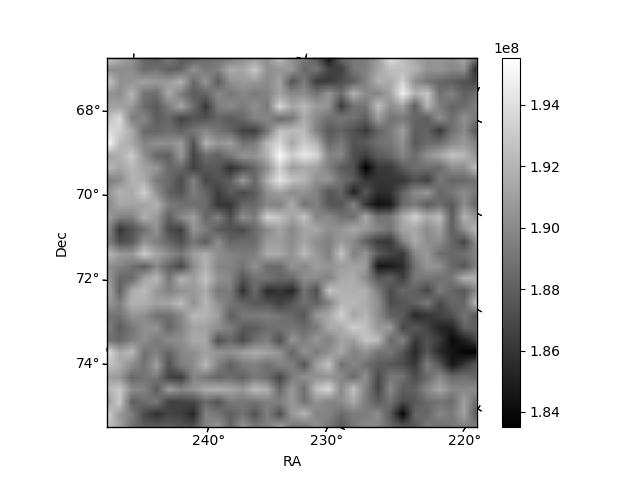
Histogram calculated using DETX and DETY for each event in the final _common_clean file
| Quadrant A | 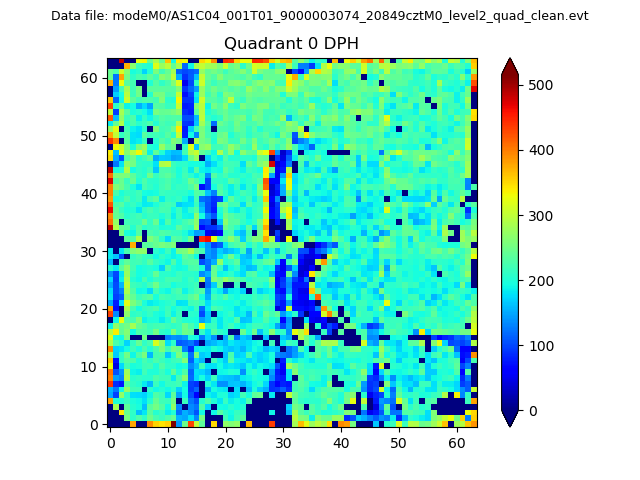 |
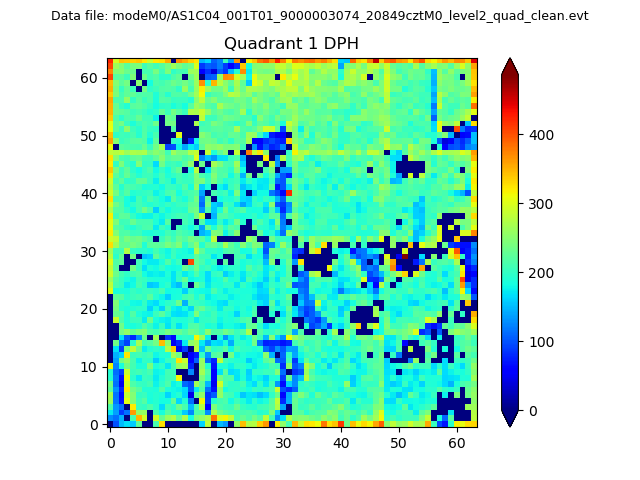 |
Quadrant B |
|---|---|---|---|
| Quadrant D | 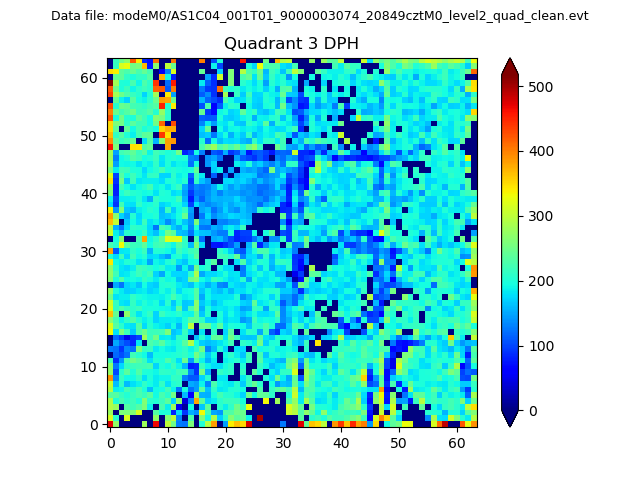 |
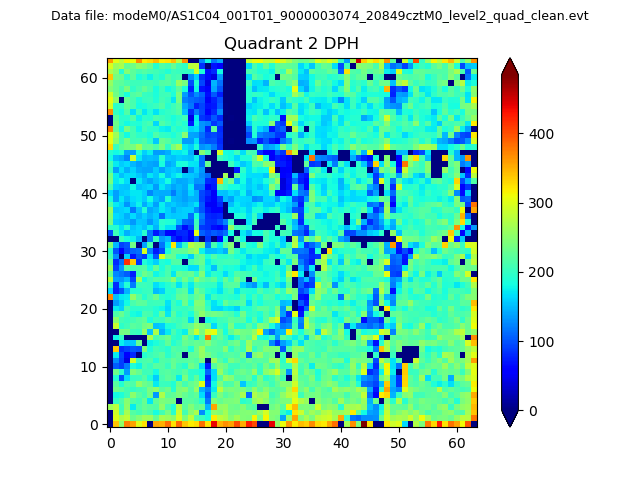 |
Quadrant C |
| Plot type | Count rate plots | Images |
|---|---|---|
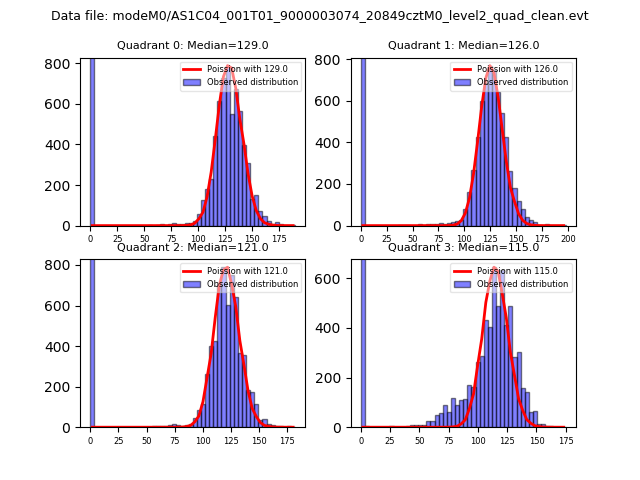
| Comparison with Poisson distribution Blue bars denote a histogram of data divided into 1 sec bins. Red curve is a Poisson curve with rate = median count rate of data. |
 |
 |
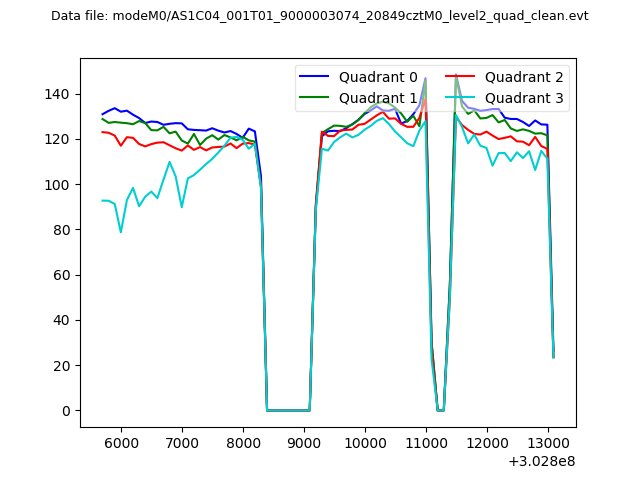
| Quadrant-wise count rates Data is divided into 100 sec bins |
 |
|
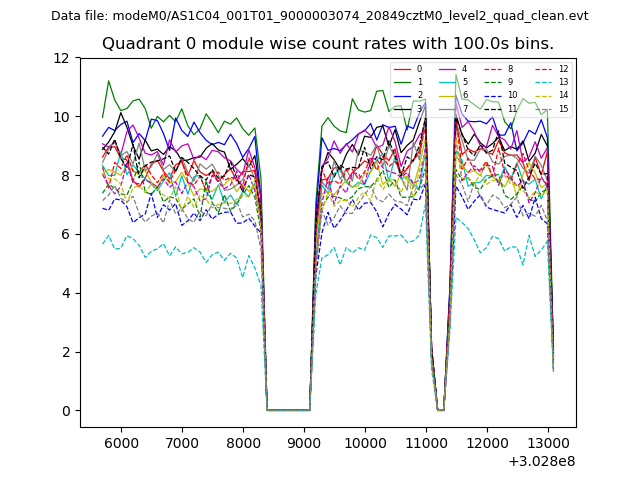
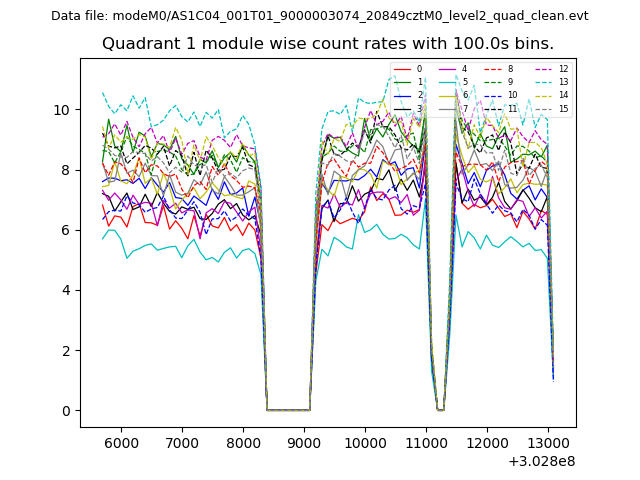
| Module-wise count rates for Quadrant A Data is divided into 100 sec bins |
 |
 |
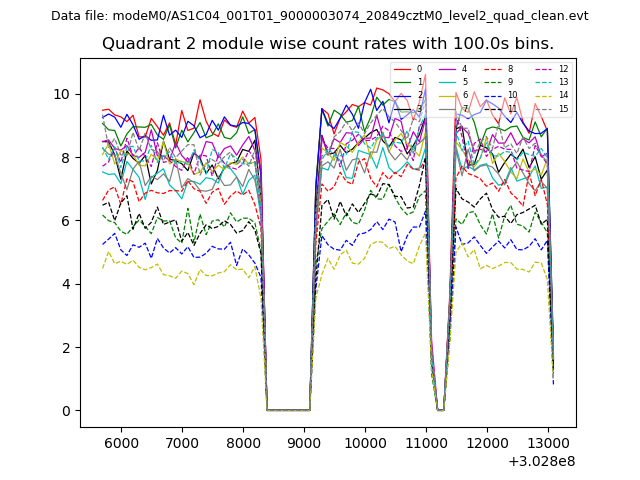
| Module-wise count rates for Quadrant B Data is divided into 100 sec bins |
 |
 |
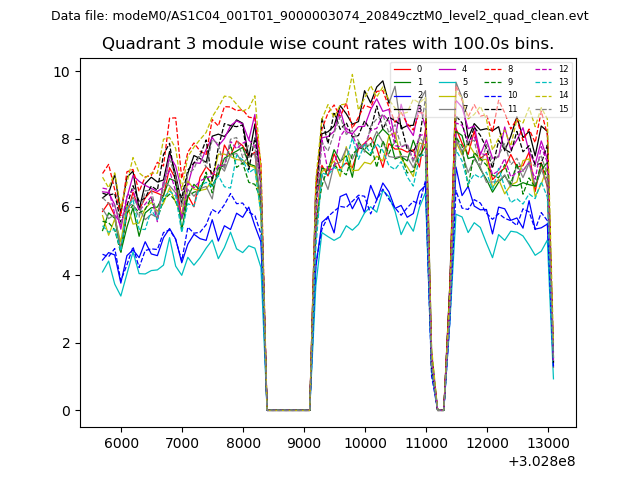
| Module-wise count rates for Quadrant C Data is divided into 100 sec bins |
 |
 |
| Module-wise count rates for Quadrant D Data is divided into 100 sec bins |
 |
 |
| Parameter | Plot |
|---|---|
| CZT HV Monitor | 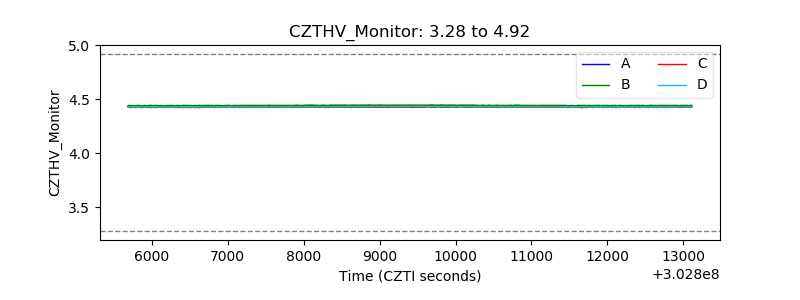 |
| D_VDD | 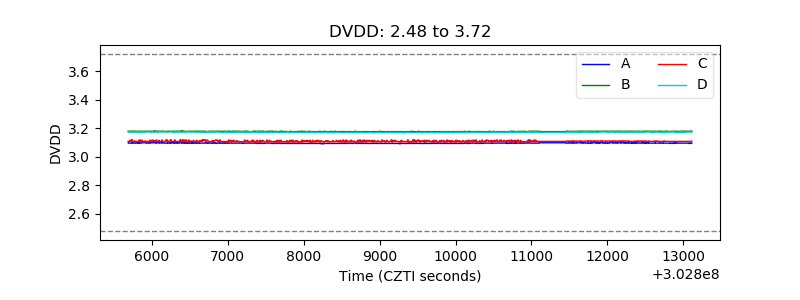 |
| Temperature 1 | 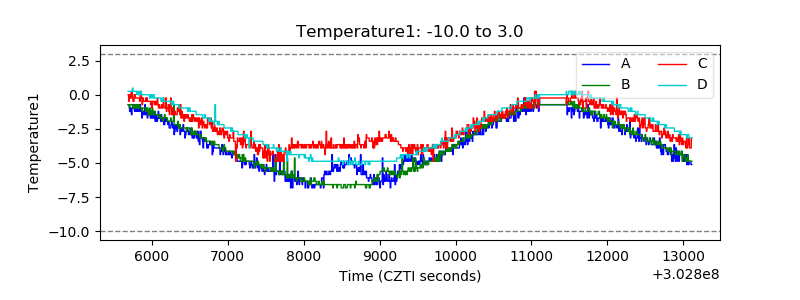 |
| Veto HV Monitor | 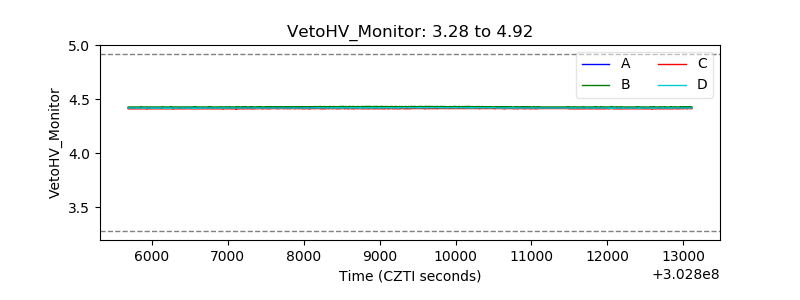 |
| Veto LLD | 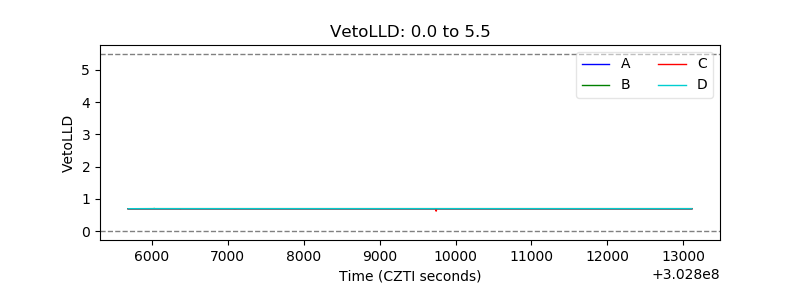 |
| Alpha Counter | 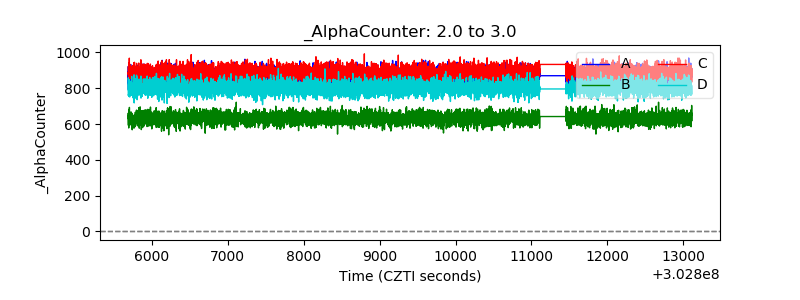 |
| _CPM_Rate | 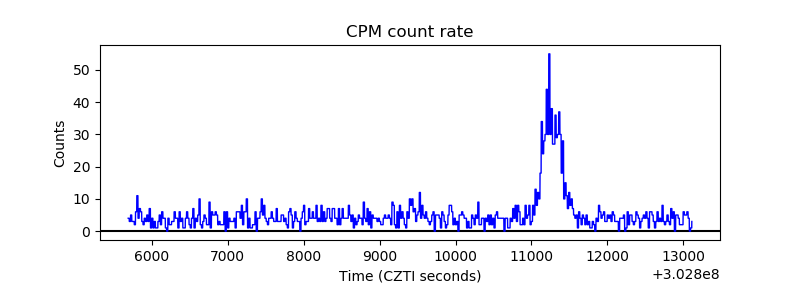 |
| CZT Counter |  |
| +2.5 Volts monitor |  |
| +5 Volts monitor | 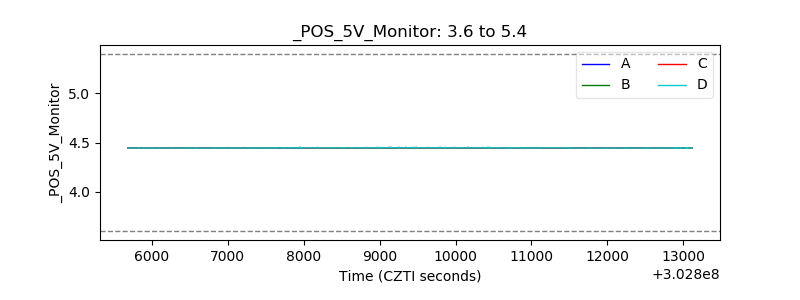 |
| _ROLL_ROT | 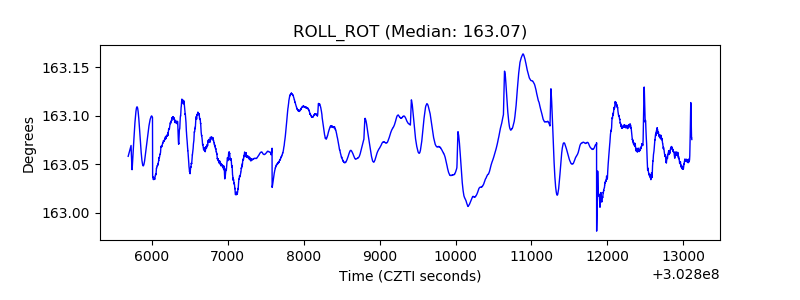 |
| _Roll_DEC | 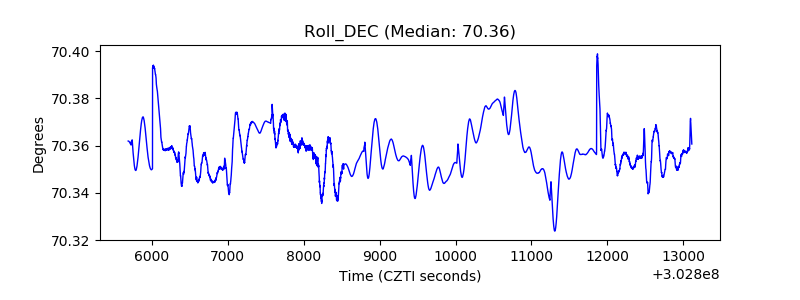 |
| _Roll_RA | 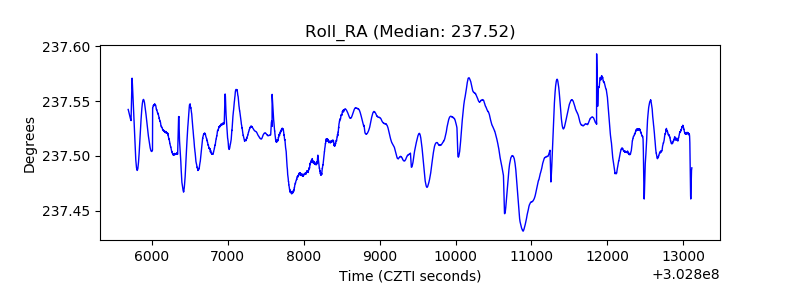 |
| Veto Counter | 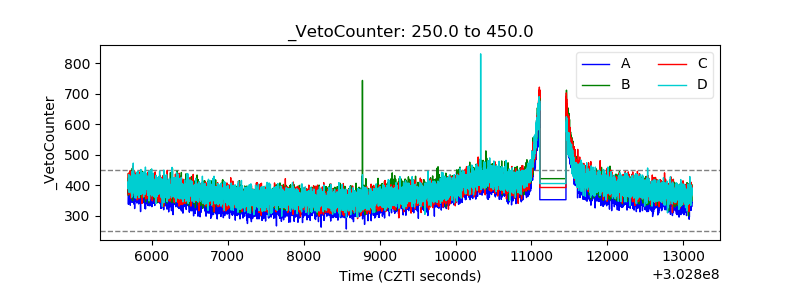 |