| Param | Original file | Final file |
|---|---|---|
| Filename | modeM0/AS1C04_001T01_9000003074_20851cztM0_level2.evt | modeM0/AS1C04_001T01_9000003074_20851cztM0_level2_quad_clean.evt |
| Size (bytes) | 785,468,160 | 164,315,520 |
| Size | 749.1 MB | 156.7 MB |
| Events in quadrant A | 4,767,246 | 1,097,813 |
| Events in quadrant B | 5,096,859 | 1,084,249 |
| Events in quadrant C | 4,697,459 | 1,053,977 |
| Events in quadrant D | 8,526,277 | 1,023,930 |
| Mode M0 | |||
|---|---|---|---|
| Quadrant | BADHDUFLAG | Total packets | Discarded packets |
| A | 0 | 21374 | 2 |
| B | 0 | 22348 | 2 |
| C | 0 | 21093 | 2 |
| D | 0 | 32452 | 2 |
| Mode M9 | |||
|---|---|---|---|
| Quadrant | BADHDUFLAG | Total packets | Discarded packets |
| A | 0 | 5 | 0 |
| B | 0 | 6 | 0 |
| C | 0 | 6 | 0 |
| D | 0 | 6 | 0 |
| Mode SS | |||
|---|---|---|---|
| Quadrant | BADHDUFLAG | Total packets | Discarded packets |
| A | 0 | 210 | 0 |
| B | 0 | 210 | 0 |
| C | 0 | 210 | 0 |
| D | 0 | 210 | 0 |
| Quadrant | Total seconds | Saturated seconds | Saturation percentage |
|---|---|---|---|
| A | 10345 | 34 | 0.328661% |
| B | 10345 | 105 | 1.014983% |
| C | 10345 | 90 | 0.869986% |
| D | 10345 | 282 | 2.725955% |
Noise dominated data is calculated using 1-second bins in cleaned event files. If a bin has >2000 counts, and if more than 50% of those come from <1% of pixels, then it is considered to be noise-dominated and hence unusable.
| Quadrant | # 1 sec bins | Bins with >0 counts | Bins with >2000 counts | High rate bins dominated by noise | Noise dominated (total time) | Noise dominated (detector-on time) | Marked lightcurve |
|---|---|---|---|---|---|---|---|
| A | 10884 | 10344 | 10 | 10 | 0.09% | 0.10% | 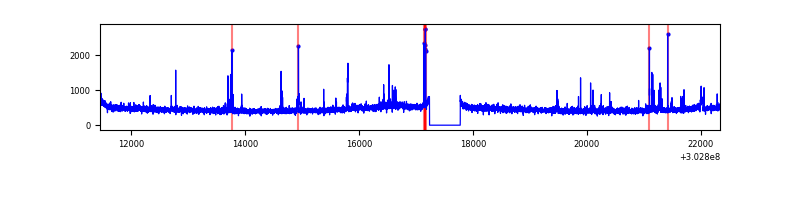 |
| B | 10884 | 10344 | 32 | 32 | 0.29% | 0.31% | 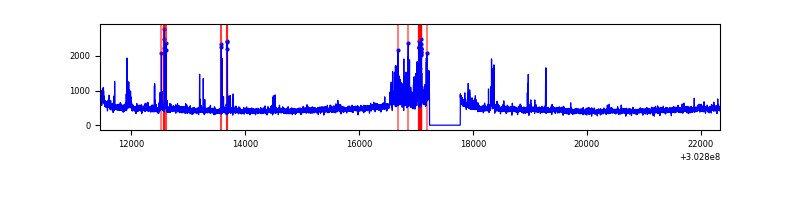 |
| C | 10884 | 10344 | 5 | 5 | 0.05% | 0.05% | 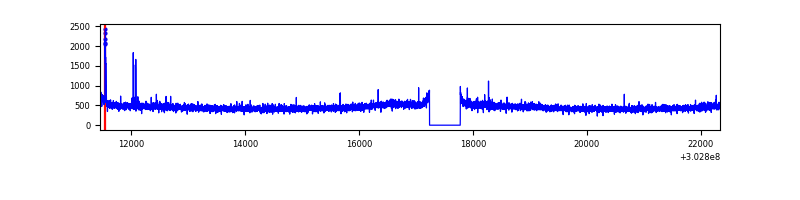 |
| D | 10884 | 10344 | 200 | 200 | 1.84% | 1.93% | 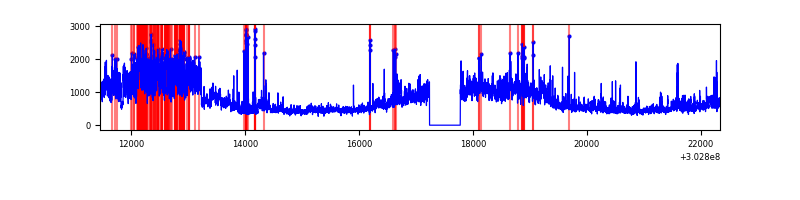 |
Top three noisy pixels from each quadrant. If the there are fewer than three noisy pixels in the level2.evt file, extra rows are filled as -1
| Pixel properties | Quadrant properties | ||||||
|---|---|---|---|---|---|---|---|
| Quadrant | DetID | PixID | Counts | Sigma | Mean | Median | Sigma |
| A | 5 | 16 | 162349 | 671.73 | 1193 | 1168 | 239.9 |
| A | 10 | 253 | 13227 | 50.26 | 1193 | 1168 | 239.9 |
| A | 0 | 226 | 10533 | 39.03 | 1193 | 1168 | 239.9 |
| B | 7 | 220 | 200202 | 896.53 | 1181 | 1150 | 222.0 |
| B | 0 | 190 | 88850 | 395.0 | 1181 | 1150 | 222.0 |
| B | 4 | 216 | 45084 | 197.88 | 1181 | 1150 | 222.0 |
| C | 14 | 238 | 180790 | 676.13 | 1142 | 1149 | 265.7 |
| C | 0 | 207 | 33008 | 119.91 | 1142 | 1149 | 265.7 |
| C | 3 | 233 | 24702 | 88.65 | 1142 | 1149 | 265.7 |
| D | 1 | 20 | 2792785 | 9963.78 | 1157 | 1126 | 280.2 |
| D | 1 | 239 | 902599 | 3217.47 | 1157 | 1126 | 280.2 |
| D | 13 | 153 | 135839 | 480.81 | 1157 | 1126 | 280.2 |
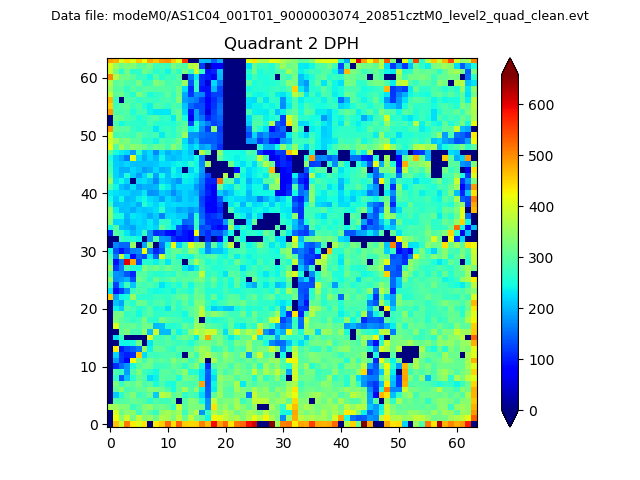
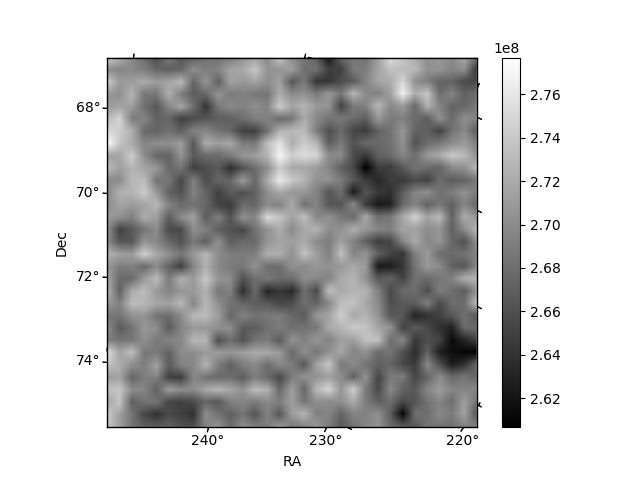
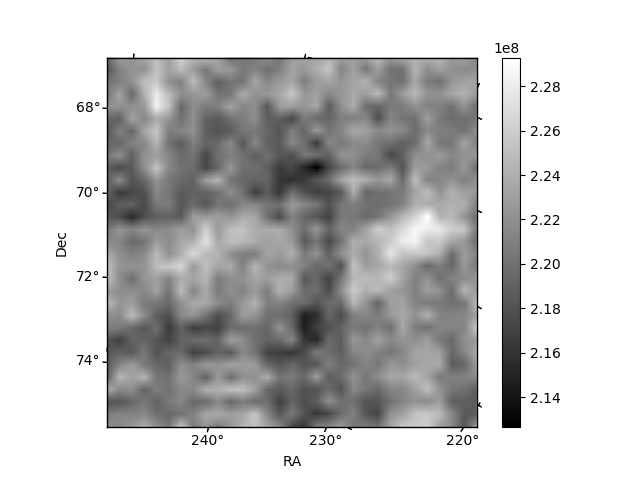
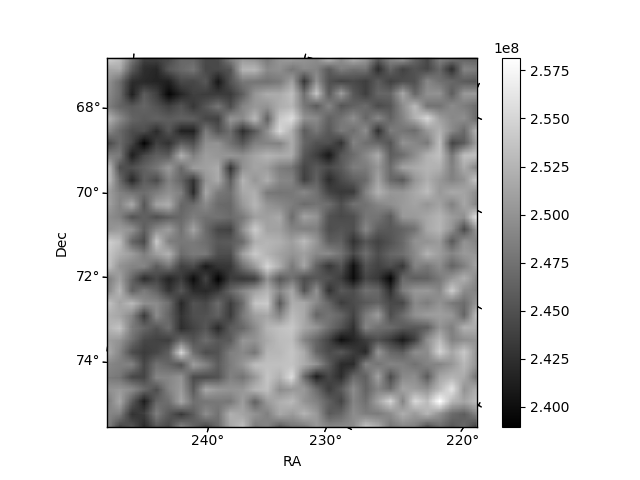
Histogram calculated using DETX and DETY for each event in the final _common_clean file
| Quadrant A | 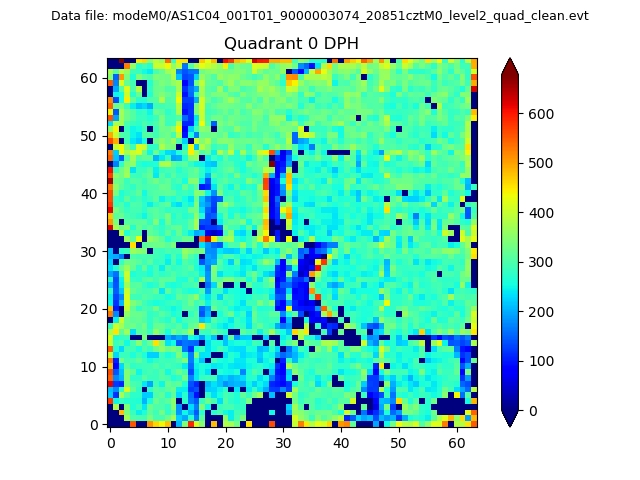 |
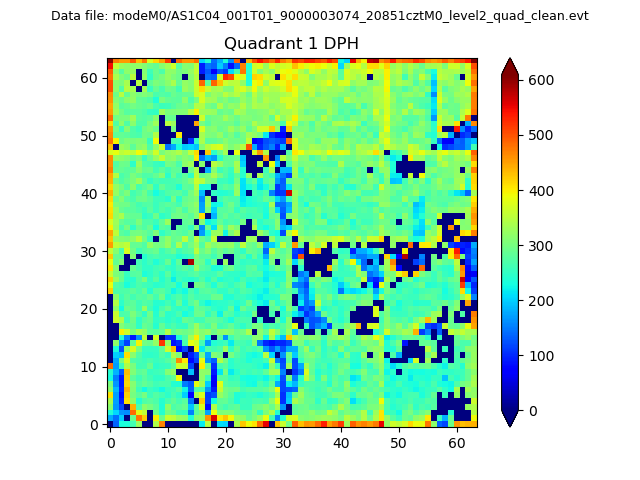 |
Quadrant B |
|---|---|---|---|
| Quadrant D | 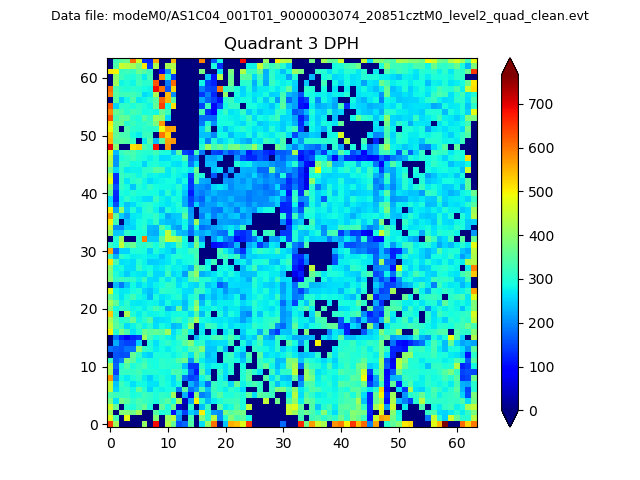 |
 |
Quadrant C |
| Plot type | Count rate plots | Images |
|---|---|---|
| Comparison with Poisson distribution Blue bars denote a histogram of data divided into 1 sec bins. Red curve is a Poisson curve with rate = median count rate of data. |
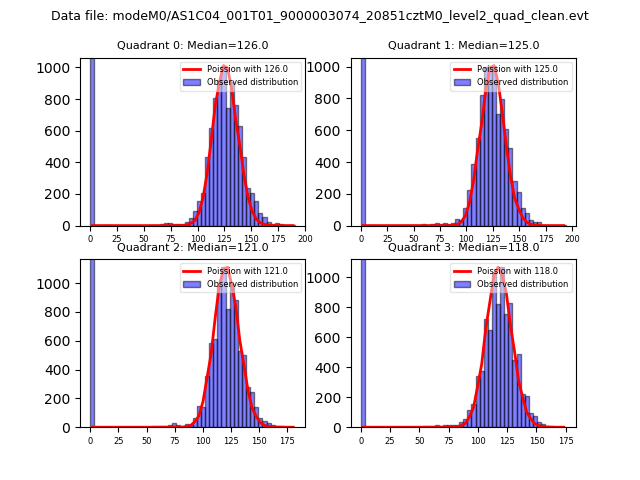 |
 |
| Quadrant-wise count rates Data is divided into 100 sec bins |
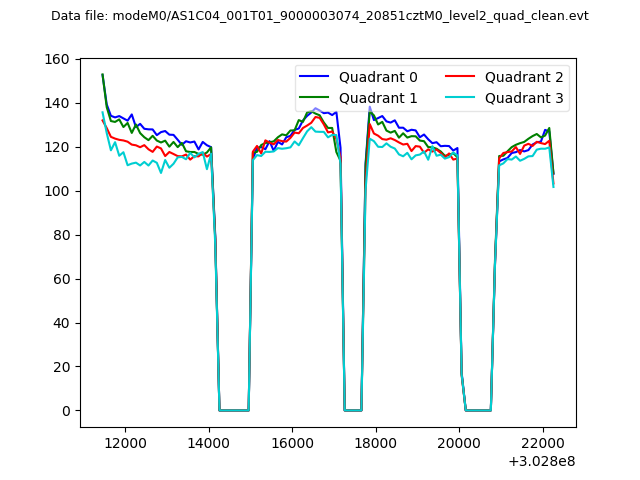 |
|
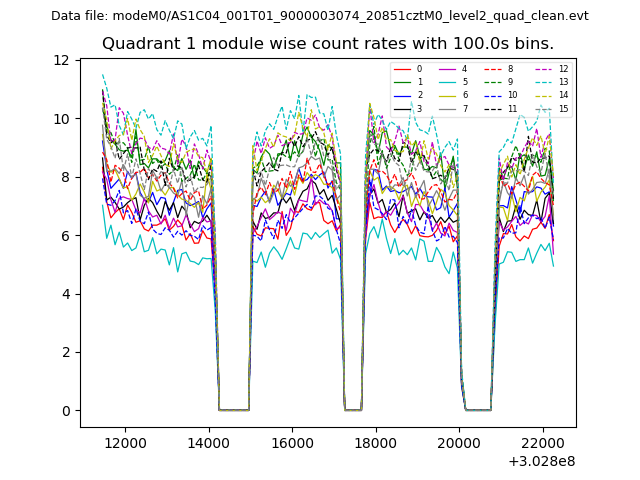
| Module-wise count rates for Quadrant A Data is divided into 100 sec bins |
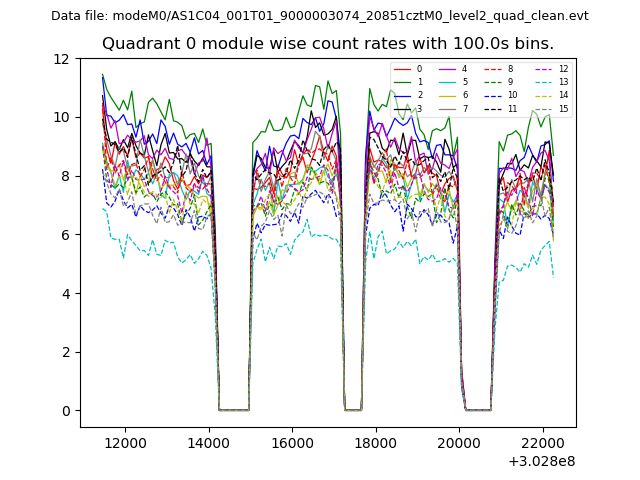 |
 |
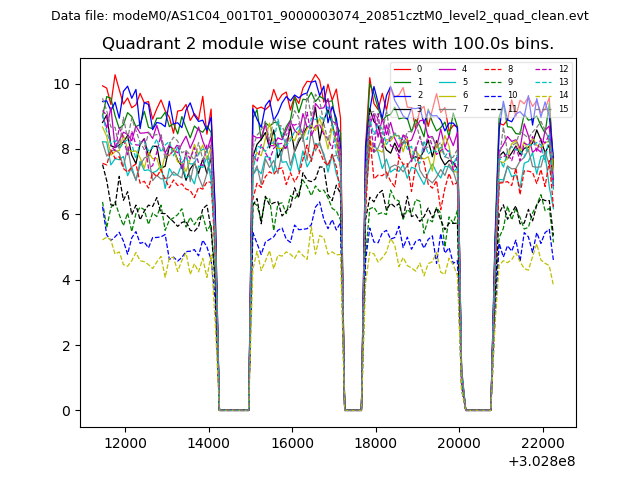
| Module-wise count rates for Quadrant B Data is divided into 100 sec bins |
 |
 |
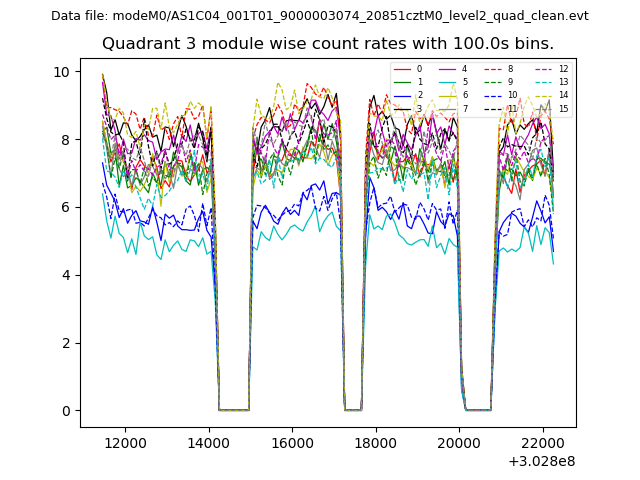
| Module-wise count rates for Quadrant C Data is divided into 100 sec bins |
 |
 |
| Module-wise count rates for Quadrant D Data is divided into 100 sec bins |
 |
 |
| Parameter | Plot |
|---|---|
| CZT HV Monitor | 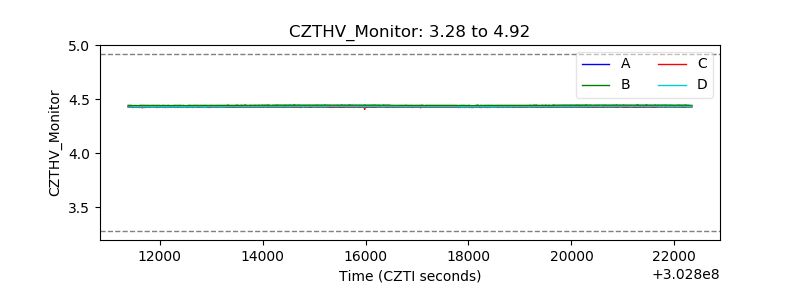 |
| D_VDD | 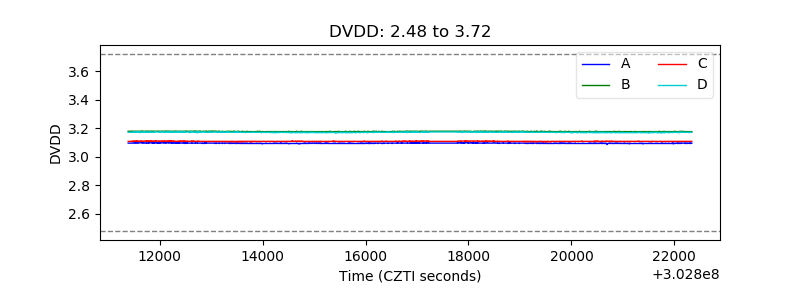 |
| Temperature 1 | 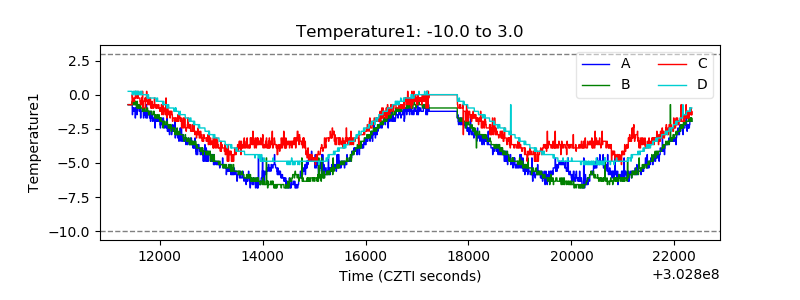 |
| Veto HV Monitor | 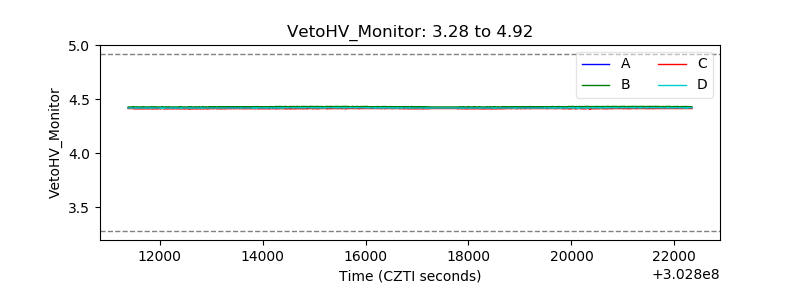 |
| Veto LLD | 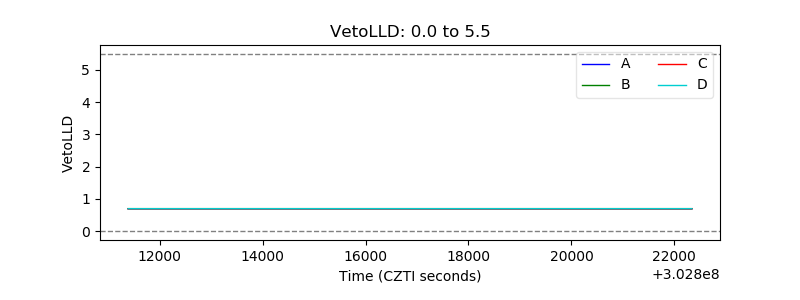 |
| Alpha Counter | 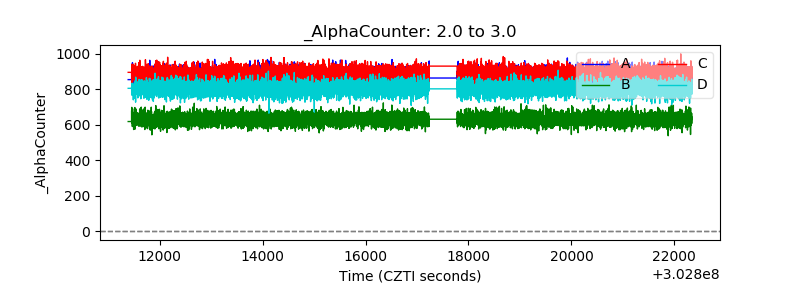 |
| _CPM_Rate | 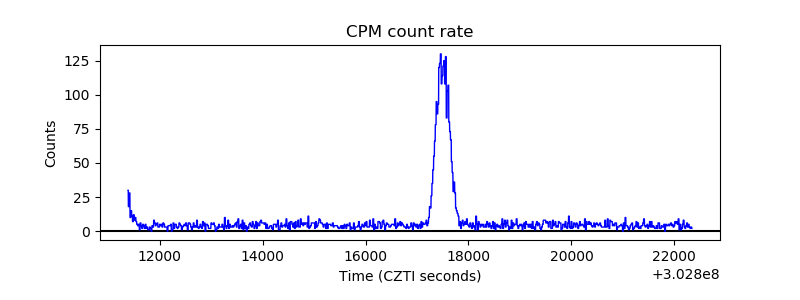 |
| CZT Counter | 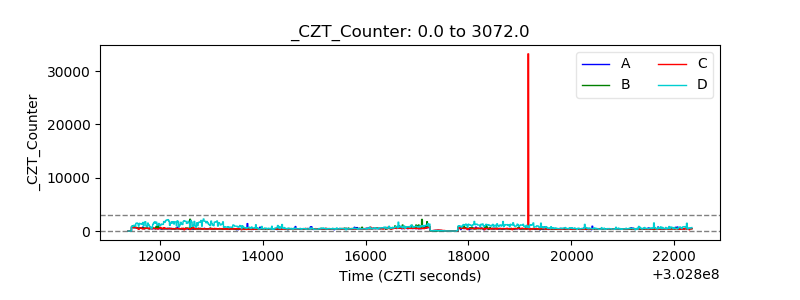 |
| +2.5 Volts monitor |  |
| +5 Volts monitor |  |
| _ROLL_ROT | 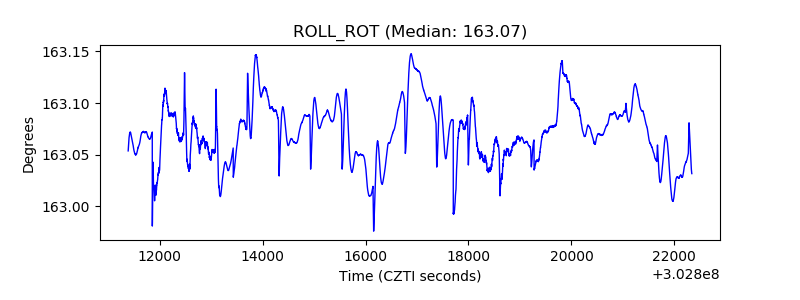 |
| _Roll_DEC |  |
| _Roll_RA |  |
| Veto Counter | 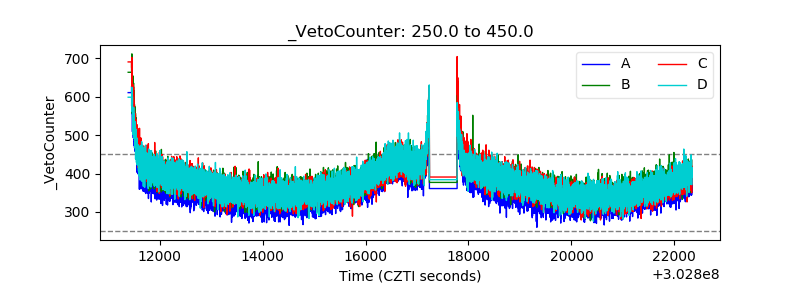 |