| Param | Original file | Final file |
|---|---|---|
| Filename | modeM0/AS1A05_160T01_9000003078_20856cztM0_level2.evt | modeM0/AS1A05_160T01_9000003078_20856cztM0_level2_quad_clean.evt |
| Size (bytes) | 576,141,120 | 96,497,280 |
| Size | 549.5 MB | 92.0 MB |
| Events in quadrant A | 3,235,351 | 646,157 |
| Events in quadrant B | 3,330,718 | 659,962 |
| Events in quadrant C | 3,277,423 | 600,413 |
| Events in quadrant D | 7,183,565 | 580,760 |
| Mode M9 | |||
|---|---|---|---|
| Quadrant | BADHDUFLAG | Total packets | Discarded packets |
| A | 0 | 15 | 0 |
| B | 0 | 16 | 0 |
| C | 0 | 16 | 0 |
| D | 0 | 16 | 0 |
| Mode M0 | |||
|---|---|---|---|
| Quadrant | BADHDUFLAG | Total packets | Discarded packets |
| A | 0 | 13287 | 2 |
| B | 0 | 13552 | 2 |
| C | 0 | 13395 | 2 |
| D | 0 | 25757 | 2 |
| Mode SS | |||
|---|---|---|---|
| Quadrant | BADHDUFLAG | Total packets | Discarded packets |
| A | 0 | 126 | 0 |
| B | 0 | 126 | 0 |
| C | 0 | 126 | 0 |
| D | 0 | 126 | 0 |
| Quadrant | Total seconds | Saturated seconds | Saturation percentage |
|---|---|---|---|
| A | 6237 | 50 | 0.801667% |
| B | 6237 | 75 | 1.202501% |
| C | 6237 | 110 | 1.763668% |
| D | 6237 | 370 | 5.932339% |
Noise dominated data is calculated using 1-second bins in cleaned event files. If a bin has >2000 counts, and if more than 50% of those come from <1% of pixels, then it is considered to be noise-dominated and hence unusable.
| Quadrant | # 1 sec bins | Bins with >0 counts | Bins with >2000 counts | High rate bins dominated by noise | Noise dominated (total time) | Noise dominated (detector-on time) | Marked lightcurve |
|---|---|---|---|---|---|---|---|
| A | 7482 | 6238 | 0 | 0 | 0.00% | 0.00% | 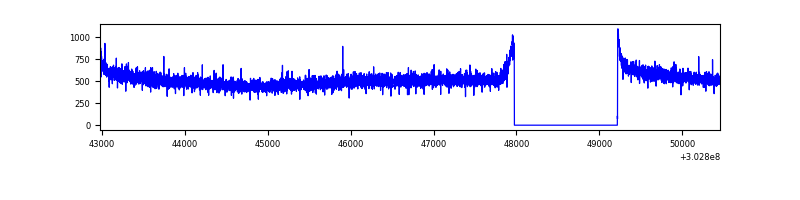 |
| B | 7482 | 6238 | 0 | 0 | 0.00% | 0.00% | 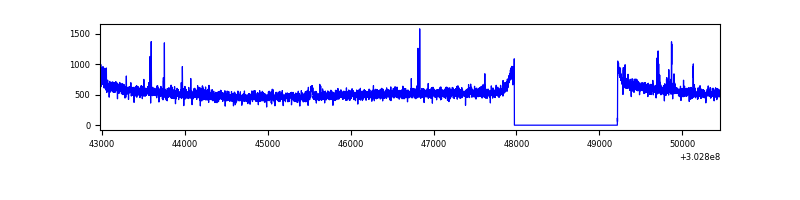 |
| C | 7482 | 6238 | 21 | 21 | 0.28% | 0.34% | 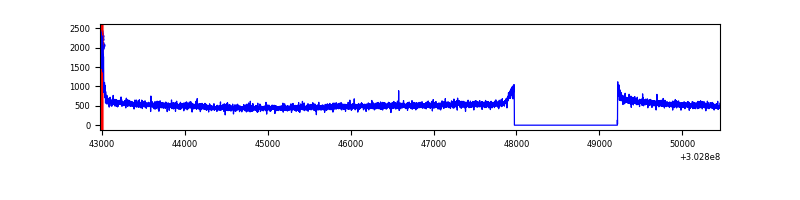 |
| D | 7482 | 6238 | 243 | 243 | 3.25% | 3.90% | 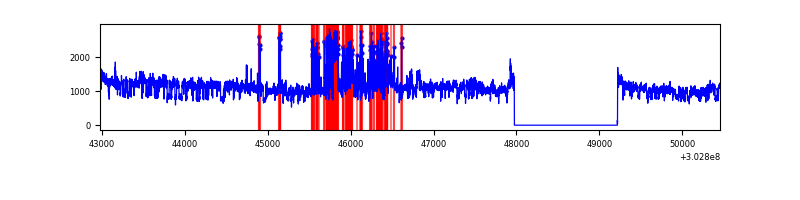 |
Top three noisy pixels from each quadrant. If the there are fewer than three noisy pixels in the level2.evt file, extra rows are filled as -1
| Pixel properties | Quadrant properties | ||||||
|---|---|---|---|---|---|---|---|
| Quadrant | DetID | PixID | Counts | Sigma | Mean | Median | Sigma |
| A | 0 | 226 | 7366 | 38.78 | 840 | 825 | 168.7 |
| A | 3 | 137 | 6464 | 33.43 | 840 | 825 | 168.7 |
| A | 12 | 194 | 5953 | 30.4 | 840 | 825 | 168.7 |
| B | 0 | 219 | 28189 | 174.06 | 833 | 814 | 157.3 |
| B | 0 | 189 | 26757 | 164.96 | 833 | 814 | 157.3 |
| B | 12 | 111 | 18276 | 111.03 | 833 | 814 | 157.3 |
| C | 14 | 238 | 125111 | 685.12 | 784 | 790 | 181.5 |
| C | 0 | 10 | 72336 | 394.28 | 784 | 790 | 181.5 |
| C | 7 | 220 | 9301 | 46.9 | 784 | 790 | 181.5 |
| D | 1 | 239 | 3365320 | 17676.31 | 791 | 770 | 190.3 |
| D | 9 | 1 | 651726 | 3419.92 | 791 | 770 | 190.3 |
| D | 1 | 52 | 102354 | 533.69 | 791 | 770 | 190.3 |
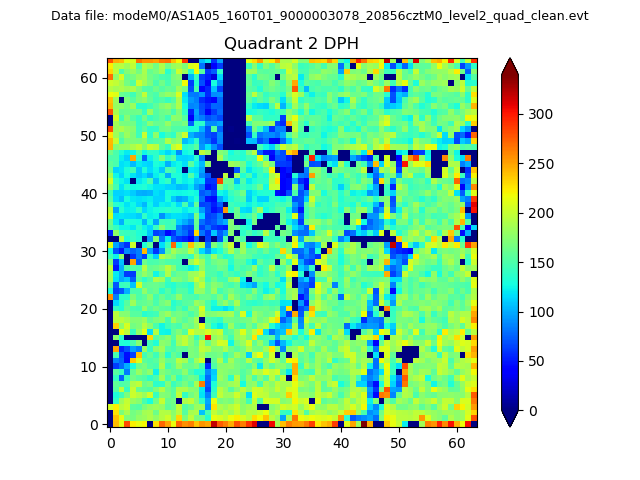
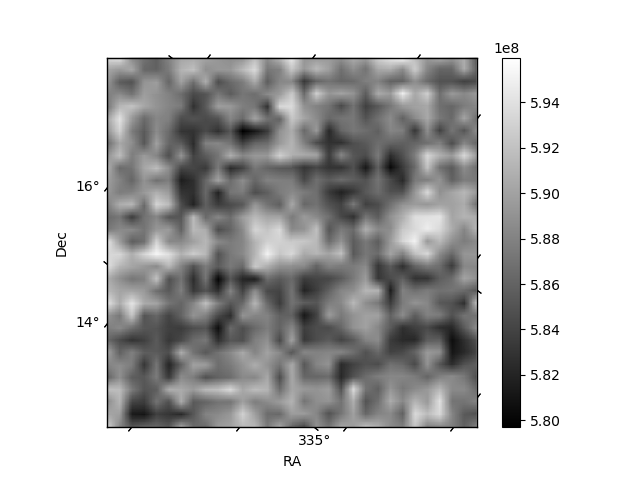
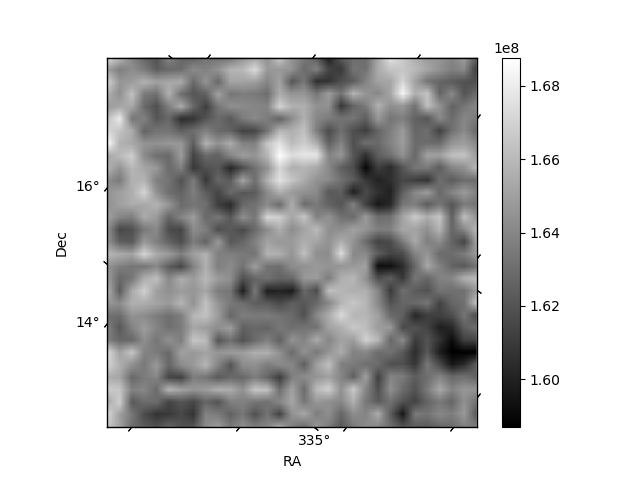
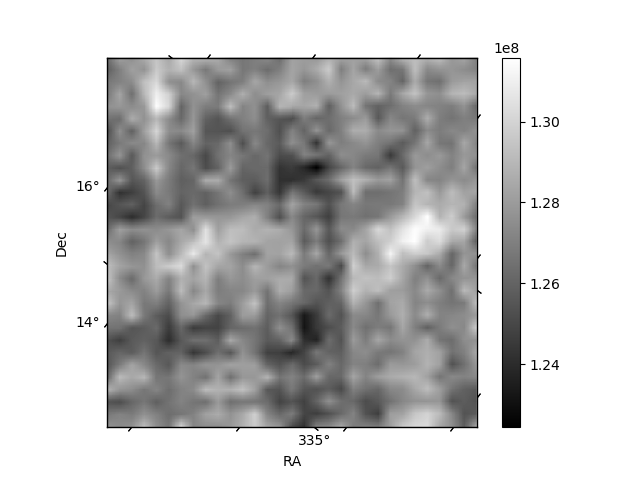
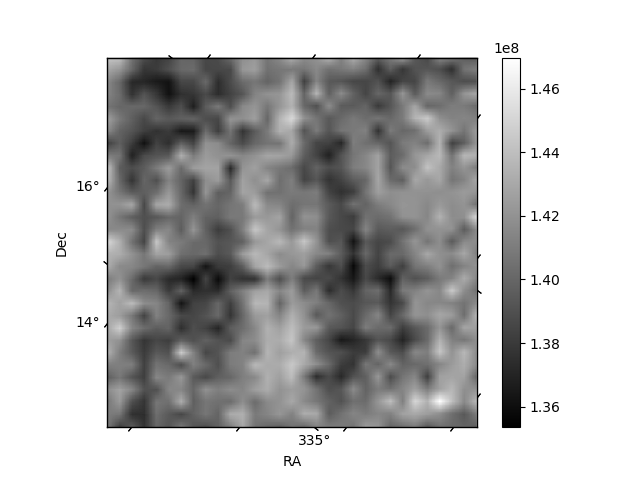
Histogram calculated using DETX and DETY for each event in the final _common_clean file
| Quadrant A | 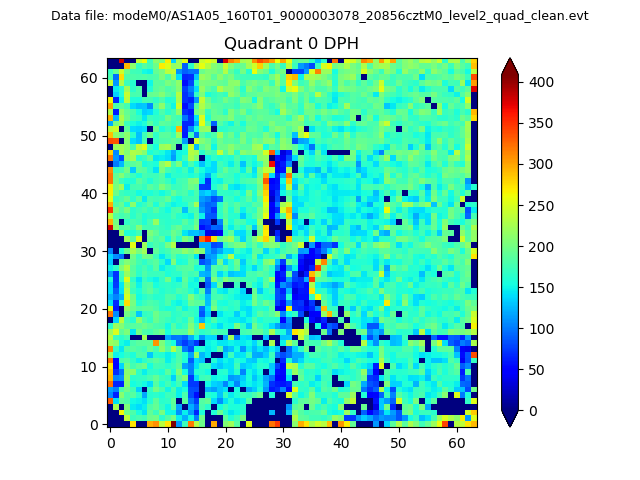 |
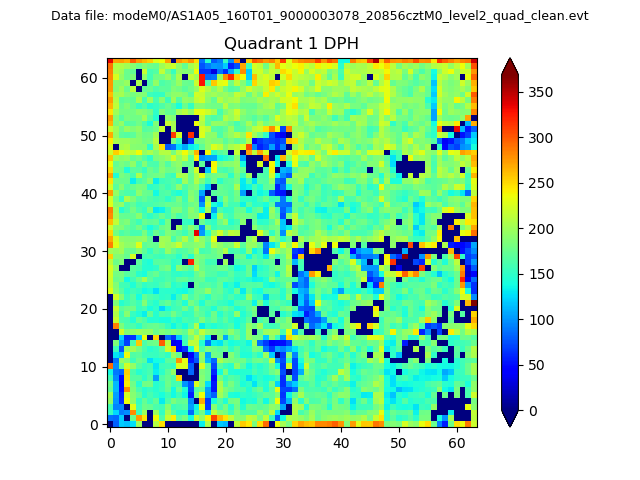 |
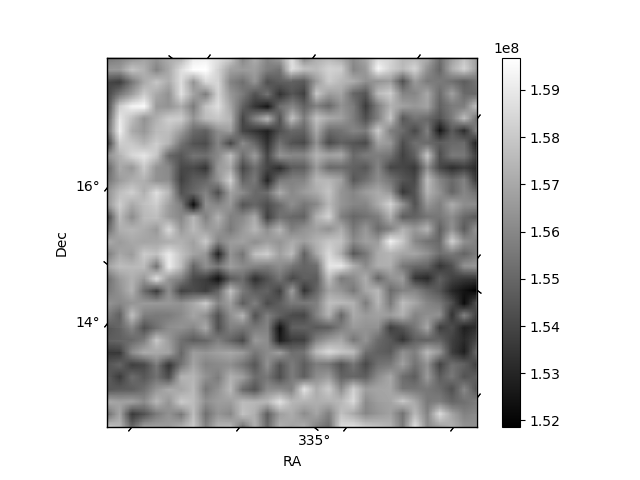
Quadrant B |
|---|---|---|---|
| Quadrant D | 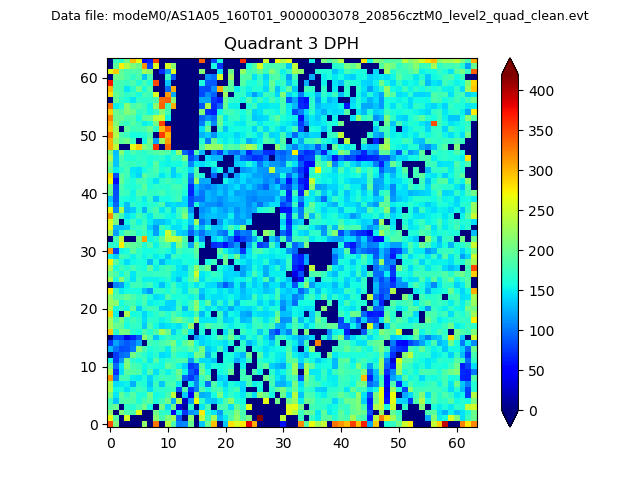 |
 |
Quadrant C |
| Plot type | Count rate plots | Images |
|---|---|---|
| Comparison with Poisson distribution Blue bars denote a histogram of data divided into 1 sec bins. Red curve is a Poisson curve with rate = median count rate of data. |
 |
 |
| Quadrant-wise count rates Data is divided into 100 sec bins |
 |
|
| Module-wise count rates for Quadrant A Data is divided into 100 sec bins |
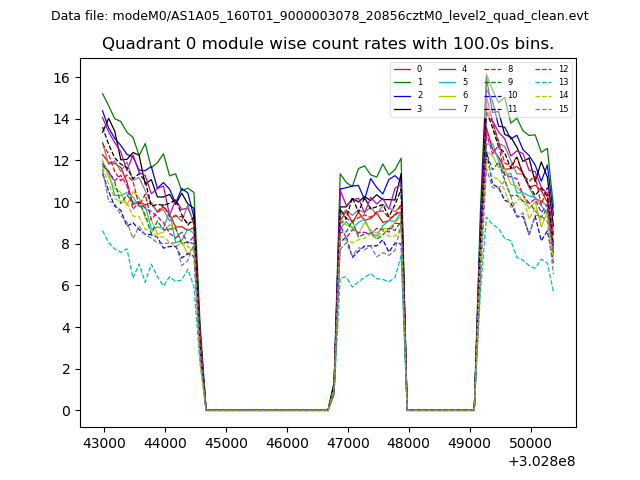 |
 |
| Module-wise count rates for Quadrant B Data is divided into 100 sec bins |
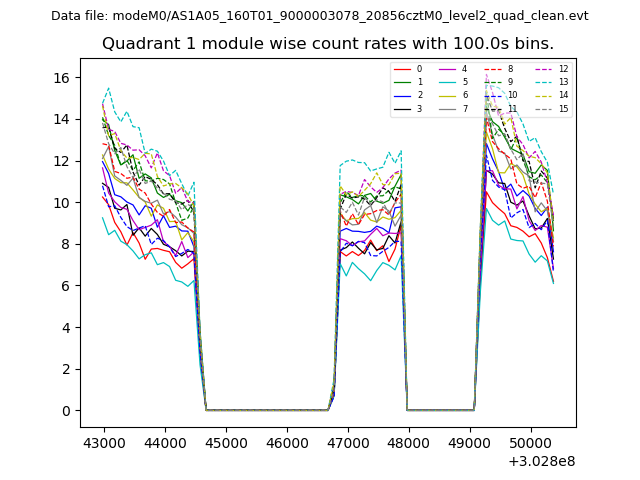 |
 |
| Module-wise count rates for Quadrant C Data is divided into 100 sec bins |
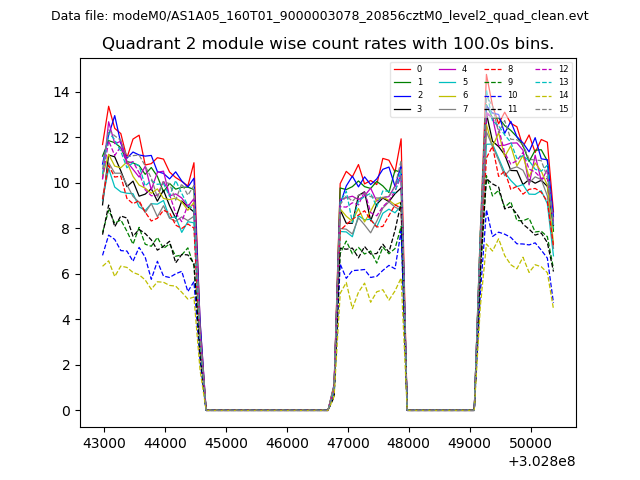 |
 |
| Module-wise count rates for Quadrant D Data is divided into 100 sec bins |
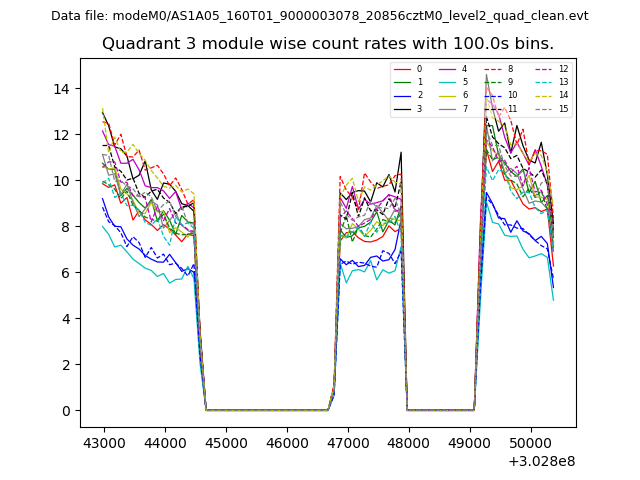 |
 |
| Parameter | Plot |
|---|---|
| CZT HV Monitor | 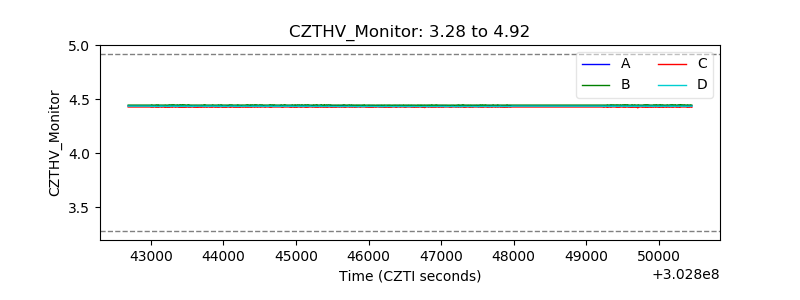 |
| D_VDD | 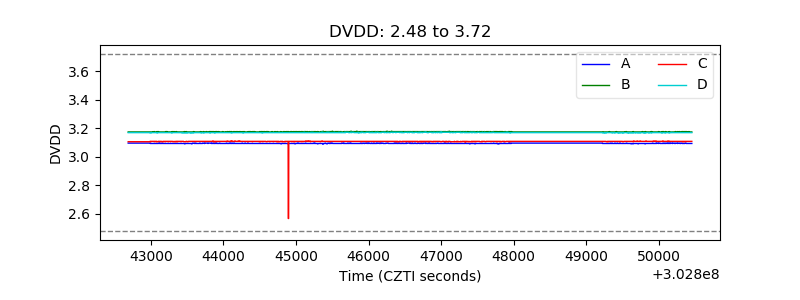 |
| Temperature 1 | 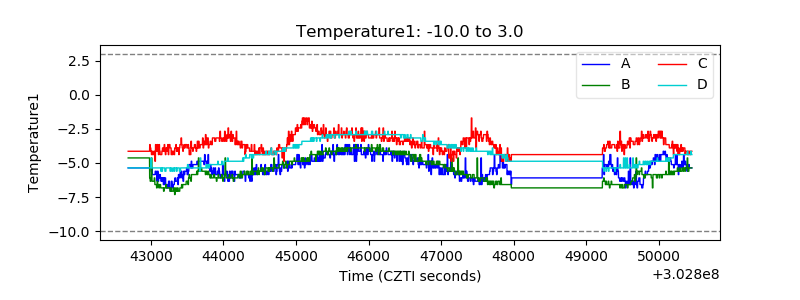 |
| Veto HV Monitor |  |
| Veto LLD | 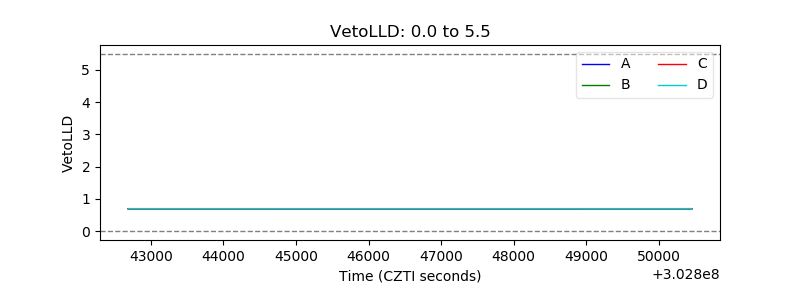 |
| Alpha Counter | 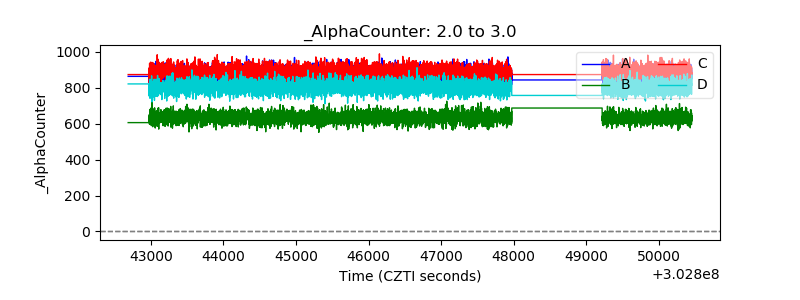 |
| _CPM_Rate |  |
| CZT Counter | 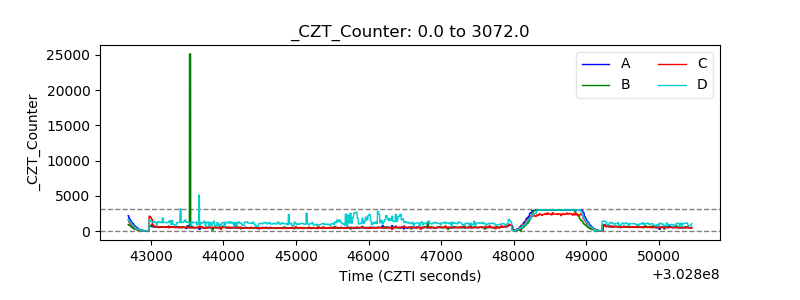 |
| +2.5 Volts monitor |  |
| +5 Volts monitor |  |
| _ROLL_ROT | 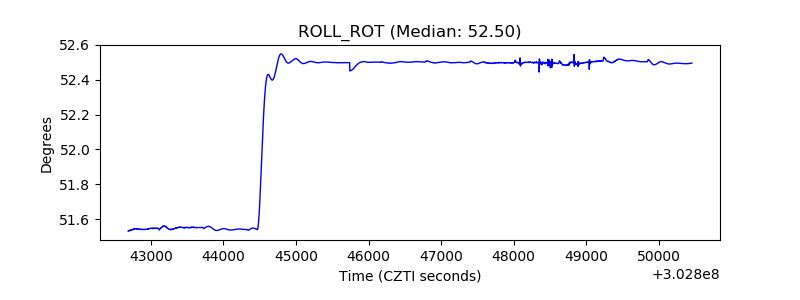 |
| _Roll_DEC | 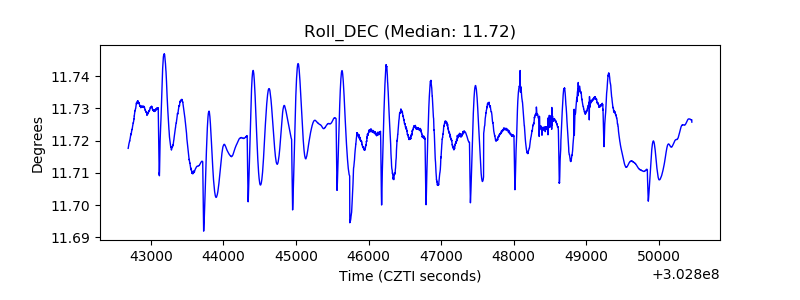 |
| _Roll_RA | 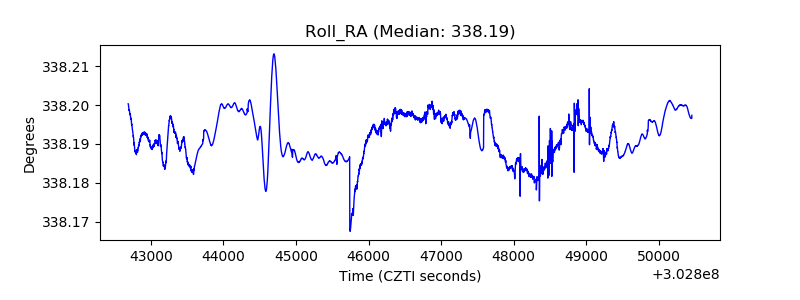 |
| Veto Counter | 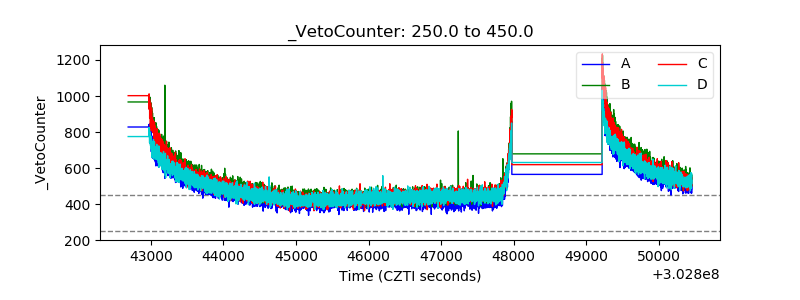 |