| Param | Original file | Final file |
|---|---|---|
| Filename | modeM0/AS1A05_160T01_9000003078_20857cztM0_level2.evt | modeM0/AS1A05_160T01_9000003078_20857cztM0_level2_quad_clean.evt |
| Size (bytes) | 581,610,240 | 90,803,520 |
| Size | 554.7 MB | 86.6 MB |
| Events in quadrant A | 3,438,390 | 600,054 |
| Events in quadrant B | 3,502,237 | 614,056 |
| Events in quadrant C | 3,530,760 | 555,430 |
| Events in quadrant D | 6,715,834 | 539,478 |
| Mode M9 | |||
|---|---|---|---|
| Quadrant | BADHDUFLAG | Total packets | Discarded packets |
| A | 0 | 14 | 0 |
| B | 0 | 15 | 0 |
| C | 0 | 15 | 0 |
| D | 0 | 15 | 0 |
| Mode M0 | |||
|---|---|---|---|
| Quadrant | BADHDUFLAG | Total packets | Discarded packets |
| A | 0 | 13831 | 2 |
| B | 0 | 14084 | 2 |
| C | 0 | 14162 | 2 |
| D | 0 | 24535 | 2 |
| Mode SS | |||
|---|---|---|---|
| Quadrant | BADHDUFLAG | Total packets | Discarded packets |
| A | 0 | 128 | 0 |
| B | 0 | 128 | 0 |
| C | 0 | 128 | 0 |
| D | 0 | 128 | 0 |
| Quadrant | Total seconds | Saturated seconds | Saturation percentage |
|---|---|---|---|
| A | 6315 | 93 | 1.472684% |
| B | 6314 | 107 | 1.694647% |
| C | 6314 | 189 | 2.993348% |
| D | 6314 | 158 | 2.502376% |
Noise dominated data is calculated using 1-second bins in cleaned event files. If a bin has >2000 counts, and if more than 50% of those come from <1% of pixels, then it is considered to be noise-dominated and hence unusable.
| Quadrant | # 1 sec bins | Bins with >0 counts | Bins with >2000 counts | High rate bins dominated by noise | Noise dominated (total time) | Noise dominated (detector-on time) | Marked lightcurve |
|---|---|---|---|---|---|---|---|
| A | 7625 | 6316 | 0 | 0 | 0.00% | 0.00% | 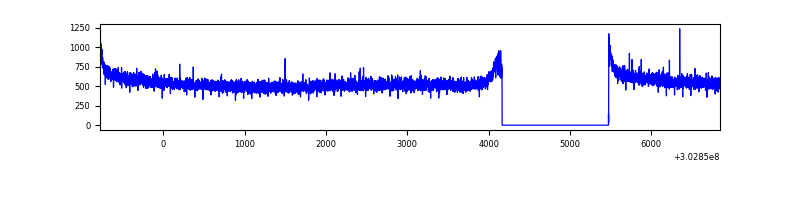 |
| B | 7624 | 6315 | 1 | 1 | 0.01% | 0.02% | 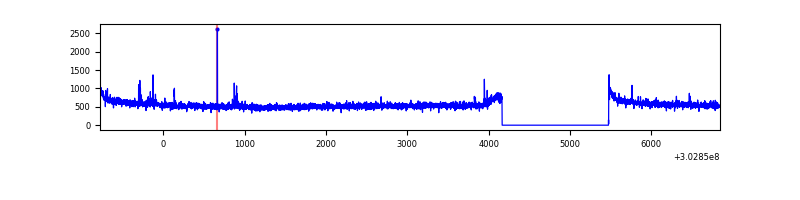 |
| C | 7624 | 6315 | 60 | 60 | 0.79% | 0.95% | 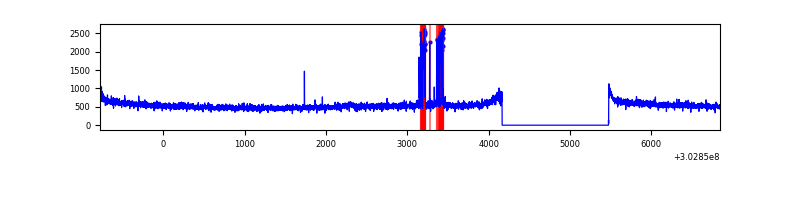 |
| D | 7624 | 6315 | 27 | 27 | 0.35% | 0.43% | 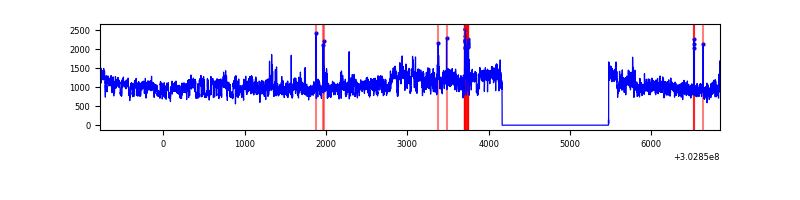 |
Top three noisy pixels from each quadrant. If the there are fewer than three noisy pixels in the level2.evt file, extra rows are filled as -1
| Pixel properties | Quadrant properties | ||||||
|---|---|---|---|---|---|---|---|
| Quadrant | DetID | PixID | Counts | Sigma | Mean | Median | Sigma |
| A | 14 | 111 | 8027 | 40.44 | 893 | 877 | 176.8 |
| A | 0 | 226 | 7778 | 39.03 | 893 | 877 | 176.8 |
| A | 3 | 137 | 6618 | 32.47 | 893 | 877 | 176.8 |
| B | 0 | 189 | 26360 | 154.48 | 880 | 861 | 165.1 |
| B | 0 | 183 | 20115 | 116.65 | 880 | 861 | 165.1 |
| B | 12 | 111 | 19430 | 112.5 | 880 | 861 | 165.1 |
| C | 9 | 54 | 176339 | 931.78 | 823 | 830 | 188.4 |
| C | 14 | 238 | 131913 | 695.92 | 823 | 830 | 188.4 |
| C | 10 | 91 | 7391 | 34.83 | 823 | 830 | 188.4 |
| D | 1 | 239 | 3315092 | 16529.4 | 846 | 825 | 200.5 |
| D | 1 | 52 | 103087 | 510.02 | 846 | 825 | 200.5 |
| D | 7 | 223 | 43127 | 210.97 | 846 | 825 | 200.5 |
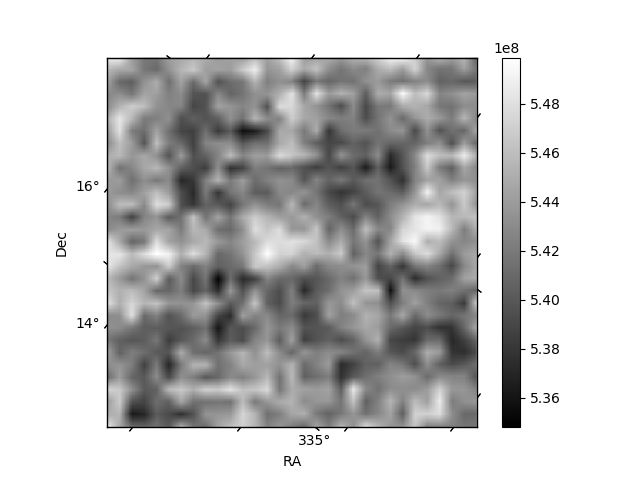
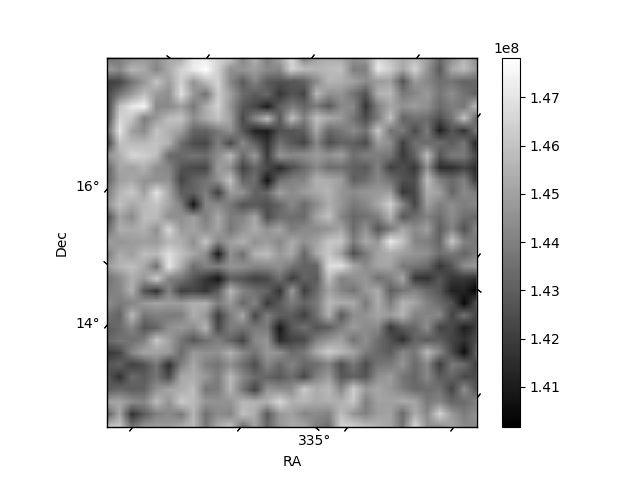
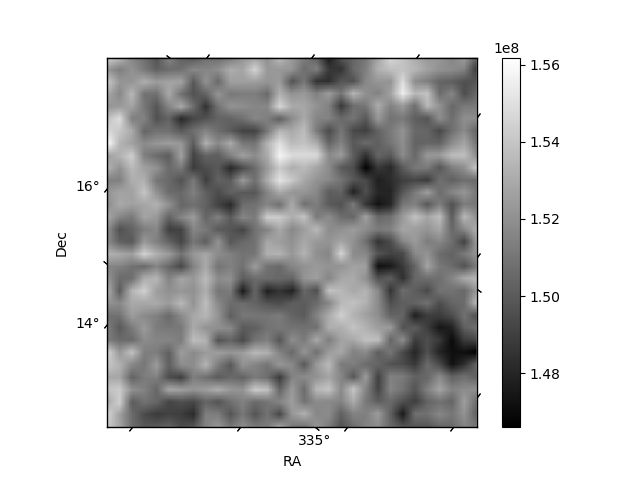
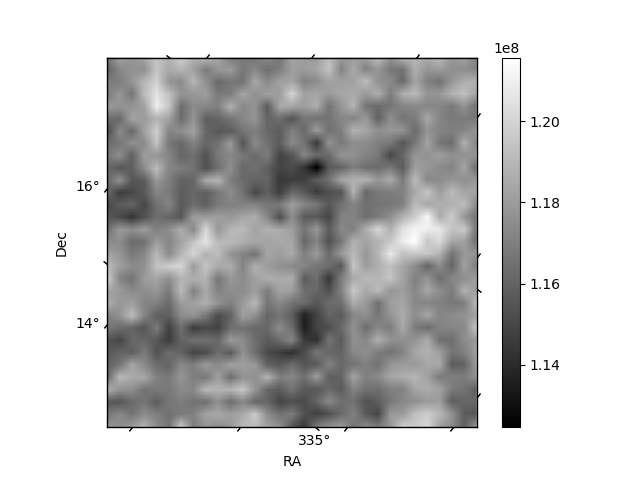
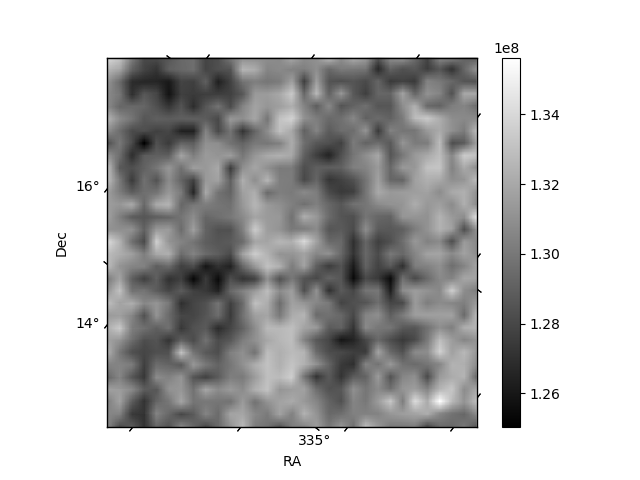
Histogram calculated using DETX and DETY for each event in the final _common_clean file
| Quadrant A | 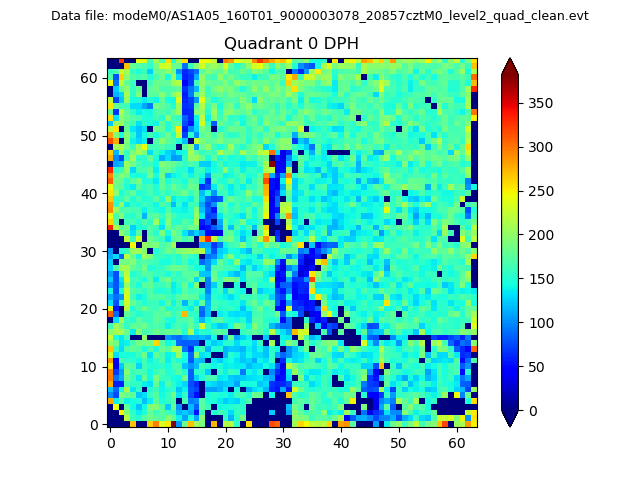 |
 |
Quadrant B |
|---|---|---|---|
| Quadrant D | 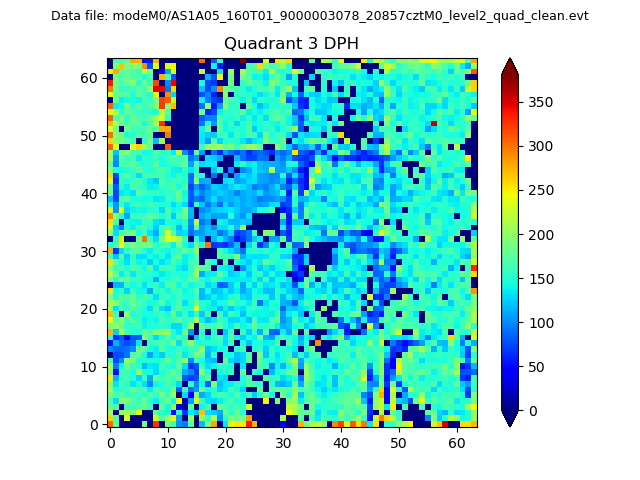 |
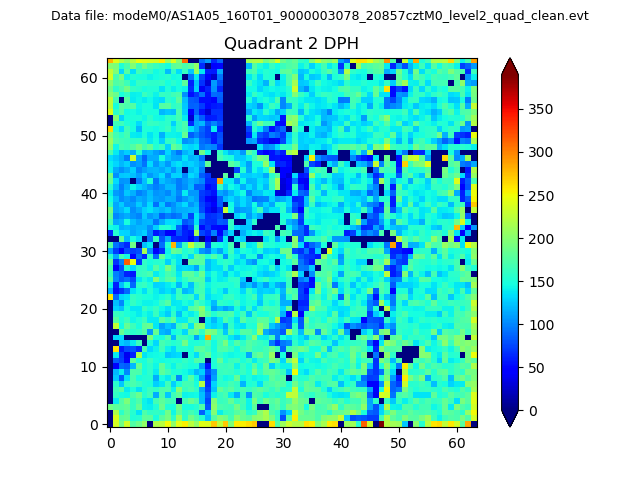 |
Quadrant C |
| Plot type | Count rate plots | Images |
|---|---|---|
| Comparison with Poisson distribution Blue bars denote a histogram of data divided into 1 sec bins. Red curve is a Poisson curve with rate = median count rate of data. |
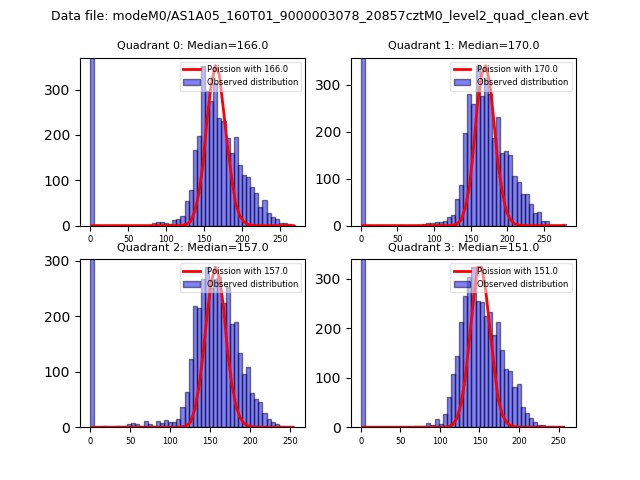 |
 |
| Quadrant-wise count rates Data is divided into 100 sec bins |
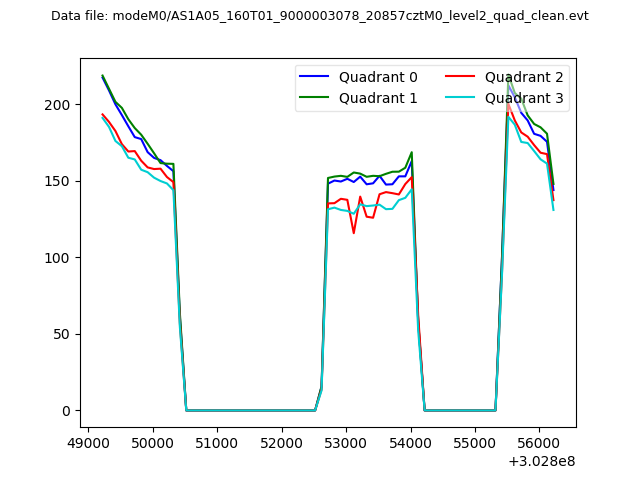 |
|
| Module-wise count rates for Quadrant A Data is divided into 100 sec bins |
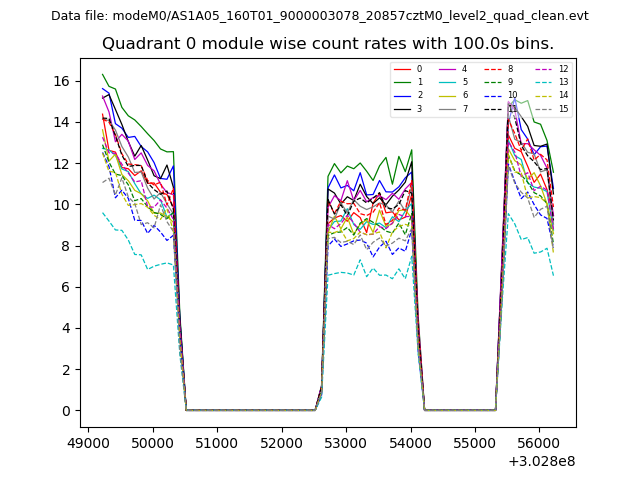 |
 |
| Module-wise count rates for Quadrant B Data is divided into 100 sec bins |
 |
 |
| Module-wise count rates for Quadrant C Data is divided into 100 sec bins |
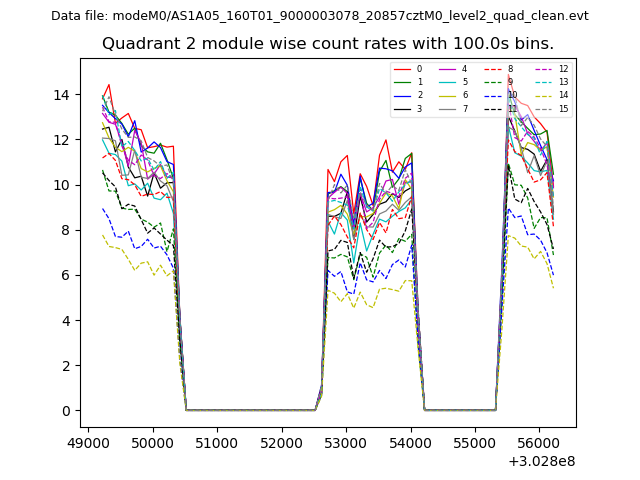 |
 |
| Module-wise count rates for Quadrant D Data is divided into 100 sec bins |
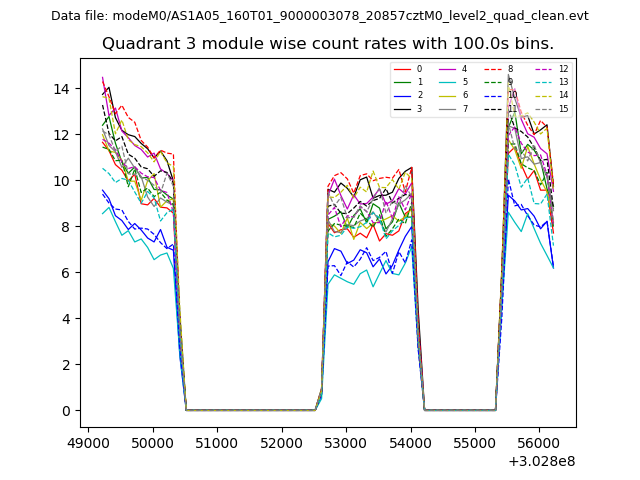 |
 |
| Parameter | Plot |
|---|---|
| CZT HV Monitor |  |
| D_VDD | 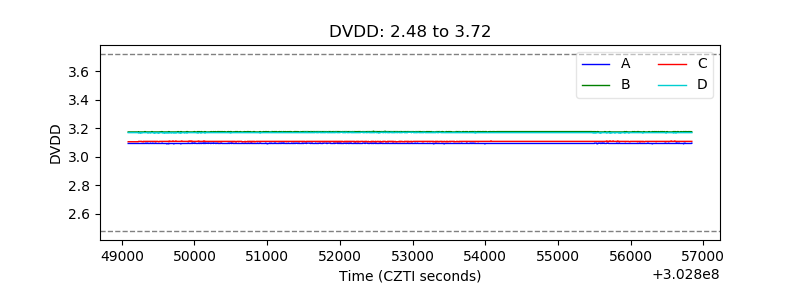 |
| Temperature 1 | 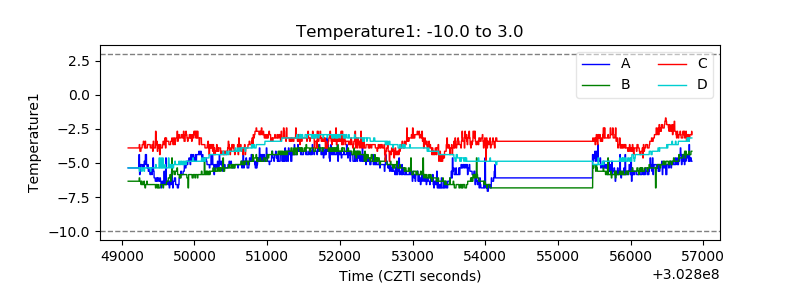 |
| Veto HV Monitor | 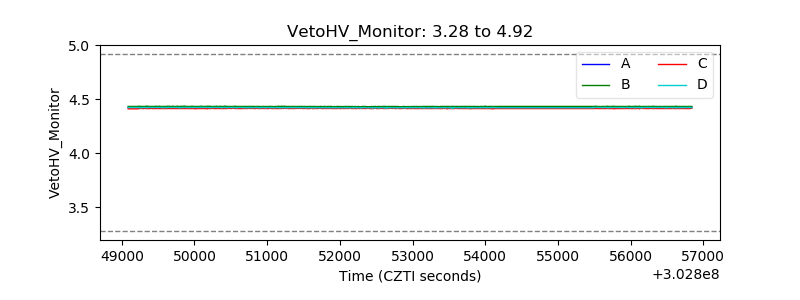 |
| Veto LLD | 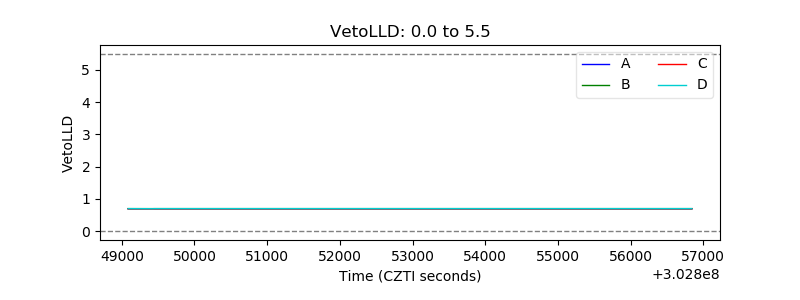 |
| Alpha Counter | 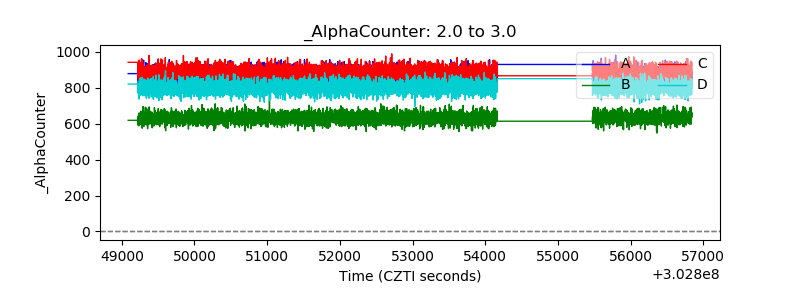 |
| _CPM_Rate | 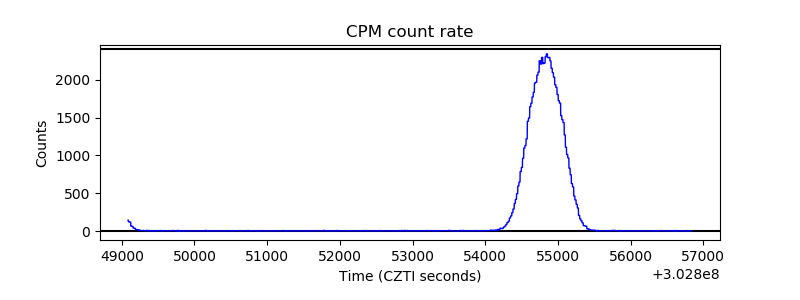 |
| CZT Counter | 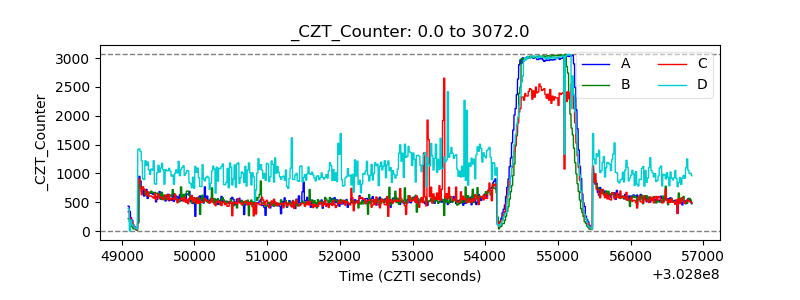 |
| +2.5 Volts monitor |  |
| +5 Volts monitor | 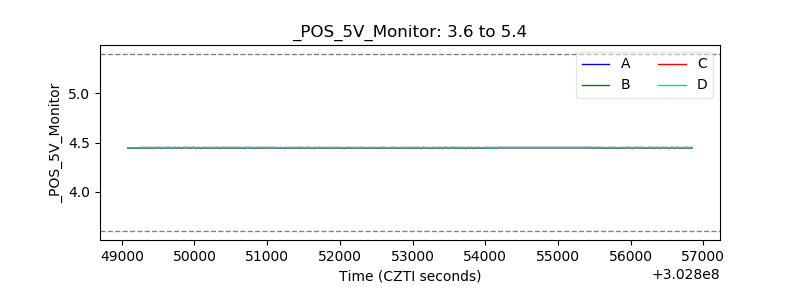 |
| _ROLL_ROT | 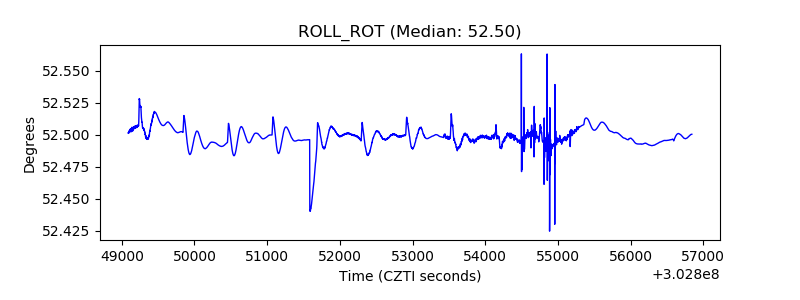 |
| _Roll_DEC | 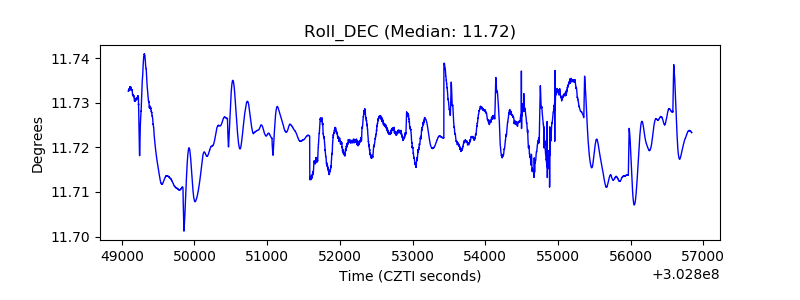 |
| _Roll_RA | 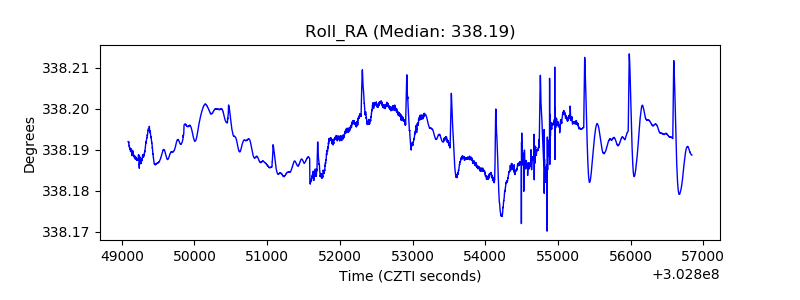 |
| Veto Counter | 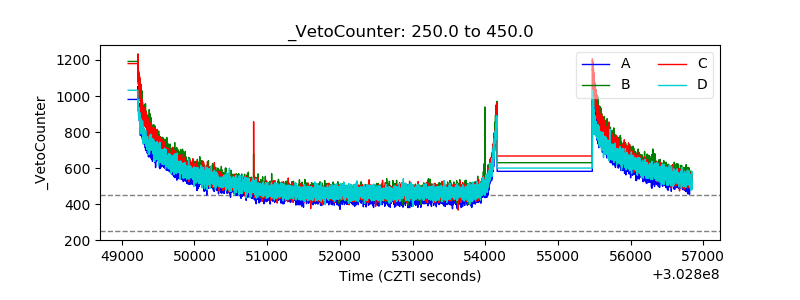 |