| Param | Original file | Final file |
|---|---|---|
| Filename | modeM0/AS1A05_160T01_9000003078_20858cztM0_level2.evt | modeM0/AS1A05_160T01_9000003078_20858cztM0_level2_quad_clean.evt |
| Size (bytes) | 562,348,800 | 79,214,400 |
| Size | 536.3 MB | 75.5 MB |
| Events in quadrant A | 3,434,545 | 505,742 |
| Events in quadrant B | 3,493,710 | 519,886 |
| Events in quadrant C | 3,407,030 | 473,594 |
| Events in quadrant D | 6,271,281 | 461,617 |
| Mode M9 | |||
|---|---|---|---|
| Quadrant | BADHDUFLAG | Total packets | Discarded packets |
| A | 0 | 14 | 0 |
| B | 0 | 14 | 0 |
| C | 0 | 14 | 0 |
| D | 0 | 14 | 0 |
| Mode M0 | |||
|---|---|---|---|
| Quadrant | BADHDUFLAG | Total packets | Discarded packets |
| A | 0 | 13736 | 1 |
| B | 0 | 13922 | 1 |
| C | 0 | 13637 | 1 |
| D | 0 | 23050 | 2 |
| Mode SS | |||
|---|---|---|---|
| Quadrant | BADHDUFLAG | Total packets | Discarded packets |
| A | 0 | 126 | 0 |
| B | 0 | 126 | 0 |
| C | 0 | 126 | 0 |
| D | 0 | 126 | 0 |
| Quadrant | Total seconds | Saturated seconds | Saturation percentage |
|---|---|---|---|
| A | 6279 | 76 | 1.210384% |
| B | 6279 | 103 | 1.640389% |
| C | 6280 | 111 | 1.767516% |
| D | 6279 | 100 | 1.592610% |
Noise dominated data is calculated using 1-second bins in cleaned event files. If a bin has >2000 counts, and if more than 50% of those come from <1% of pixels, then it is considered to be noise-dominated and hence unusable.
| Quadrant | # 1 sec bins | Bins with >0 counts | Bins with >2000 counts | High rate bins dominated by noise | Noise dominated (total time) | Noise dominated (detector-on time) | Marked lightcurve |
|---|---|---|---|---|---|---|---|
| A | 7629 | 6280 | 0 | 0 | 0.00% | 0.00% | 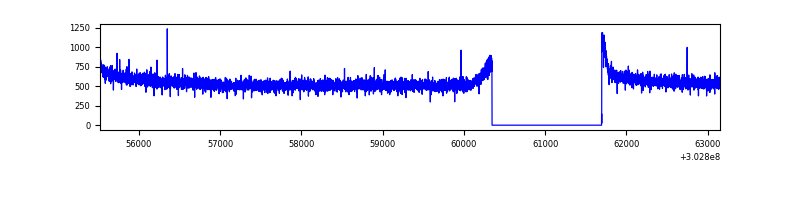 |
| B | 7629 | 6280 | 1 | 1 | 0.01% | 0.02% | 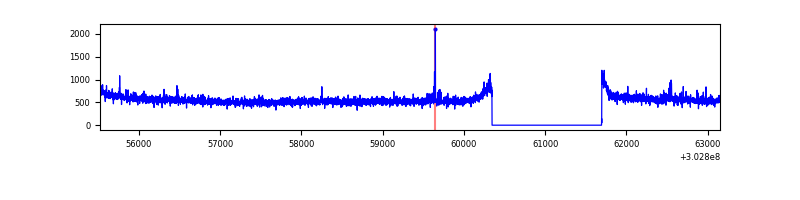 |
| C | 7630 | 6281 | 18 | 18 | 0.24% | 0.29% | 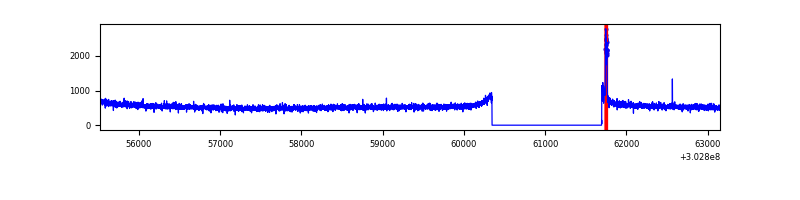 |
| D | 7629 | 6280 | 31 | 31 | 0.41% | 0.49% | 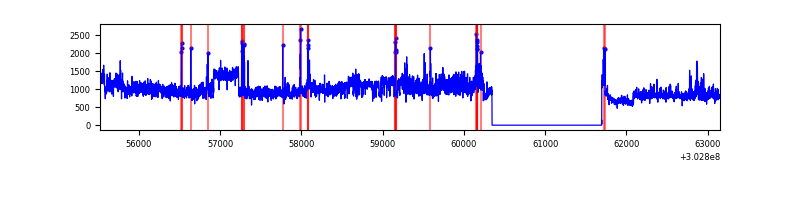 |
Top three noisy pixels from each quadrant. If the there are fewer than three noisy pixels in the level2.evt file, extra rows are filled as -1
| Pixel properties | Quadrant properties | ||||||
|---|---|---|---|---|---|---|---|
| Quadrant | DetID | PixID | Counts | Sigma | Mean | Median | Sigma |
| A | 0 | 226 | 7671 | 38.23 | 893 | 879 | 177.6 |
| A | 3 | 137 | 6735 | 32.96 | 893 | 879 | 177.6 |
| A | 12 | 194 | 6405 | 31.11 | 893 | 879 | 177.6 |
| B | 0 | 230 | 20177 | 116.86 | 879 | 862 | 165.3 |
| B | 12 | 111 | 19303 | 111.57 | 879 | 862 | 165.3 |
| B | 11 | 111 | 17046 | 97.91 | 879 | 862 | 165.3 |
| C | 14 | 238 | 133292 | 695.29 | 826 | 832 | 190.5 |
| C | 0 | 10 | 43979 | 226.48 | 826 | 832 | 190.5 |
| C | 13 | 61 | 5840 | 26.29 | 826 | 832 | 190.5 |
| D | 1 | 239 | 2787688 | 13769.23 | 851 | 830 | 202.4 |
| D | 1 | 52 | 78677 | 384.62 | 851 | 830 | 202.4 |
| D | 9 | 1 | 63579 | 310.03 | 851 | 830 | 202.4 |
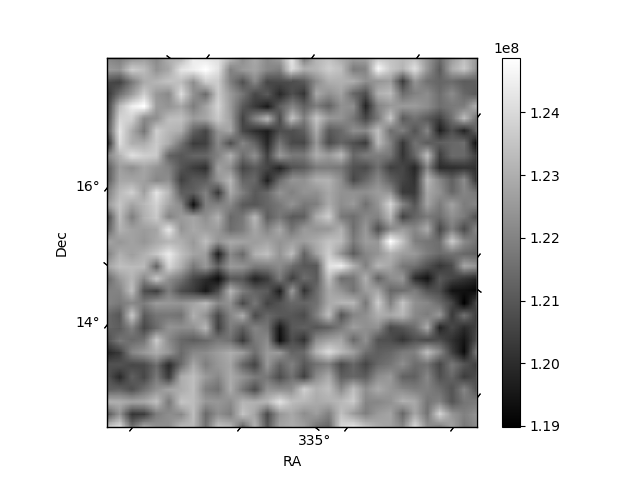
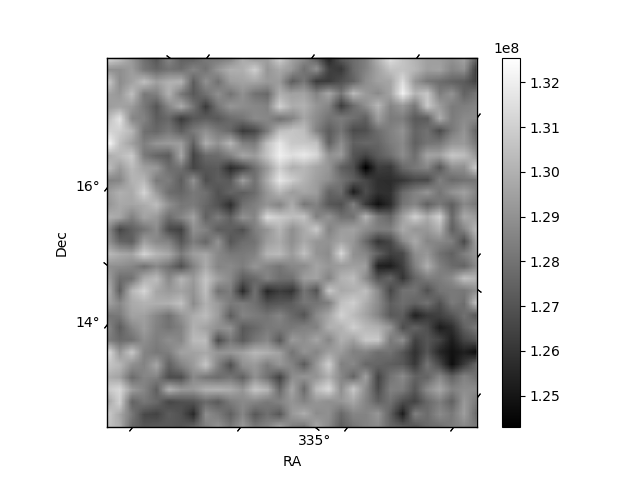
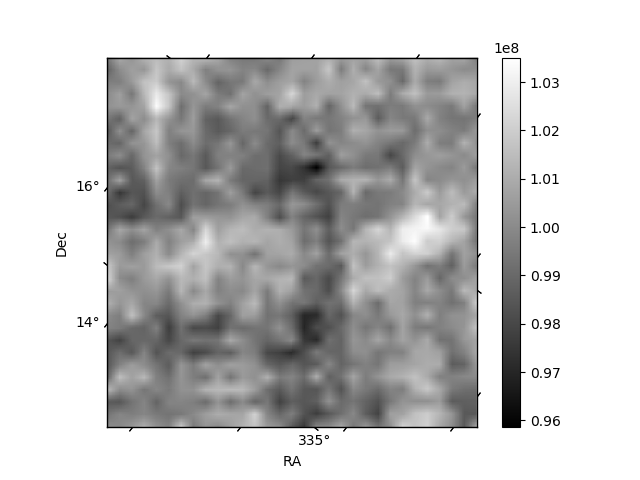
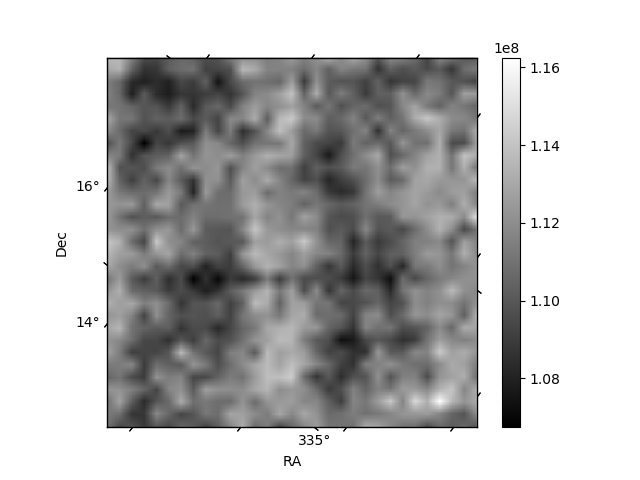
Histogram calculated using DETX and DETY for each event in the final _common_clean file
| Quadrant A | 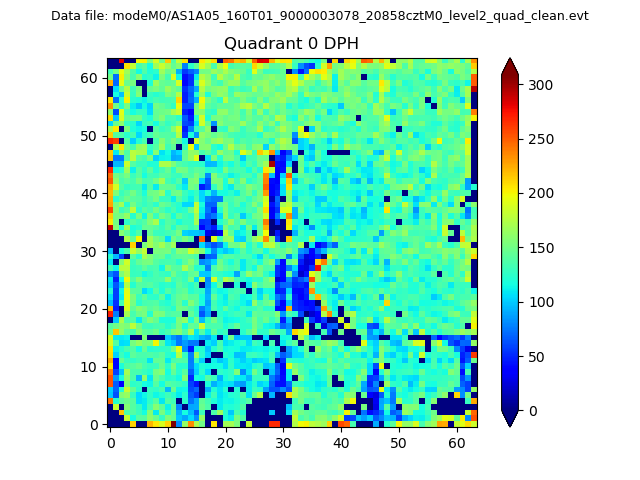 |
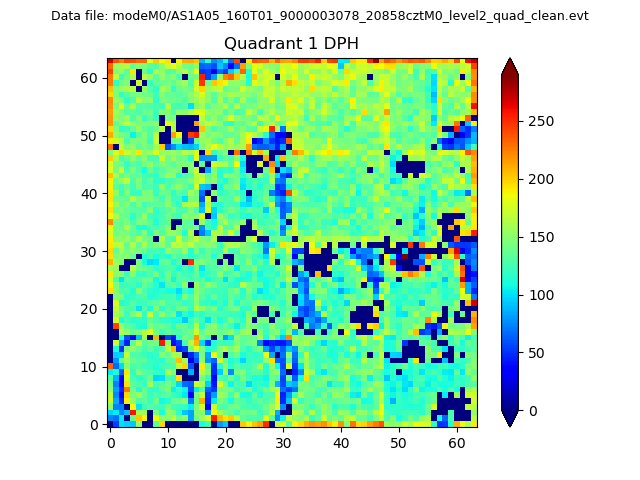 |
Quadrant B |
|---|---|---|---|
| Quadrant D | 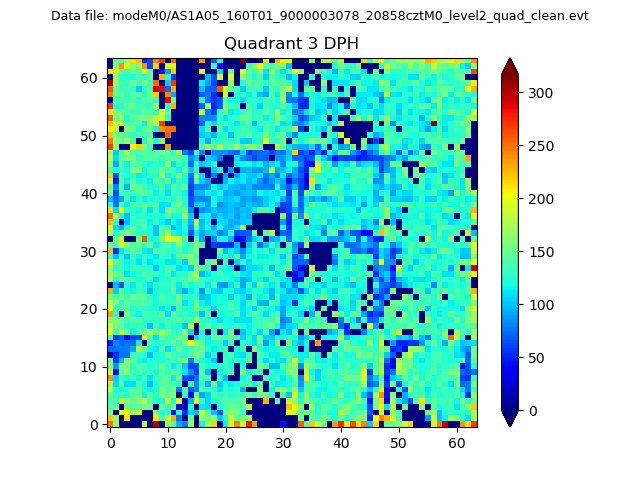 |
 |
Quadrant C |
| Plot type | Count rate plots | Images |
|---|---|---|
| Comparison with Poisson distribution Blue bars denote a histogram of data divided into 1 sec bins. Red curve is a Poisson curve with rate = median count rate of data. |
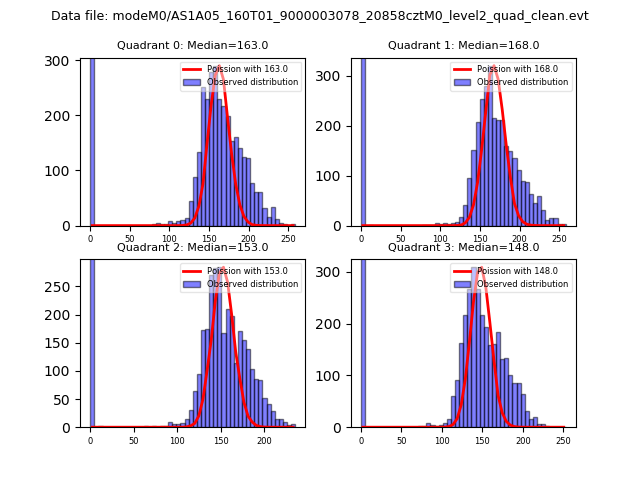 |
 |
| Quadrant-wise count rates Data is divided into 100 sec bins |
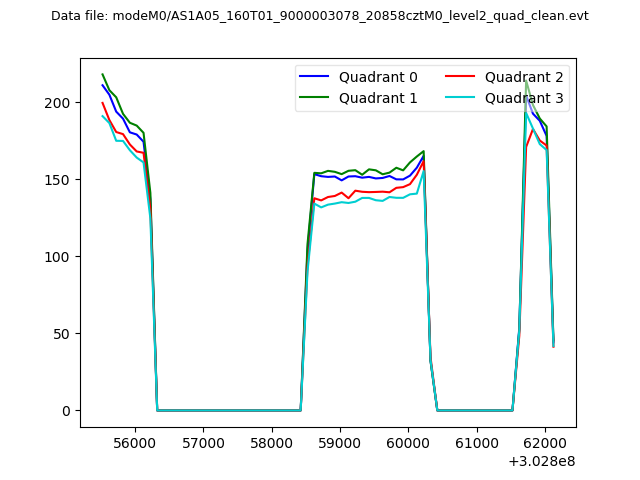 |
|
| Module-wise count rates for Quadrant A Data is divided into 100 sec bins |
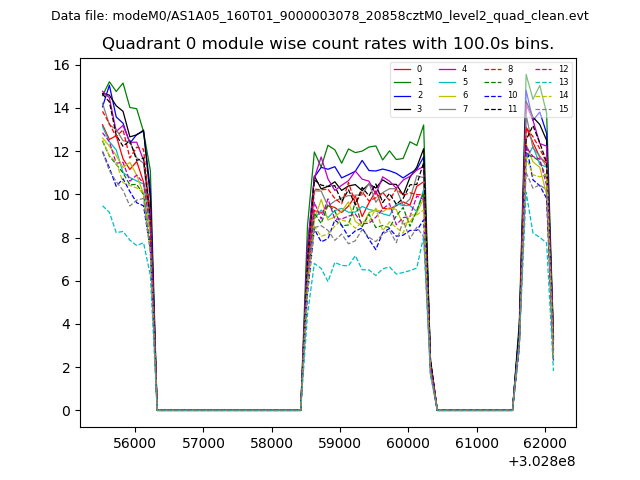 |
 |
| Module-wise count rates for Quadrant B Data is divided into 100 sec bins |
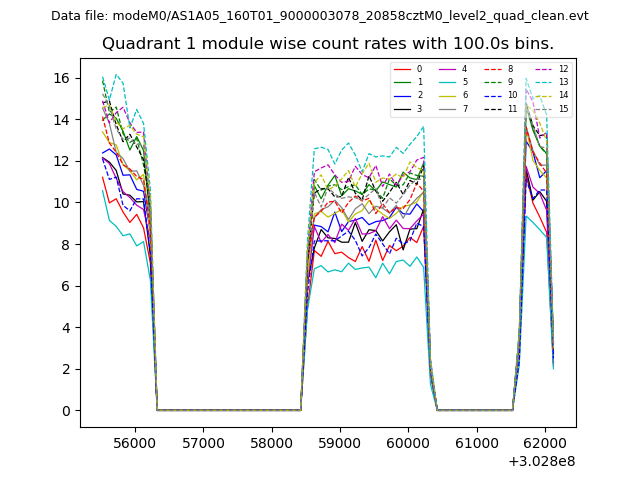 |
 |
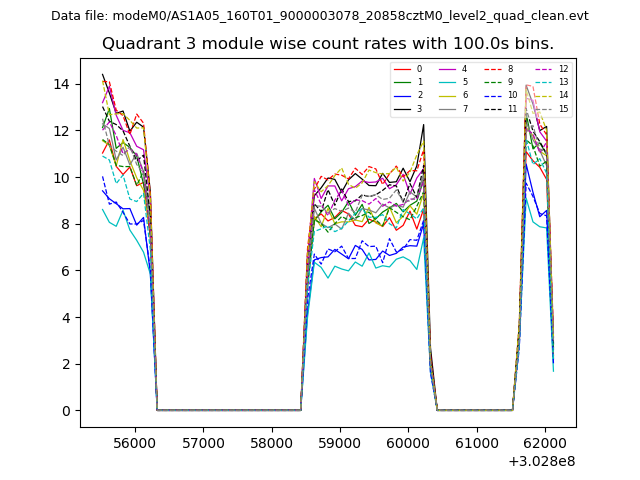
| Module-wise count rates for Quadrant C Data is divided into 100 sec bins |
 |
 |
| Module-wise count rates for Quadrant D Data is divided into 100 sec bins |
 |
 |
| Parameter | Plot |
|---|---|
| CZT HV Monitor | 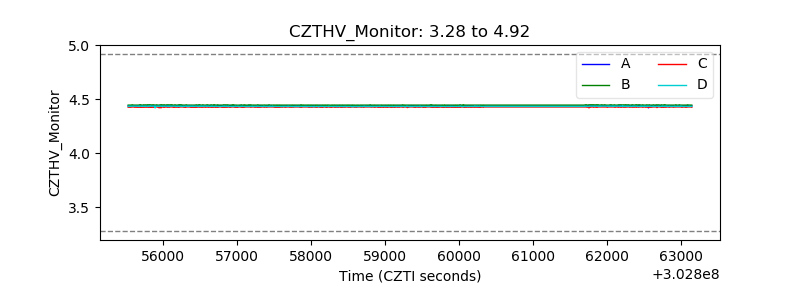 |
| D_VDD | 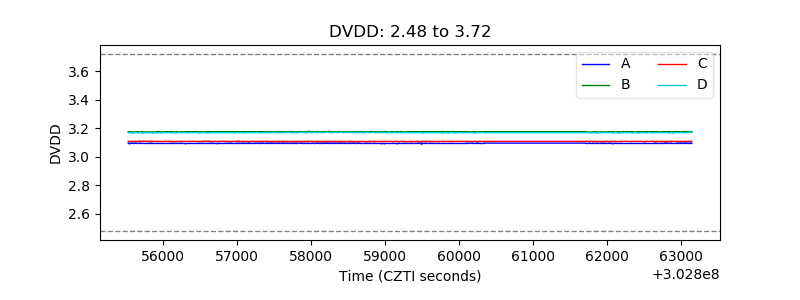 |
| Temperature 1 | 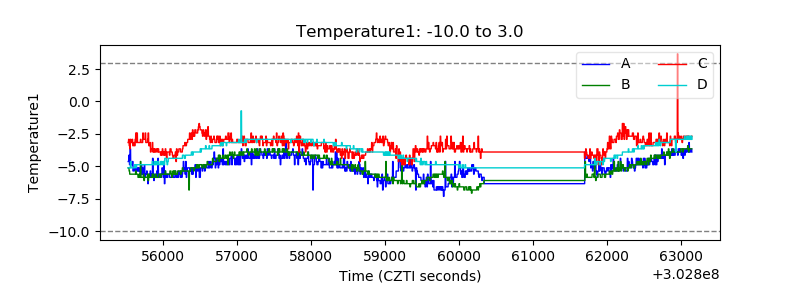 |
| Veto HV Monitor | 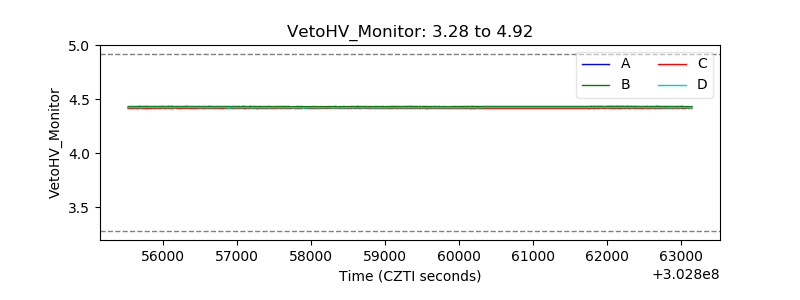 |
| Veto LLD | 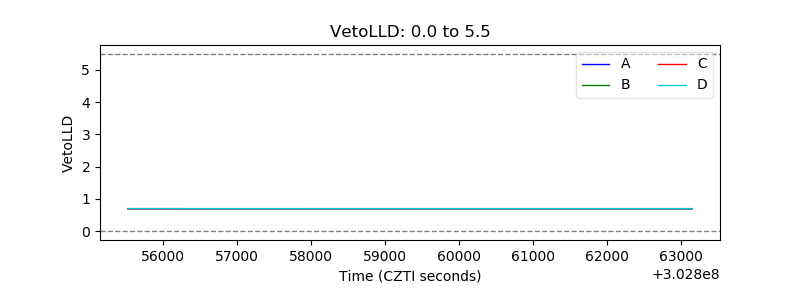 |
| Alpha Counter |  |
| _CPM_Rate | 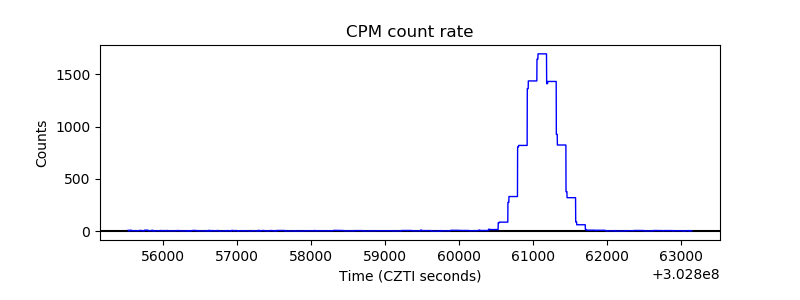 |
| CZT Counter | 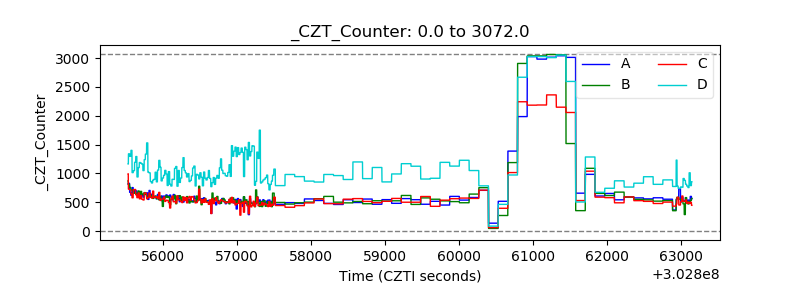 |
| +2.5 Volts monitor |  |
| +5 Volts monitor |  |
| _ROLL_ROT | 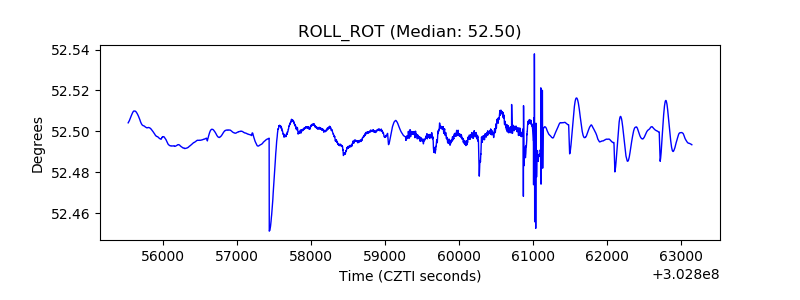 |
| _Roll_DEC | 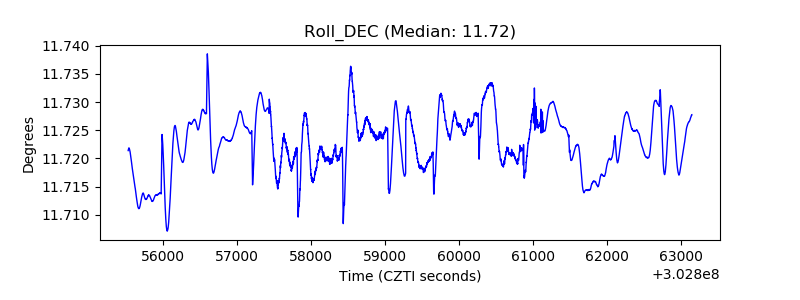 |
| _Roll_RA | 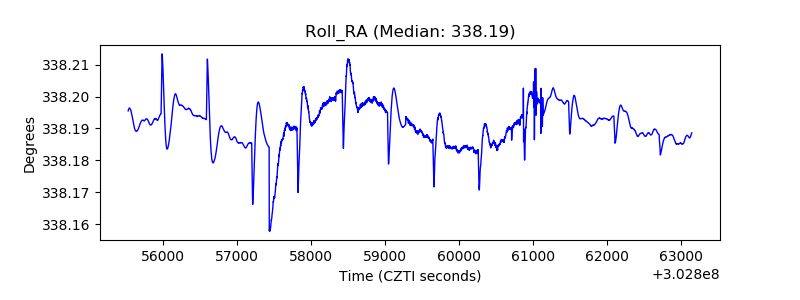 |
| Veto Counter | 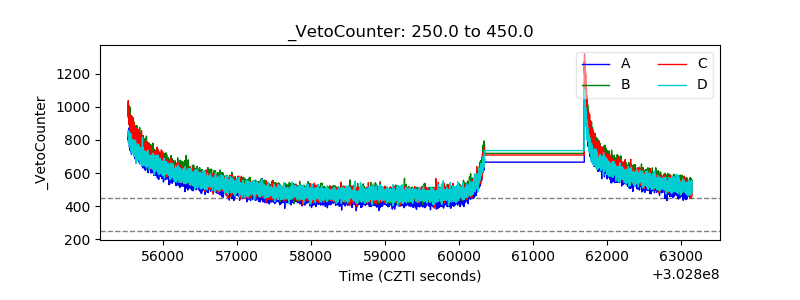 |