| Param | Original file | Final file |
|---|---|---|
| Filename | modeM0/AS1A05_160T01_9000003078_20859cztM0_level2.evt | modeM0/AS1A05_160T01_9000003078_20859cztM0_level2_quad_clean.evt |
| Size (bytes) | 546,304,320 | 67,285,440 |
| Size | 521.0 MB | 64.2 MB |
| Events in quadrant A | 3,342,860 | 412,811 |
| Events in quadrant B | 3,408,856 | 422,846 |
| Events in quadrant C | 3,368,750 | 387,042 |
| Events in quadrant D | 5,999,427 | 376,162 |
| Mode M9 | |||
|---|---|---|---|
| Quadrant | BADHDUFLAG | Total packets | Discarded packets |
| A | 0 | 13 | 0 |
| B | 0 | 13 | 0 |
| C | 0 | 13 | 0 |
| D | 0 | 13 | 0 |
| Mode M0 | |||
|---|---|---|---|
| Quadrant | BADHDUFLAG | Total packets | Discarded packets |
| A | 0 | 13421 | 1 |
| B | 0 | 13614 | 1 |
| C | 0 | 13452 | 1 |
| D | 0 | 22123 | 1 |
| Mode SS | |||
|---|---|---|---|
| Quadrant | BADHDUFLAG | Total packets | Discarded packets |
| A | 0 | 126 | 0 |
| B | 0 | 126 | 0 |
| C | 0 | 126 | 0 |
| D | 0 | 126 | 0 |
| Quadrant | Total seconds | Saturated seconds | Saturation percentage |
|---|---|---|---|
| A | 6285 | 86 | 1.368337% |
| B | 6286 | 105 | 1.670379% |
| C | 6286 | 117 | 1.861279% |
| D | 6286 | 130 | 2.068088% |
Noise dominated data is calculated using 1-second bins in cleaned event files. If a bin has >2000 counts, and if more than 50% of those come from <1% of pixels, then it is considered to be noise-dominated and hence unusable.
| Quadrant | # 1 sec bins | Bins with >0 counts | Bins with >2000 counts | High rate bins dominated by noise | Noise dominated (total time) | Noise dominated (detector-on time) | Marked lightcurve |
|---|---|---|---|---|---|---|---|
| A | 7580 | 6286 | 0 | 0 | 0.00% | 0.00% | 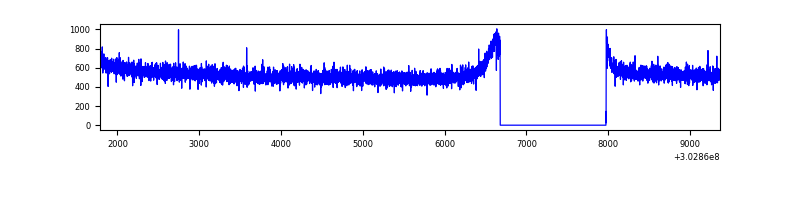 |
| B | 7581 | 6287 | 0 | 0 | 0.00% | 0.00% | 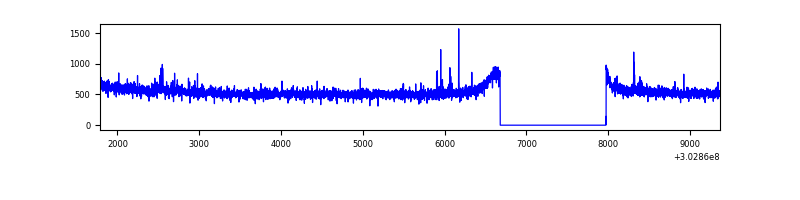 |
| C | 7581 | 6287 | 29 | 29 | 0.38% | 0.46% | 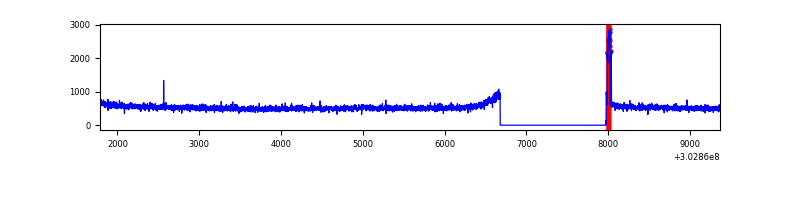 |
| D | 7581 | 6287 | 26 | 26 | 0.34% | 0.41% | 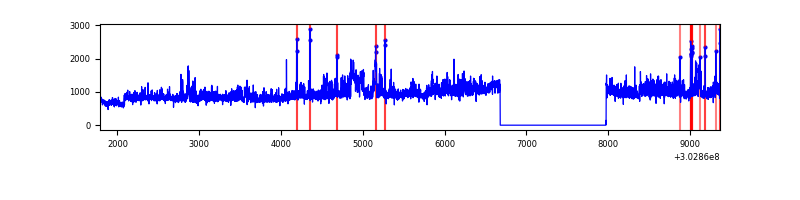 |
Top three noisy pixels from each quadrant. If the there are fewer than three noisy pixels in the level2.evt file, extra rows are filled as -1
| Pixel properties | Quadrant properties | ||||||
|---|---|---|---|---|---|---|---|
| Quadrant | DetID | PixID | Counts | Sigma | Mean | Median | Sigma |
| A | 0 | 226 | 7418 | 38.0 | 870 | 857 | 172.7 |
| A | 3 | 137 | 6921 | 35.12 | 870 | 857 | 172.7 |
| A | 12 | 194 | 6191 | 30.89 | 870 | 857 | 172.7 |
| B | 12 | 111 | 19282 | 114.46 | 858 | 838 | 161.1 |
| B | 11 | 111 | 16981 | 100.18 | 858 | 838 | 161.1 |
| B | 0 | 189 | 16301 | 95.96 | 858 | 838 | 161.1 |
| C | 14 | 238 | 127135 | 681.65 | 806 | 814 | 185.3 |
| C | 0 | 10 | 80204 | 428.41 | 806 | 814 | 185.3 |
| C | 7 | 247 | 11292 | 56.54 | 806 | 814 | 185.3 |
| D | 1 | 239 | 2430875 | 12081.65 | 831 | 809 | 201.1 |
| D | 1 | 52 | 195765 | 969.27 | 831 | 809 | 201.1 |
| D | 9 | 1 | 122852 | 606.77 | 831 | 809 | 201.1 |
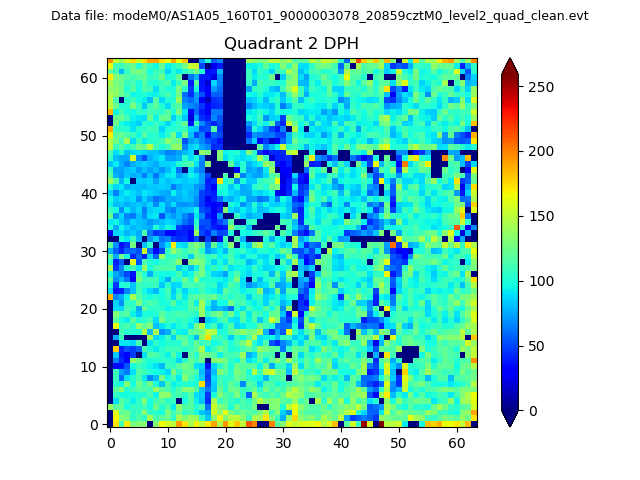
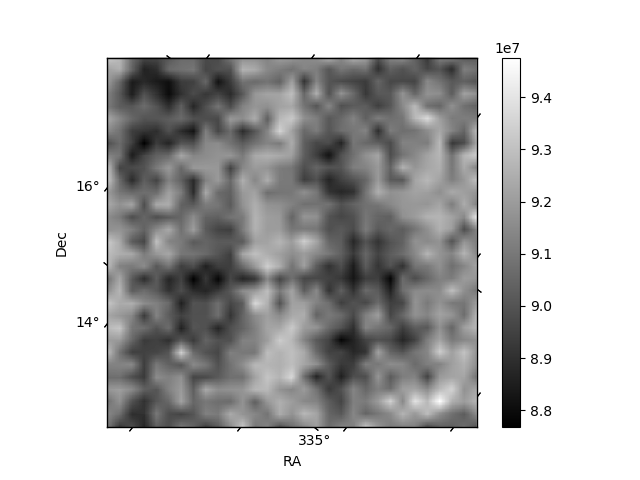
Histogram calculated using DETX and DETY for each event in the final _common_clean file
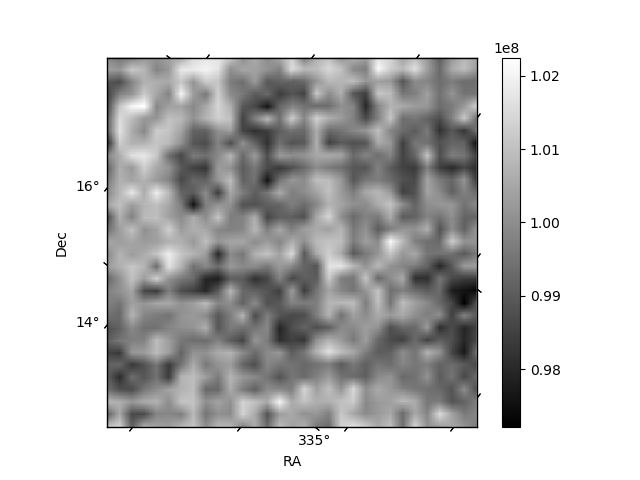
| Quadrant A |  |
 |
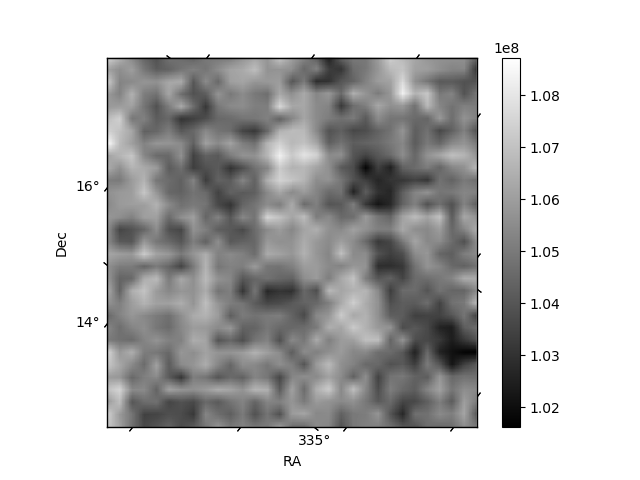
Quadrant B |
|---|---|---|---|
| Quadrant D | 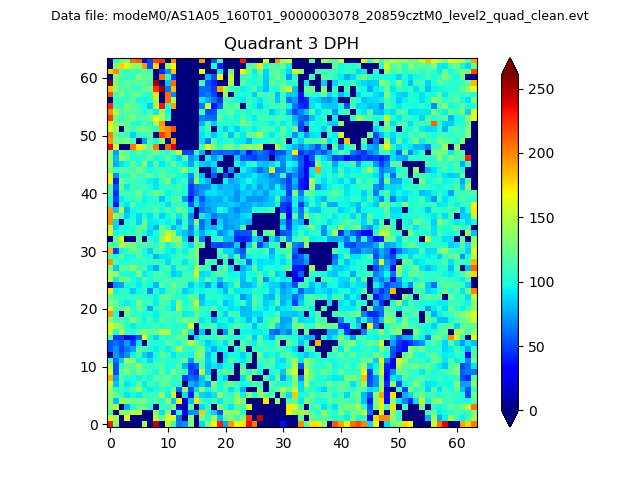 |
 |
Quadrant C |
| Plot type | Count rate plots | Images |
|---|---|---|
| Comparison with Poisson distribution Blue bars denote a histogram of data divided into 1 sec bins. Red curve is a Poisson curve with rate = median count rate of data. |
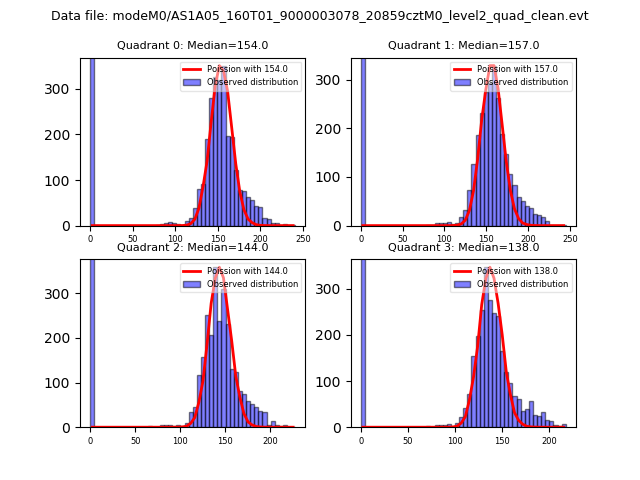 |
 |
| Quadrant-wise count rates Data is divided into 100 sec bins |
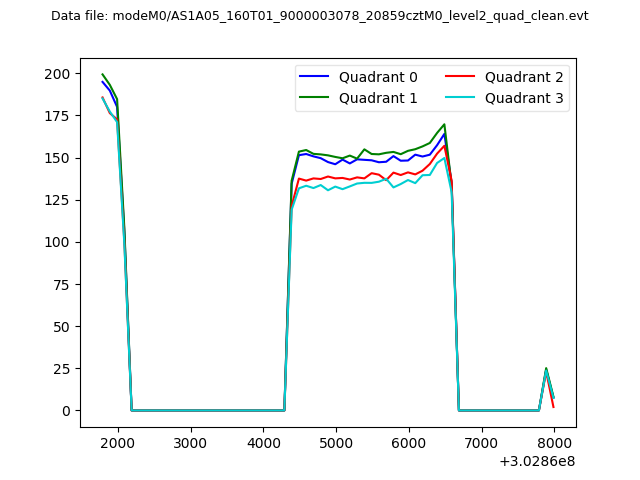 |
|
| Module-wise count rates for Quadrant A Data is divided into 100 sec bins |
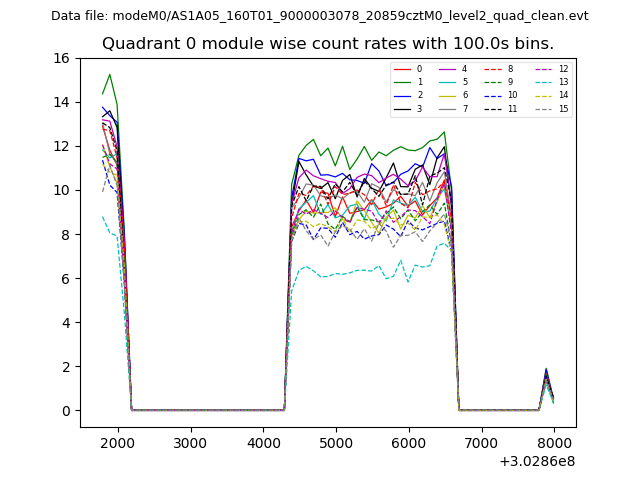 |
 |
| Module-wise count rates for Quadrant B Data is divided into 100 sec bins |
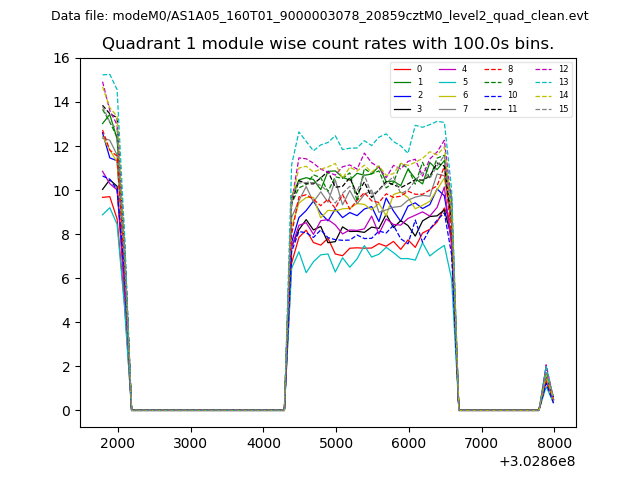 |
 |
| Module-wise count rates for Quadrant C Data is divided into 100 sec bins |
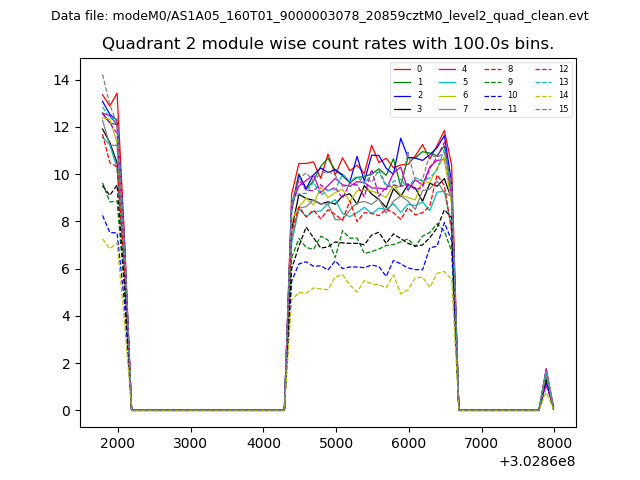 |
 |
| Module-wise count rates for Quadrant D Data is divided into 100 sec bins |
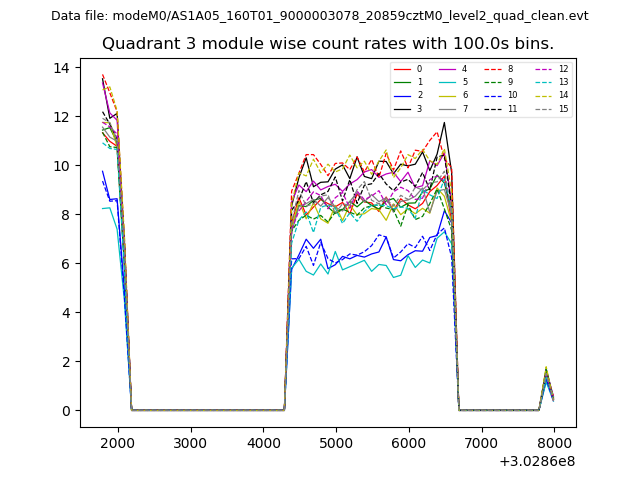 |
 |
| Parameter | Plot |
|---|---|
| CZT HV Monitor | 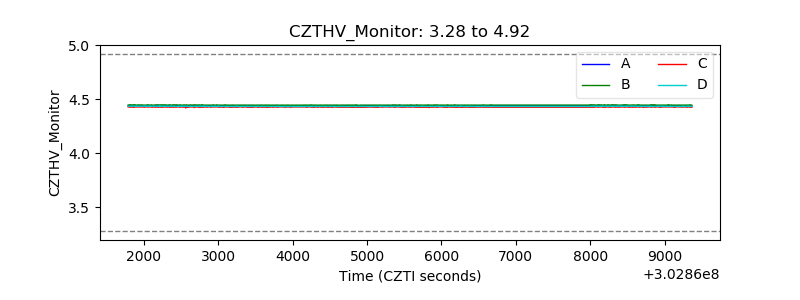 |
| D_VDD | 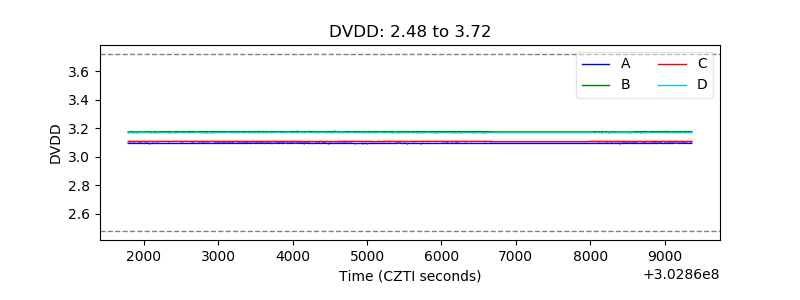 |
| Temperature 1 | 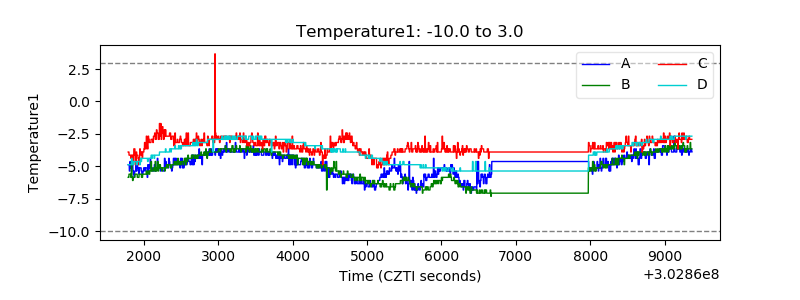 |
| Veto HV Monitor | 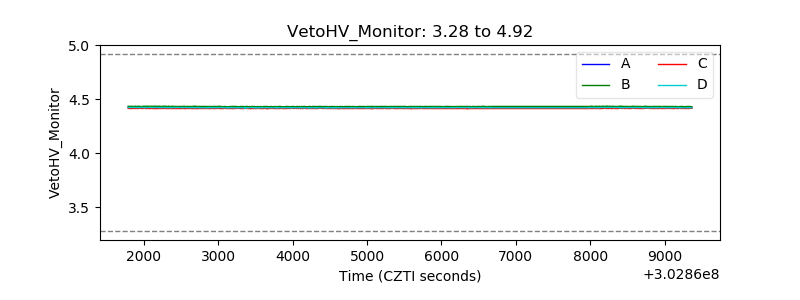 |
| Veto LLD |  |
| Alpha Counter | 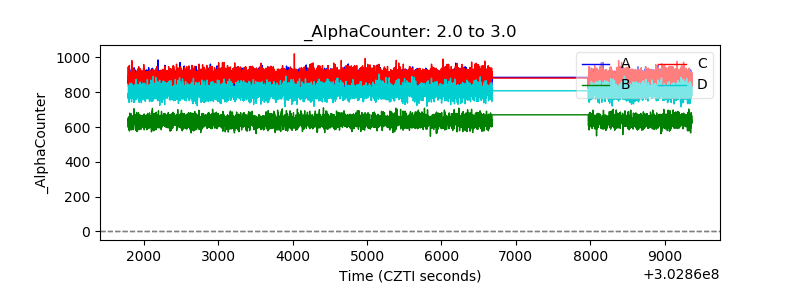 |
| _CPM_Rate | 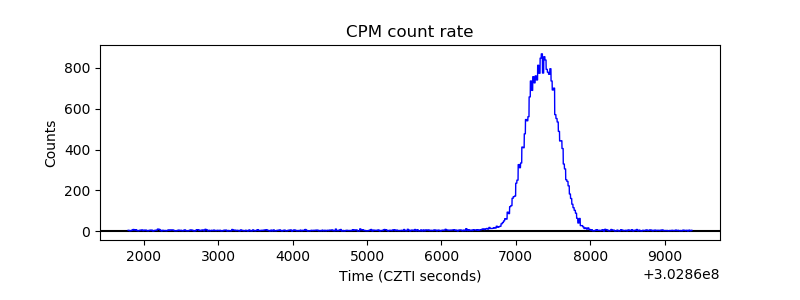 |
| CZT Counter | 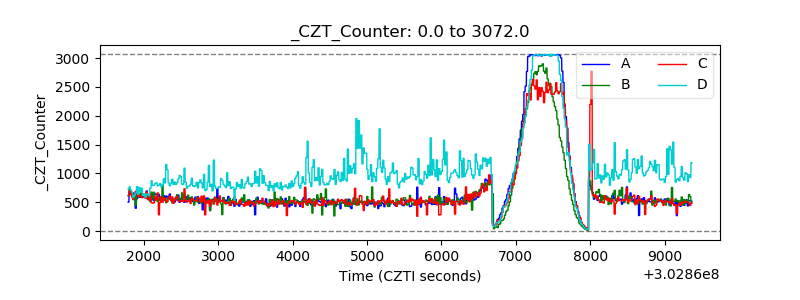 |
| +2.5 Volts monitor |  |
| +5 Volts monitor | 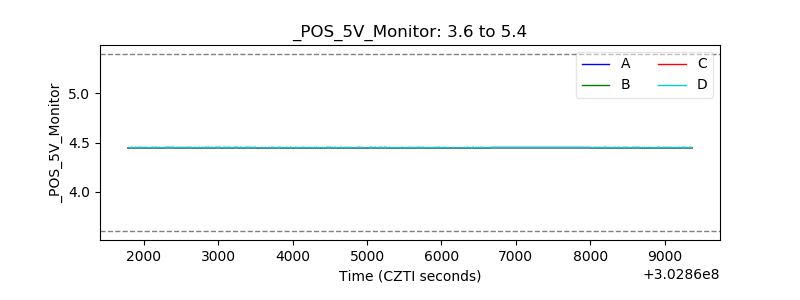 |
| _ROLL_ROT | 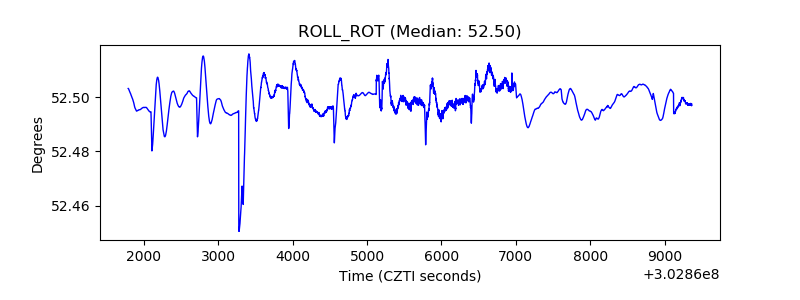 |
| _Roll_DEC | 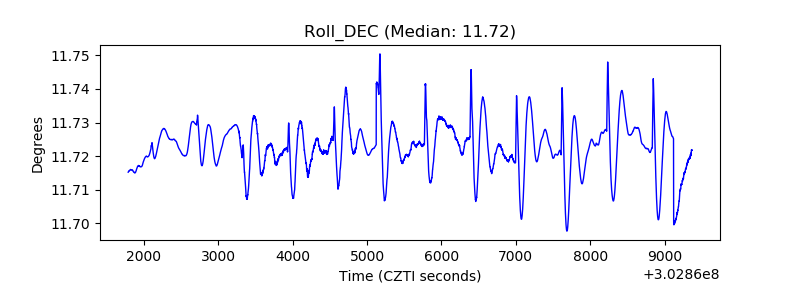 |
| _Roll_RA |  |
| Veto Counter | 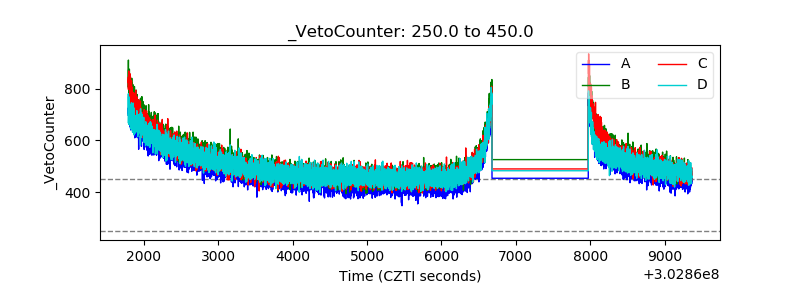 |