| Param | Original file | Final file |
|---|---|---|
| Filename | modeM0/AS1A05_160T01_9000003078_20860cztM0_level2.evt | modeM0/AS1A05_160T01_9000003078_20860cztM0_level2_quad_clean.evt |
| Size (bytes) | 546,589,440 | 70,292,160 |
| Size | 521.3 MB | 67.0 MB |
| Events in quadrant A | 3,363,435 | 430,626 |
| Events in quadrant B | 3,446,956 | 439,502 |
| Events in quadrant C | 3,429,044 | 403,179 |
| Events in quadrant D | 5,871,376 | 399,523 |
| Mode M9 | |||
|---|---|---|---|
| Quadrant | BADHDUFLAG | Total packets | Discarded packets |
| A | 0 | 15 | 0 |
| B | 0 | 16 | 0 |
| C | 0 | 16 | 0 |
| D | 0 | 16 | 0 |
| Mode M0 | |||
|---|---|---|---|
| Quadrant | BADHDUFLAG | Total packets | Discarded packets |
| A | 0 | 13735 | 2 |
| B | 0 | 13887 | 2 |
| C | 0 | 13854 | 2 |
| D | 0 | 21628 | 2 |
| Mode SS | |||
|---|---|---|---|
| Quadrant | BADHDUFLAG | Total packets | Discarded packets |
| A | 0 | 132 | 0 |
| B | 0 | 132 | 0 |
| C | 0 | 132 | 0 |
| D | 0 | 132 | 0 |
| Quadrant | Total seconds | Saturated seconds | Saturation percentage |
|---|---|---|---|
| A | 6534 | 125 | 1.913070% |
| B | 6534 | 137 | 2.096725% |
| C | 6534 | 174 | 2.662994% |
| D | 6534 | 219 | 3.351699% |
Noise dominated data is calculated using 1-second bins in cleaned event files. If a bin has >2000 counts, and if more than 50% of those come from <1% of pixels, then it is considered to be noise-dominated and hence unusable.
| Quadrant | # 1 sec bins | Bins with >0 counts | Bins with >2000 counts | High rate bins dominated by noise | Noise dominated (total time) | Noise dominated (detector-on time) | Marked lightcurve |
|---|---|---|---|---|---|---|---|
| A | 7504 | 6535 | 0 | 0 | 0.00% | 0.00% | 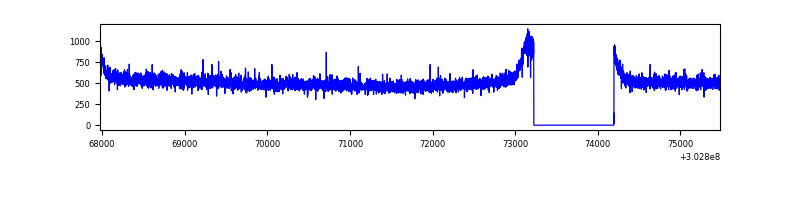 |
| B | 7504 | 6535 | 0 | 0 | 0.00% | 0.00% | 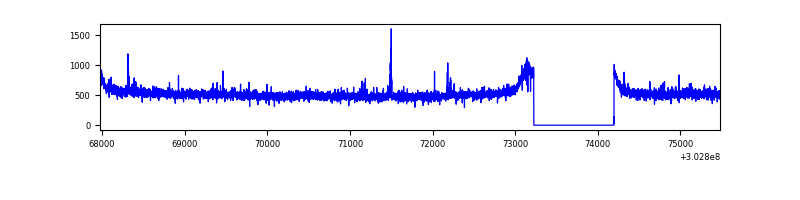 |
| C | 7504 | 6535 | 29 | 29 | 0.39% | 0.44% | 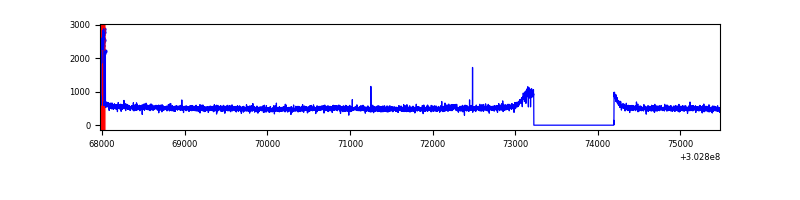 |
| D | 7504 | 6535 | 53 | 53 | 0.71% | 0.81% | 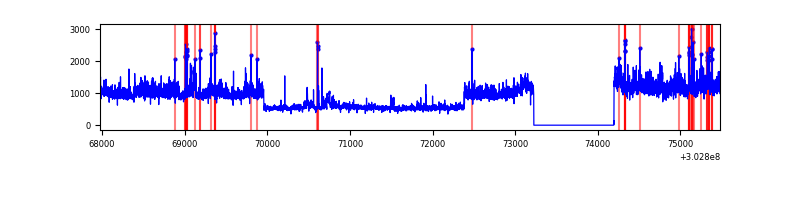 |
Top three noisy pixels from each quadrant. If the there are fewer than three noisy pixels in the level2.evt file, extra rows are filled as -1
| Pixel properties | Quadrant properties | ||||||
|---|---|---|---|---|---|---|---|
| Quadrant | DetID | PixID | Counts | Sigma | Mean | Median | Sigma |
| A | 0 | 226 | 7555 | 38.27 | 875 | 858 | 175.0 |
| A | 3 | 137 | 7115 | 35.75 | 875 | 858 | 175.0 |
| A | 12 | 194 | 6151 | 30.25 | 875 | 858 | 175.0 |
| B | 0 | 230 | 24045 | 140.6 | 866 | 845 | 165.0 |
| B | 12 | 111 | 20199 | 117.29 | 866 | 845 | 165.0 |
| B | 11 | 111 | 17711 | 102.21 | 866 | 845 | 165.0 |
| C | 14 | 238 | 128825 | 674.64 | 815 | 823 | 189.7 |
| C | 0 | 10 | 81370 | 424.53 | 815 | 823 | 189.7 |
| C | 7 | 247 | 32164 | 165.19 | 815 | 823 | 189.7 |
| D | 1 | 239 | 2343089 | 11613.25 | 837 | 817 | 201.7 |
| D | 1 | 52 | 115055 | 566.4 | 837 | 817 | 201.7 |
| D | 5 | 222 | 96814 | 475.96 | 837 | 817 | 201.7 |
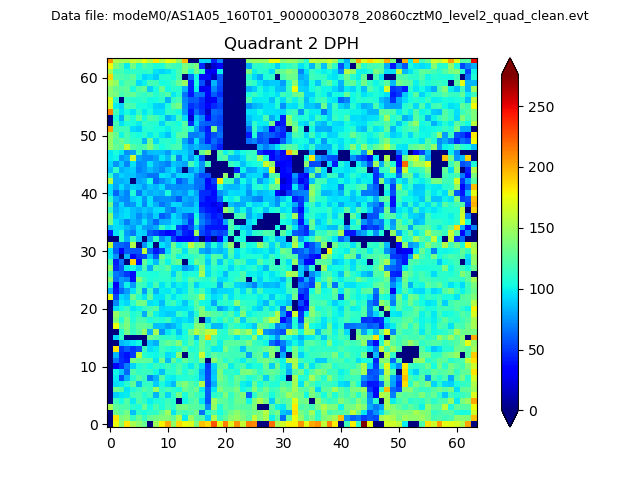
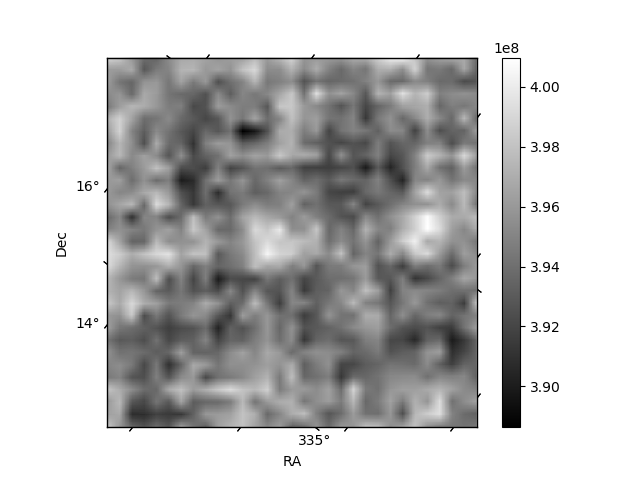
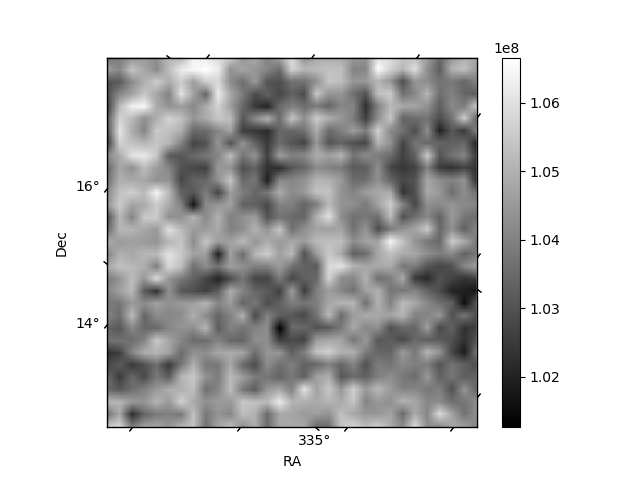
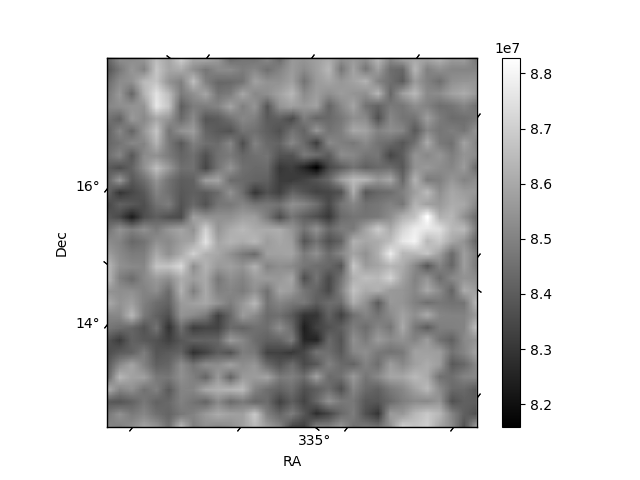
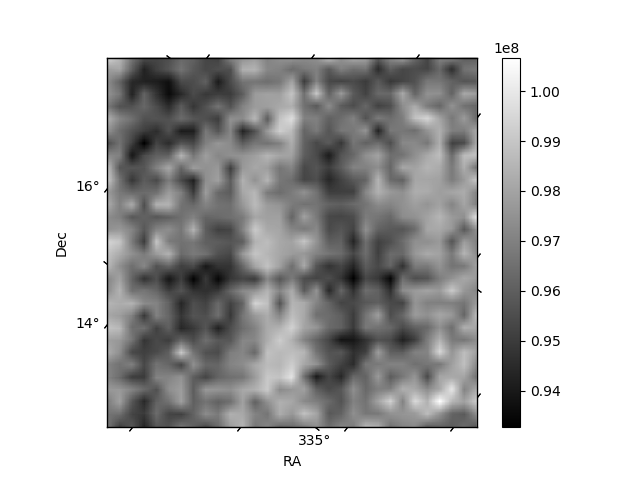
Histogram calculated using DETX and DETY for each event in the final _common_clean file
| Quadrant A | 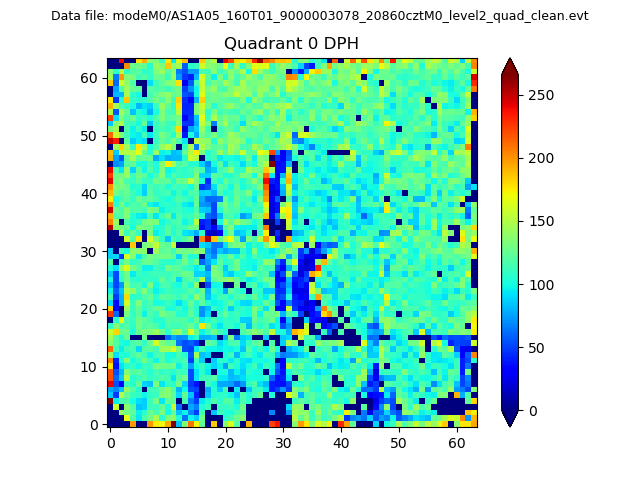 |
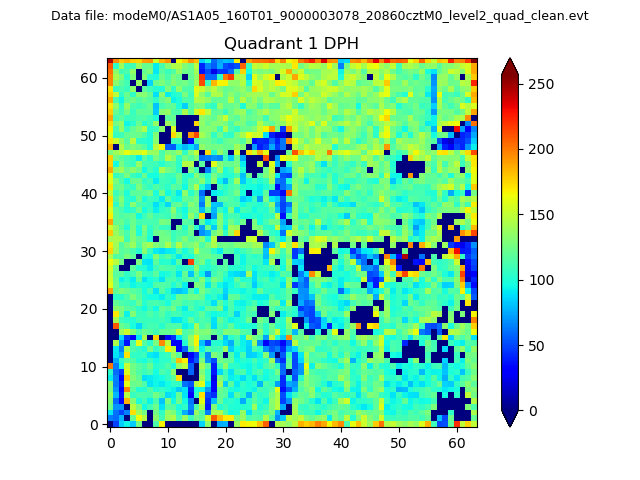 |
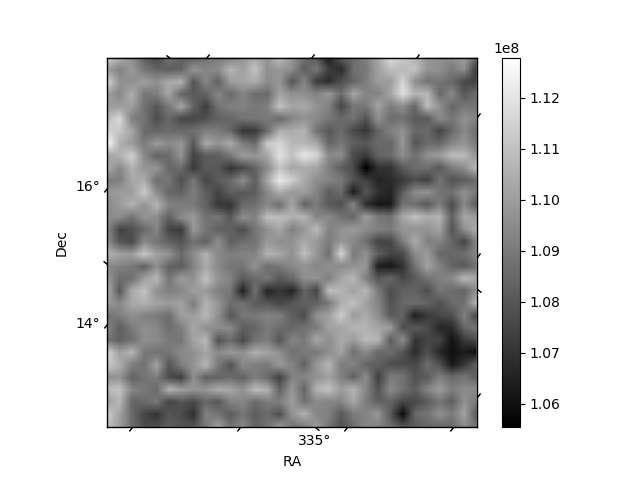
Quadrant B |
|---|---|---|---|
| Quadrant D | 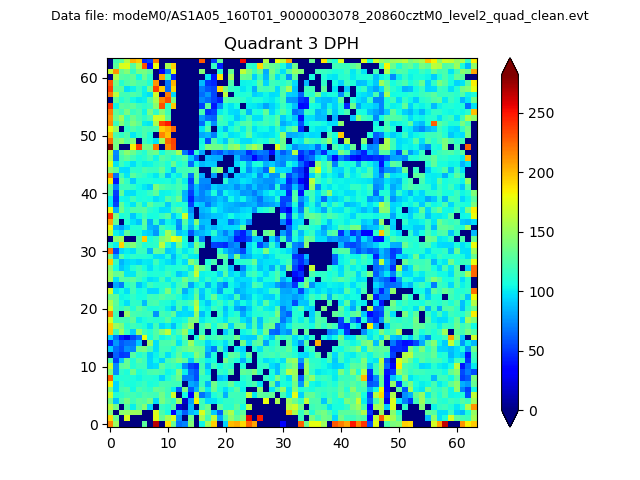 |
 |
Quadrant C |
| Plot type | Count rate plots | Images |
|---|---|---|
| Comparison with Poisson distribution Blue bars denote a histogram of data divided into 1 sec bins. Red curve is a Poisson curve with rate = median count rate of data. |
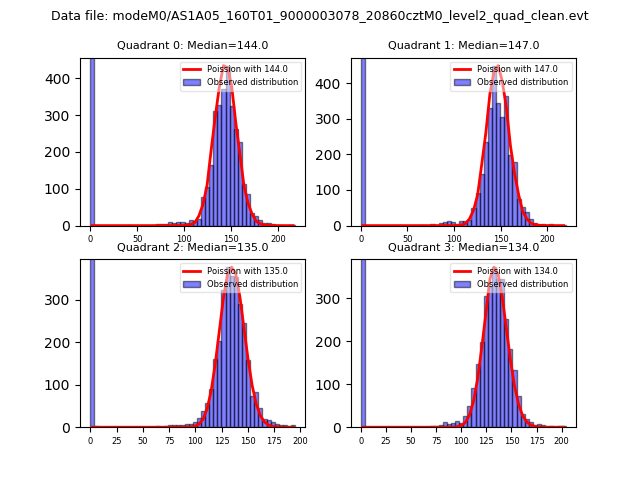 |
 |
| Quadrant-wise count rates Data is divided into 100 sec bins |
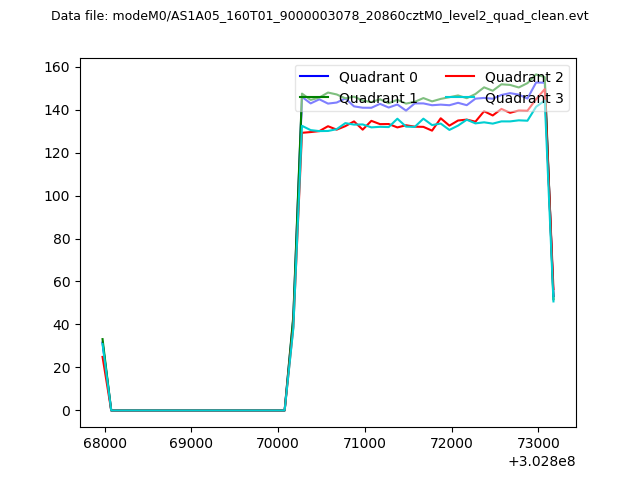 |
|
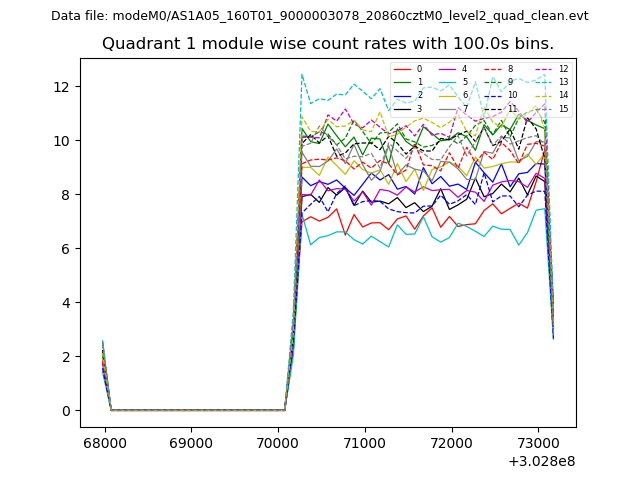
| Module-wise count rates for Quadrant A Data is divided into 100 sec bins |
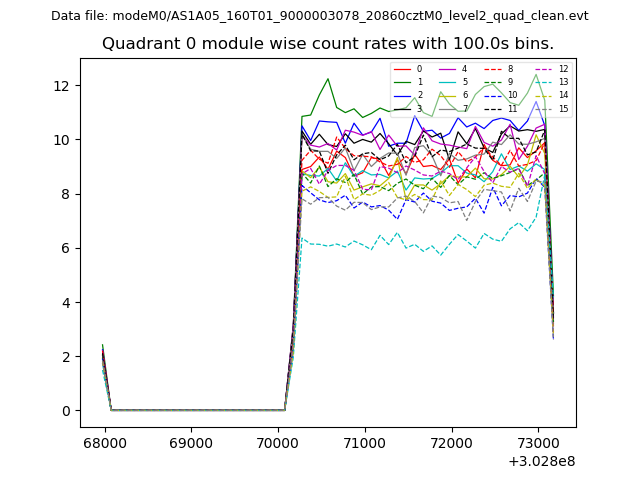 |
 |
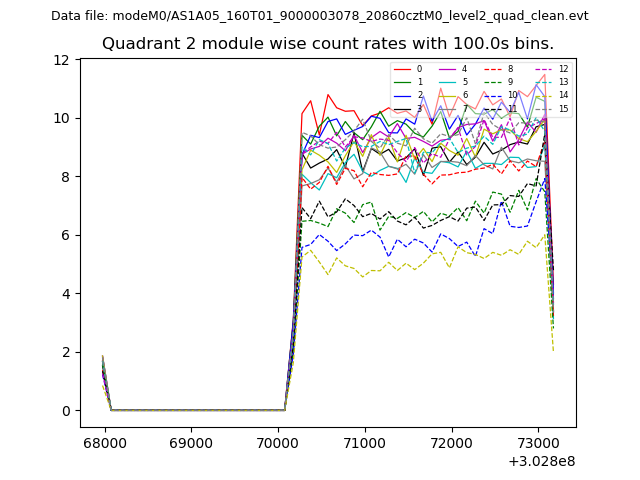
| Module-wise count rates for Quadrant B Data is divided into 100 sec bins |
 |
 |
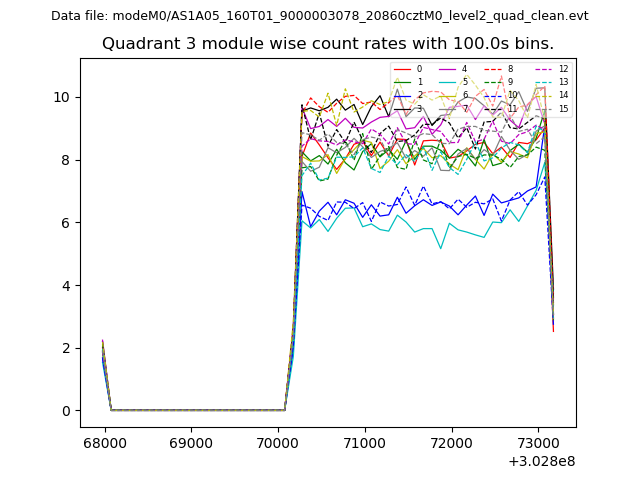
| Module-wise count rates for Quadrant C Data is divided into 100 sec bins |
 |
 |
| Module-wise count rates for Quadrant D Data is divided into 100 sec bins |
 |
 |
| Parameter | Plot |
|---|---|
| CZT HV Monitor | 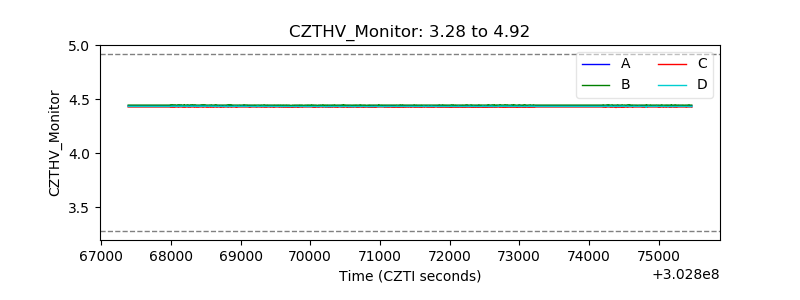 |
| D_VDD | 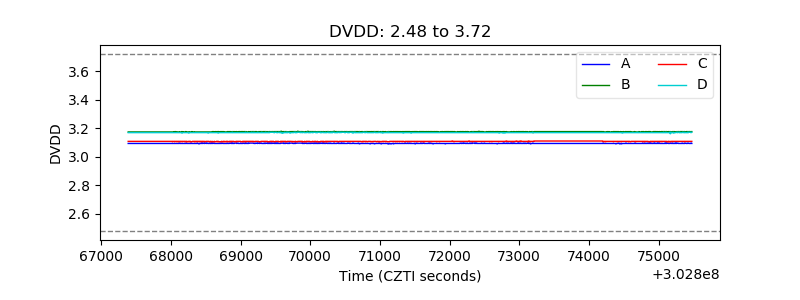 |
| Temperature 1 | 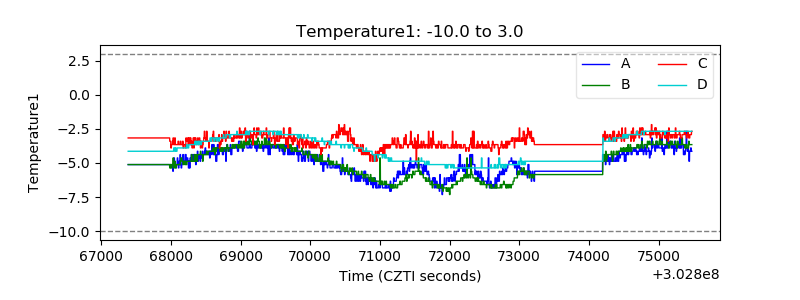 |
| Veto HV Monitor | 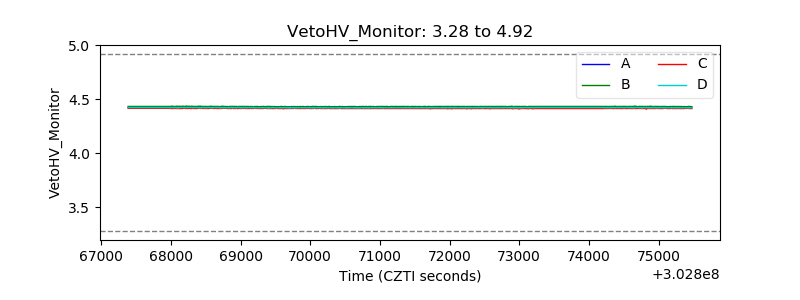 |
| Veto LLD | 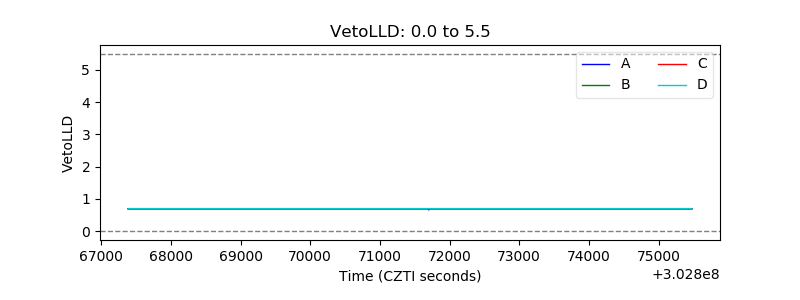 |
| Alpha Counter | 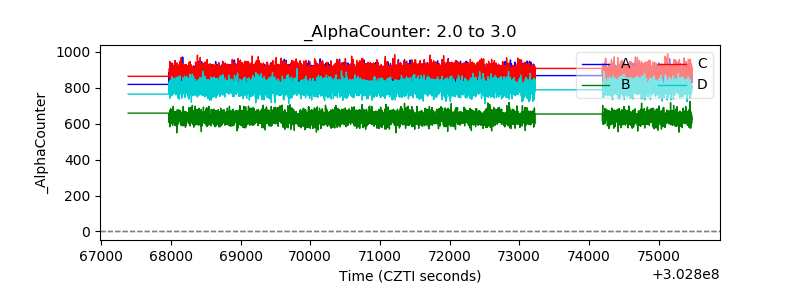 |
| _CPM_Rate | 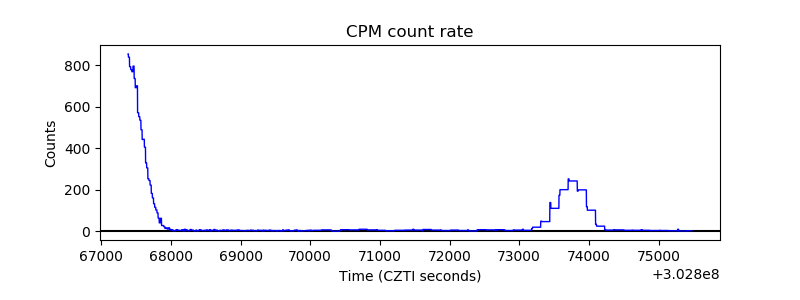 |
| CZT Counter |  |
| +2.5 Volts monitor |  |
| +5 Volts monitor |  |
| _ROLL_ROT | 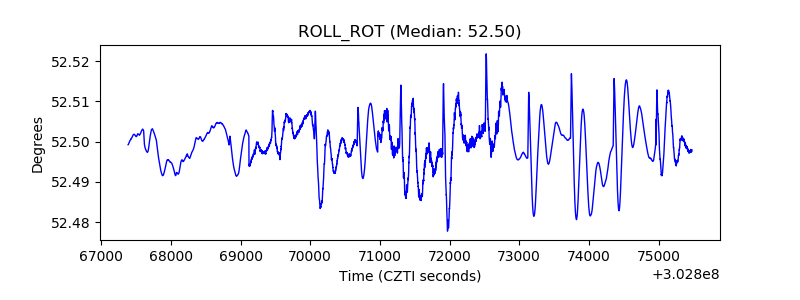 |
| _Roll_DEC | 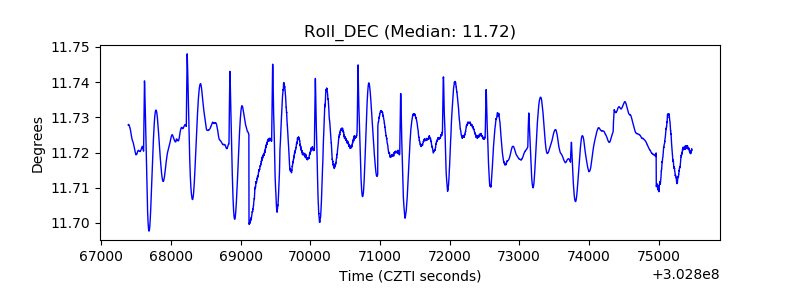 |
| _Roll_RA | 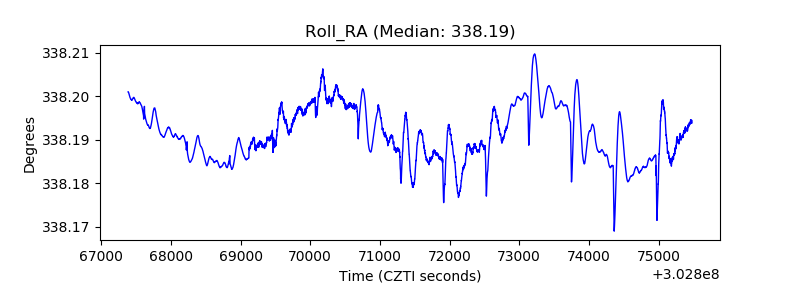 |
| Veto Counter | 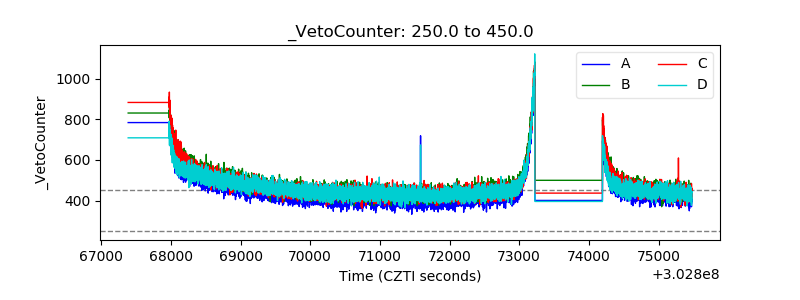 |