| Param | Original file | Final file |
|---|---|---|
| Filename | modeM0/AS1A05_160T01_9000003078_20861cztM0_level2.evt | modeM0/AS1A05_160T01_9000003078_20861cztM0_level2_quad_clean.evt |
| Size (bytes) | 657,031,680 | 79,819,200 |
| Size | 626.6 MB | 76.1 MB |
| Events in quadrant A | 3,550,673 | 493,893 |
| Events in quadrant B | 3,655,493 | 504,816 |
| Events in quadrant C | 3,550,927 | 468,925 |
| Events in quadrant D | 8,656,591 | 450,254 |
| Mode M9 | |||
|---|---|---|---|
| Quadrant | BADHDUFLAG | Total packets | Discarded packets |
| A | 0 | 16 | 0 |
| B | 0 | 16 | 0 |
| C | 0 | 16 | 0 |
| D | 0 | 16 | 0 |
| Mode M0 | |||
|---|---|---|---|
| Quadrant | BADHDUFLAG | Total packets | Discarded packets |
| A | 0 | 14905 | 2 |
| B | 0 | 15025 | 2 |
| C | 0 | 14877 | 2 |
| D | 0 | 30674 | 2 |
| Mode SS | |||
|---|---|---|---|
| Quadrant | BADHDUFLAG | Total packets | Discarded packets |
| A | 0 | 148 | 0 |
| B | 0 | 148 | 0 |
| C | 0 | 148 | 0 |
| D | 0 | 148 | 0 |
| Quadrant | Total seconds | Saturated seconds | Saturation percentage |
|---|---|---|---|
| A | 7163 | 161 | 2.247662% |
| B | 7163 | 179 | 2.498953% |
| C | 7163 | 211 | 2.945693% |
| D | 7164 | 788 | 10.999442% |
Noise dominated data is calculated using 1-second bins in cleaned event files. If a bin has >2000 counts, and if more than 50% of those come from <1% of pixels, then it is considered to be noise-dominated and hence unusable.
| Quadrant | # 1 sec bins | Bins with >0 counts | Bins with >2000 counts | High rate bins dominated by noise | Noise dominated (total time) | Noise dominated (detector-on time) | Marked lightcurve |
|---|---|---|---|---|---|---|---|
| A | 8753 | 7165 | 0 | 0 | 0.00% | 0.00% | 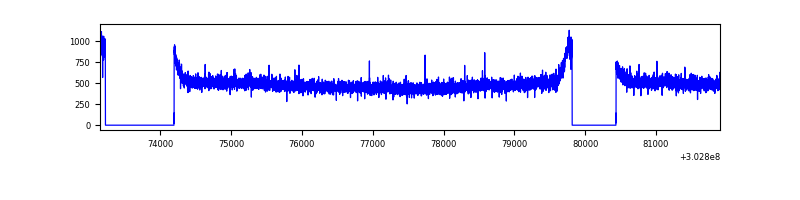 |
| B | 8753 | 7165 | 0 | 0 | 0.00% | 0.00% | 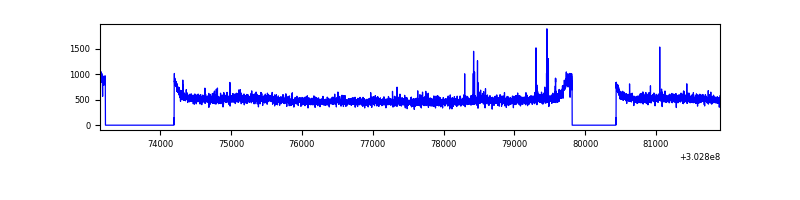 |
| C | 8753 | 7165 | 0 | 0 | 0.00% | 0.00% | 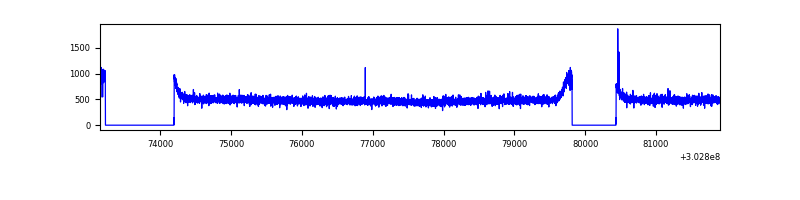 |
| D | 8754 | 7166 | 557 | 557 | 6.36% | 7.77% | 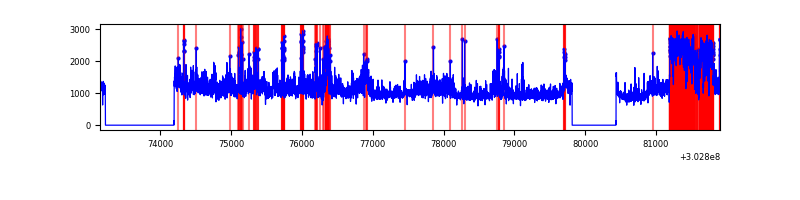 |
Top three noisy pixels from each quadrant. If the there are fewer than three noisy pixels in the level2.evt file, extra rows are filled as -1
| Pixel properties | Quadrant properties | ||||||
|---|---|---|---|---|---|---|---|
| Quadrant | DetID | PixID | Counts | Sigma | Mean | Median | Sigma |
| A | 0 | 226 | 7856 | 37.21 | 923 | 904 | 186.8 |
| A | 3 | 137 | 7826 | 37.05 | 923 | 904 | 186.8 |
| A | 12 | 194 | 6525 | 30.09 | 923 | 904 | 186.8 |
| B | 0 | 229 | 25966 | 141.32 | 916 | 895 | 177.4 |
| B | 12 | 111 | 21781 | 117.73 | 916 | 895 | 177.4 |
| B | 0 | 189 | 20110 | 108.31 | 916 | 895 | 177.4 |
| C | 14 | 238 | 135673 | 657.16 | 873 | 879 | 205.1 |
| C | 0 | 10 | 6641 | 28.09 | 873 | 879 | 205.1 |
| C | 13 | 61 | 6178 | 25.83 | 873 | 879 | 205.1 |
| D | 1 | 239 | 3922476 | 18938.62 | 857 | 833 | 207.1 |
| D | 1 | 52 | 1117076 | 5390.62 | 857 | 833 | 207.1 |
| D | 5 | 222 | 290077 | 1396.83 | 857 | 833 | 207.1 |
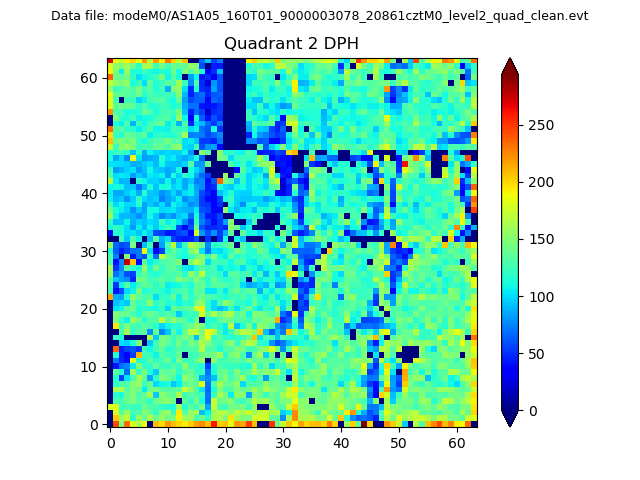
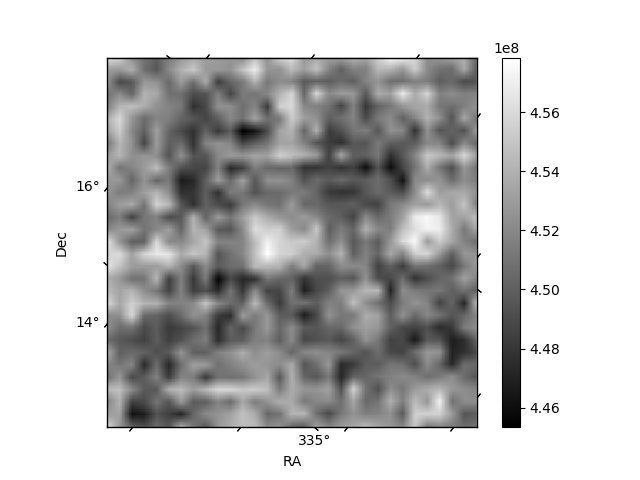
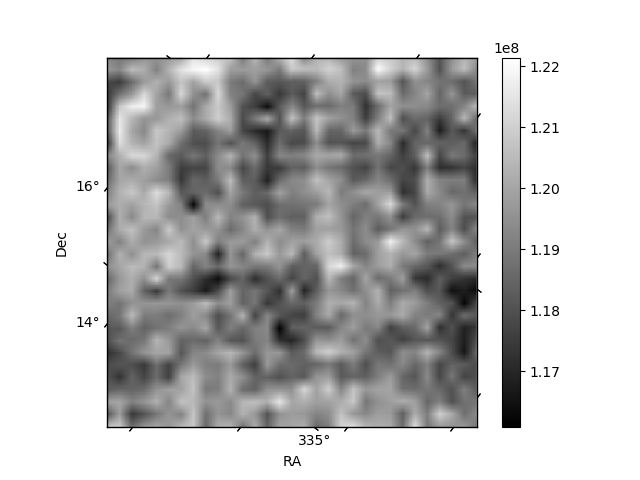
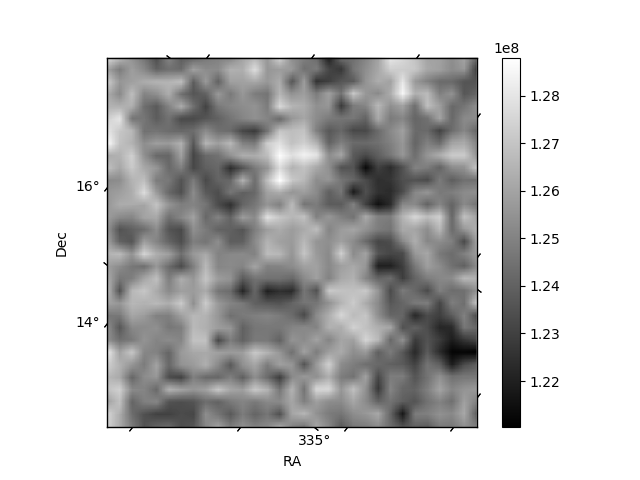
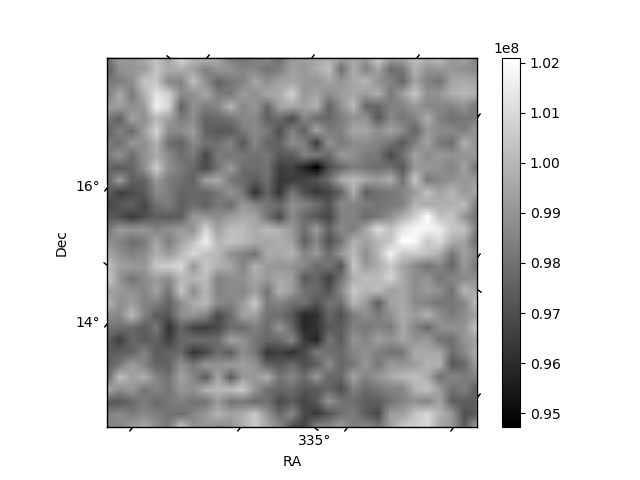
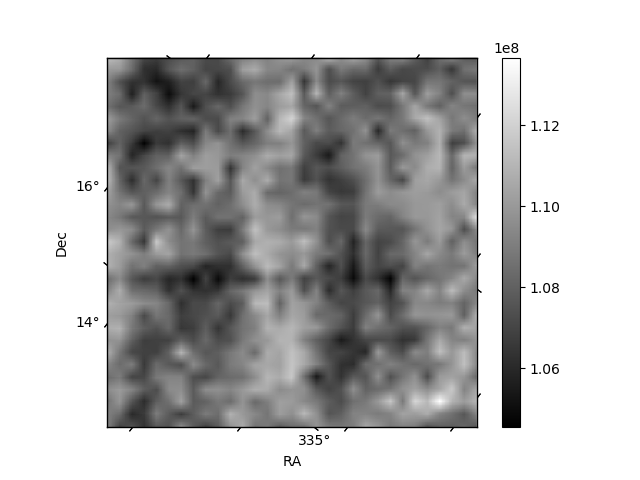
Histogram calculated using DETX and DETY for each event in the final _common_clean file
| Quadrant A | 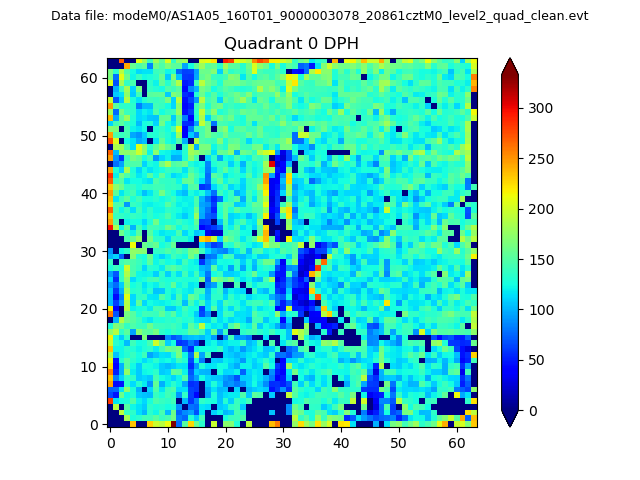 |
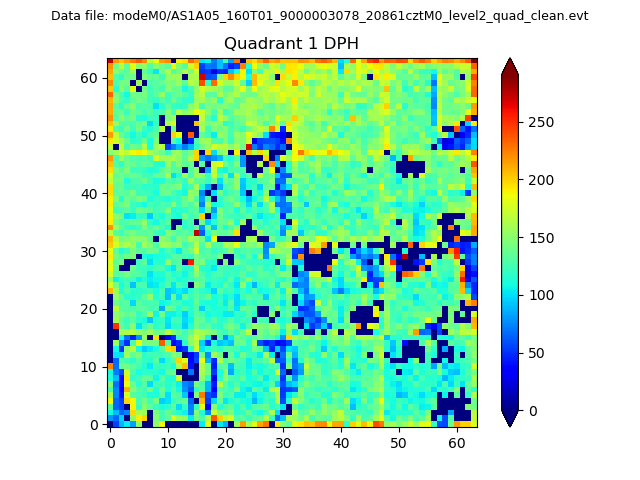 |
Quadrant B |
|---|---|---|---|
| Quadrant D | 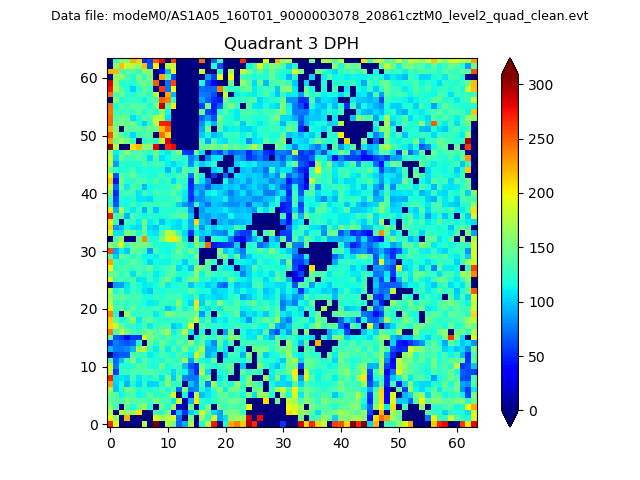 |
 |
Quadrant C |
| Plot type | Count rate plots | Images |
|---|---|---|
| Comparison with Poisson distribution Blue bars denote a histogram of data divided into 1 sec bins. Red curve is a Poisson curve with rate = median count rate of data. |
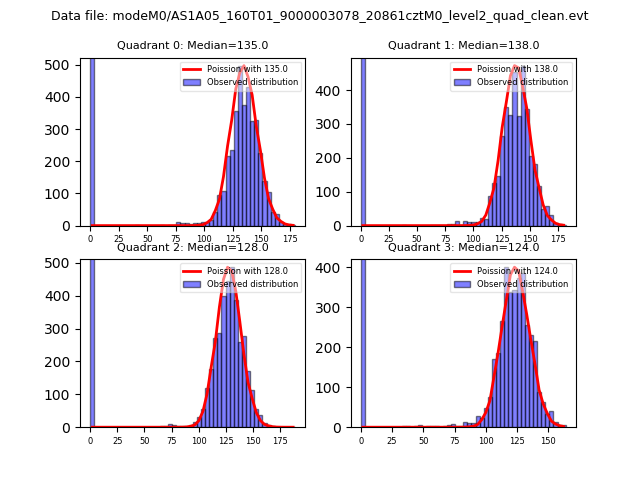 |
 |
| Quadrant-wise count rates Data is divided into 100 sec bins |
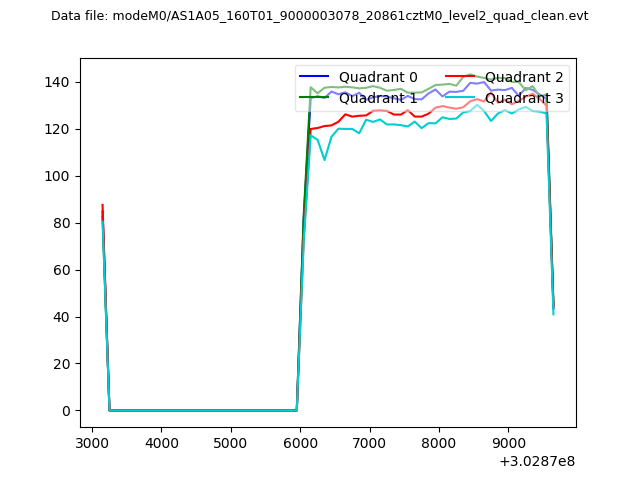 |
|
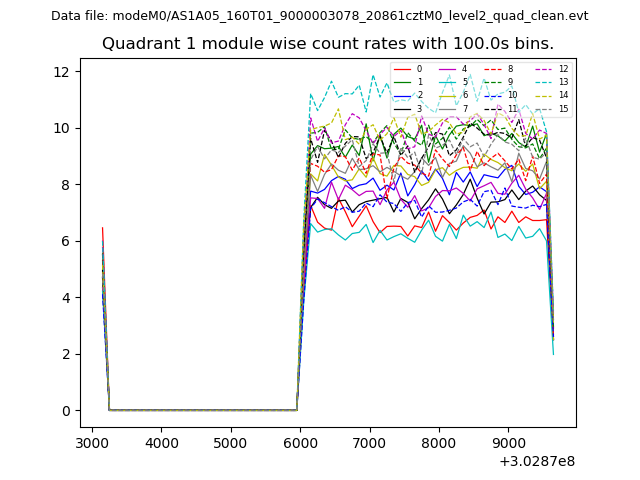
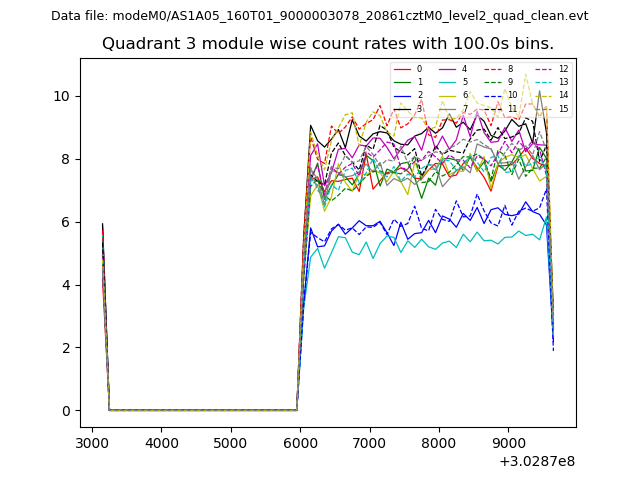
| Module-wise count rates for Quadrant A Data is divided into 100 sec bins |
 |
 |
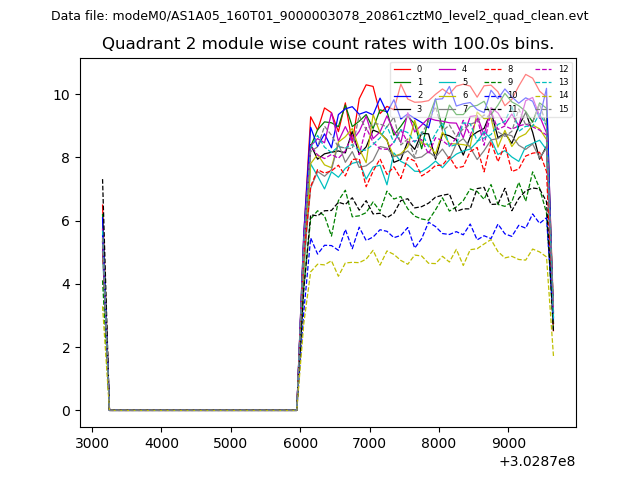
| Module-wise count rates for Quadrant B Data is divided into 100 sec bins |
 |
 |
| Module-wise count rates for Quadrant C Data is divided into 100 sec bins |
 |
 |
| Module-wise count rates for Quadrant D Data is divided into 100 sec bins |
 |
 |
| Parameter | Plot |
|---|---|
| CZT HV Monitor | 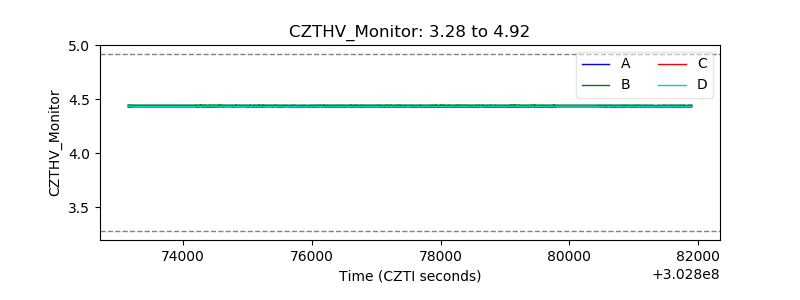 |
| D_VDD |  |
| Temperature 1 | 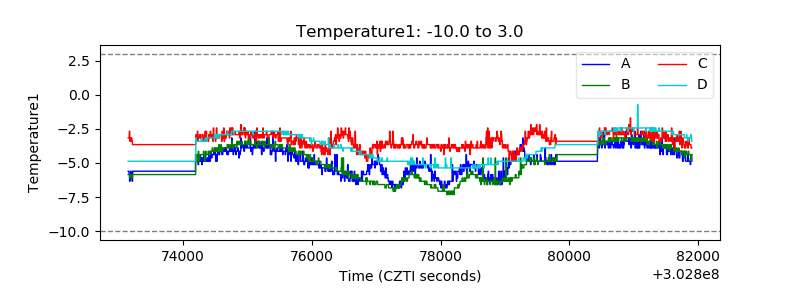 |
| Veto HV Monitor | 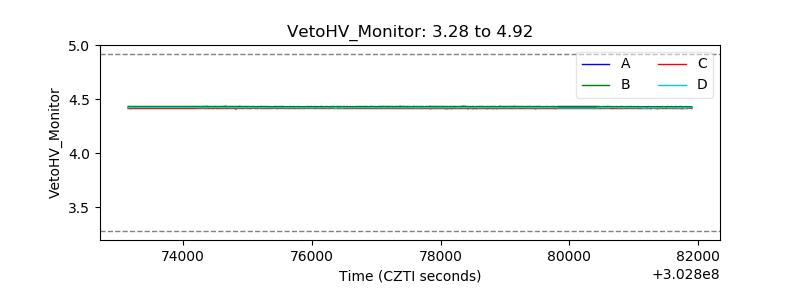 |
| Veto LLD |  |
| Alpha Counter | 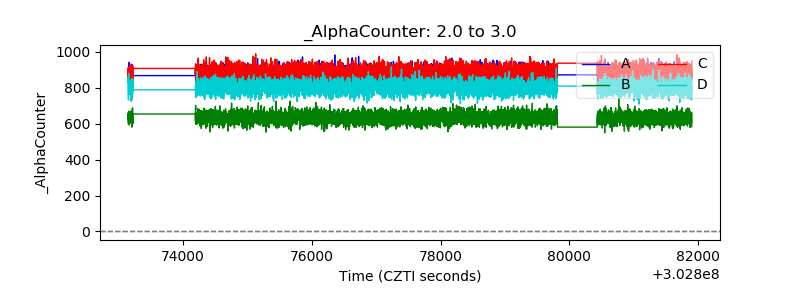 |
| _CPM_Rate | 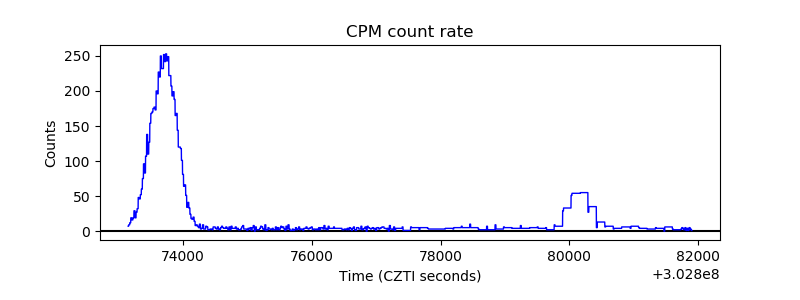 |
| CZT Counter | 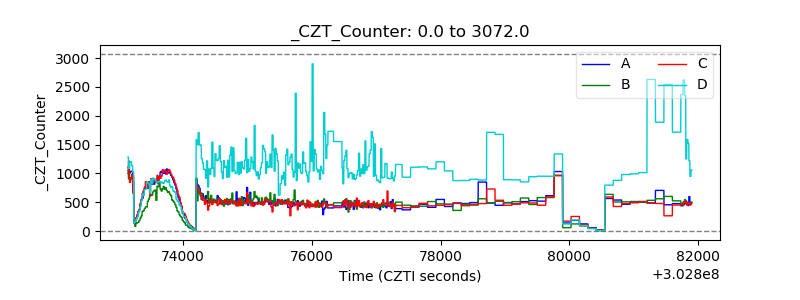 |
| +2.5 Volts monitor |  |
| +5 Volts monitor |  |
| _ROLL_ROT | 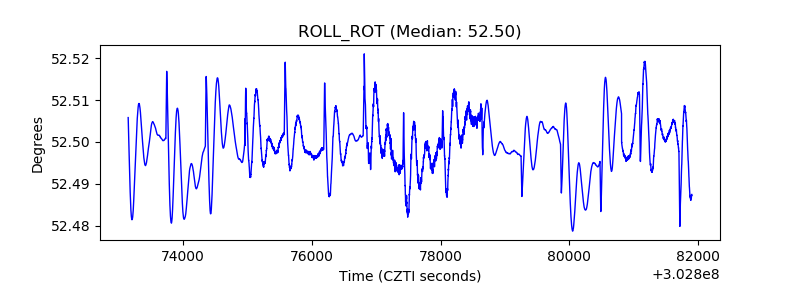 |
| _Roll_DEC | 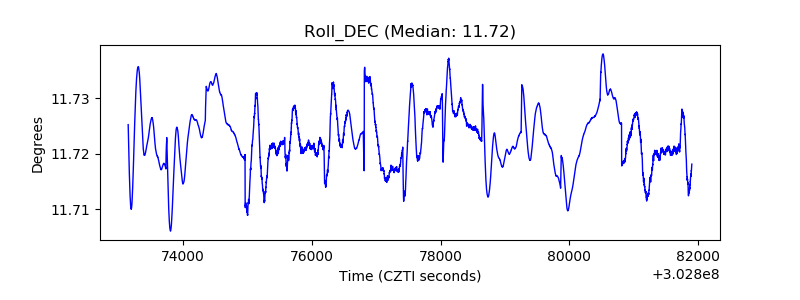 |
| _Roll_RA | 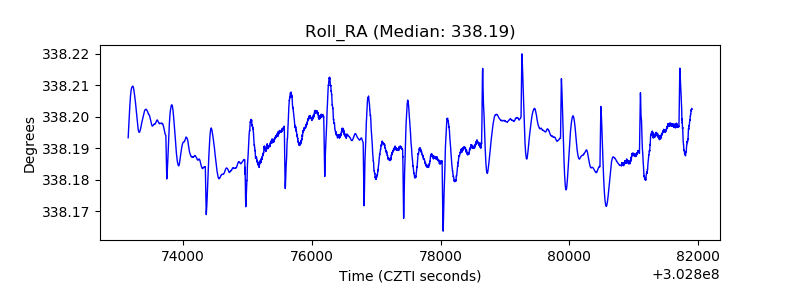 |
| Veto Counter |  |